. 2020 Sep;39(9):2738-2749.
doi: 10.1109/TMI.2020.2974858. Epub 2020 Feb 18.

Multi-Contrast Super-Resolution MRI Through a Progressive Network

Multi-Contrast Super-Resolution MRI Through a Progressive Network

Qing Lyu et al. IEEE Trans Med Imaging. 2020 Sep.

Abstract

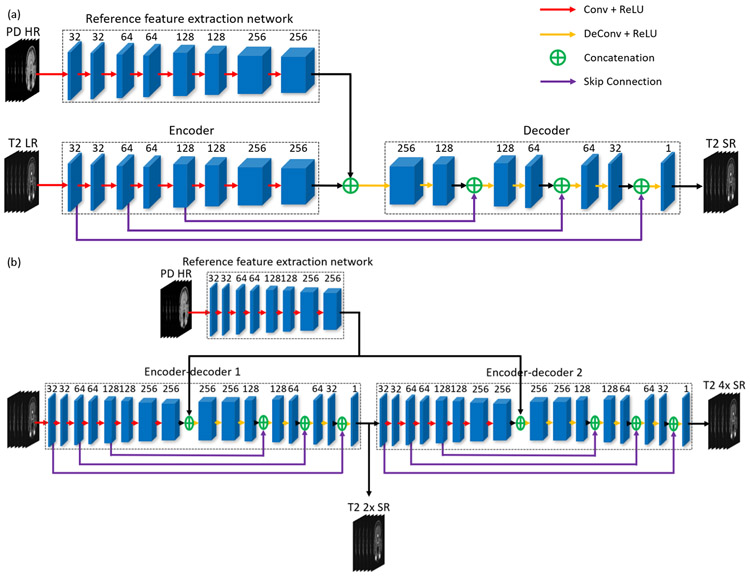
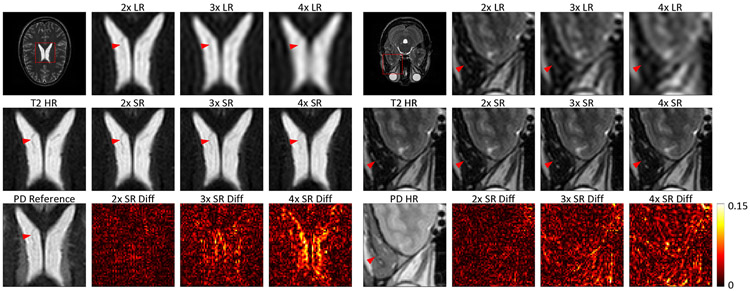
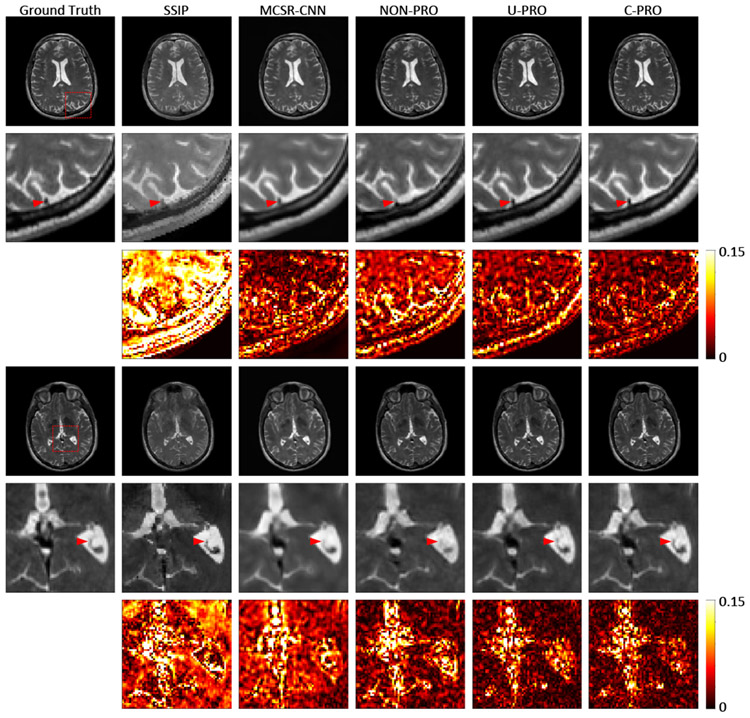
Magnetic resonance imaging (MRI) is widely used for screening, diagnosis, image-guided therapy, and scientific research. A significant advantage of MRI over other imaging modalities such as computed tomography (CT) and nuclear imaging is that it clearly shows soft tissues in multi-contrasts. Compared with other medical image super-resolution methods that are in a single contrast, multi-contrast super-resolution studies can synergize multiple contrast images to achieve better super-resolution results. In this paper, we propose a one-level non-progressive neural network for low up-sampling multi-contrast super-resolution and a two-level progressive network for high up-sampling multi-contrast super-resolution. The proposed networks integrate multi-contrast information in a high-level feature space and optimize the imaging performance by minimizing a composite loss function, which includes mean-squared-error, adversarial loss, perceptual loss, and textural loss. Our experimental results demonstrate that 1) the proposed networks can produce MRI super-resolution images with good image quality and outperform other multi-contrast super-resolution methods in terms of structural similarity and peak signal-to-noise ratio; 2) combining multi-contrast information in a high-level feature space leads to a significantly improved result than a combination in the low-level pixel space; and 3) the progressive network produces a better super-resolution image quality than the non-progressive network, even if the original low-resolution images were highly down-sampled.


Figures

Fig. 1.
Fig. 1.
Two proposed network architectures for MCSR. (a) The generator of the proposed onelevel non-progressive model, which contains an encoder-decoder network and a reference feature extraction network, and (b) the generator of the proposed two-level progressive model.
Fig. 2.
Fig. 2.
Results of tuning hyperparameters in the objective function (the x-axes are on the logarithmic scale).
Fig. 3.
Fig. 3.
Comparison between different models used in our ablation studies in terms of the perceptual loss, mean-squared-error (MSE) loss, Wasserstein distance, PSNR and SSIM.
Fig. 4.
Fig. 4.
Schematic views of the four ablation studies. (a)-(d) corresponds to the proposed four ablation studies. The blue block represents the encoder-decoder network and the orange block stands for the reference feature extraction network. (a) The first study is an SISR study in which the input is a T2 weighted LR image, and the output is an T2 weighted SR image. (b) The second study is an image synthesis study in which the input is a PD weighted HR image, and the output is a T2 weighted SR image. (c) The third study is an MCSR study in which the input is a T2 weighted LR image, with the PD weighted HR image as the reference, the output is the T2 weighted SR image. Multi-contrast information is combined in a low-level image space. (d) The fourth study is also an MCSR study in which the input is a T2 weighted LR image, with the PD weighted HR image as the reference, the output is the T2 weighted SR image. Multi-contrast information is combined in a high-level feature space. (d) is also the schematic view of the network shown in Fig. 1(a).
Fig. 5.
Fig. 5.
Results from the ablation-based evaluation. T2 LR, T2 HR, and PD stand for the input low-resolution T2-weighted image, high-resolution T2-weighted ground truth image, and high-resolution reference image in proton density contrast. SR1, SR2, SR3, and SR4 indicate the results from the four ablation studies respectively. The hot maps in the bottom row show the absolute pixel-value differences between the ablation study results and the corresponding ground truth T2 weighted HR image respectively.
Fig. 6.
Fig. 6.
T2 weighted SR results with different down-sampling factors based on the IXI dataset. 2×LR, 3×LR, and 4×LR stand for low-resolution T2-weighted images with different down-sampling factors. T2 HR and PD stand for the input low-resolution T2-weighted image and high-resolution reference image in proten density contrast respectively. 2×SR, 3×SR, and 4×SR represent T2-weighted super-resolution results from the corresponding LR images respectively. The hot maps show the absolute pixel-value differences between MCSR results and the ground truth T2 weighted HR image.
Fig. 7.
Fig. 7.
T2 weighted SR results with different down-sampling factors based on the NAMIC dataset. 2×LR, 3×LR, and 4×LR stand for low-resolution T2-weighted images with different down-sampling factors. T2 HR and T1 stand for the input low-resolution T2-weighted image and high-resolution reference image in T1 contrast respectively. 2×SR, 3×SR, and 4×SR represent T2-weighted super-resolution results from the corresponding LR images respectively. The hot maps show the absolute pixel-value differences between the corresponding MCSR results and the ground truth T1 weighted HR images.
Fig. 8.
Fig. 8.
Comparison of the two-level progressive network outputs with their ground truths. 2×LR represents the ground truth at the first level, and T2 HR stands for the ground truth at the second level. 2×PRO SR shows the outputs of the first level, and 4×PRO SR the outputs of the second level.
Fig. 9.
Fig. 9.
Comparisons of T2 weighted MCSR results from the our method and other state-of-the-art methods. Results are all based on the 4-fold down-sampled IXI dataset. SSIP and MCSR-CNN are two state-of-the art MCSR methods. NON-PRO indicates results obtained using the one-level non-progressive model. U-PRO and C-PRO denote MCSR results using the two-level progressive networks. The hot maps show the absolute pixel-value differences between the super-resolution results and the ground truth T2 weighted HR images.
Fig. 10.
Fig. 10.
Comparison of T2 weighted MCSR results obtained using the our method and other state-of-the-art methods. The results are all based on the 4-fold down-sampled NAMIC dataset. SSIP and MCSR-CNN are two state-of-the art MCSR methods. NON-PRO indicates the results from the one-level non-progressive model. U-PRO and C-PRO denote MCSR results using the two-level progressive networks. The hot maps show the absolute pixel-value differences between the super-resolution results and the ground truth T2 weighted HR images.

References

    1. Plenge E, Poot DH, Bernsen M, Kotek G, Houston G, Wielopolski P, et al., “Super-resolution methods in MRI: Can they improve the trade-off between resolution, signal-to-noise ratio, and acquisition time?” Magnetic resonance in medicine, vol. 68, no. 6, pp. 1983–1993, 2012. - PubMed
    1. Van Reeth E, Tham IW, Tan CH, and Poh CL, “Super-resolution in magnetic resonance imaging: A review,” Concepts in Magnetic Resonance Part A, vol. 40, no. 6, pp. 306–325, 2012.
    1. Park SC, Park MK, and Kang MG, “Super-resolution image reconstruction: a technical overview,” IEEE signal processing magazine, vol. 20, no. 3, pp. 21–36, 2003.
    1. Hardie R, “A fast image super-resolution algorithm using an adaptive Wiener filter,” IEEE Transactions on Image Processing, vol. 16, no. 12, pp. 2953–2964, 2007. - PubMed
    1. Manjón JV, Coupé P, Buades A, Fonov V, Collins DL, and Robles M, “Non-local MRI upsampling,” Medical image analysis, vol. 14, no. 6, pp. 784–792, 2010. - PubMed

Publication types

MeSH terms