. 2020 Mar 18;40(12):2403-2415.
doi: 10.1523/JNEUROSCI.1514-19.2020. Epub 2020 Feb 21.

α2δ-2 Protein Controls Structure and Function at the Cerebellar Climbing Fiber Synapse

Affiliations

α2δ-2 Protein Controls Structure and Function at the Cerebellar Climbing Fiber Synapse

Kathleen A Beeson et al. J Neurosci. .

Abstract

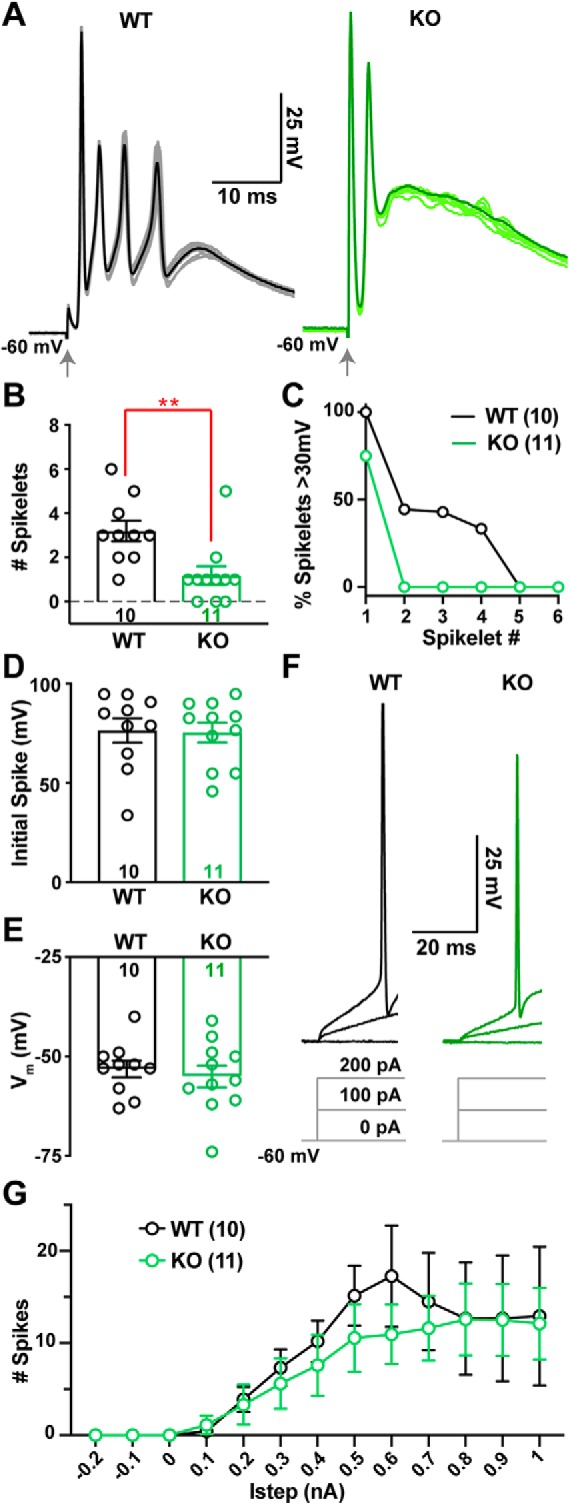
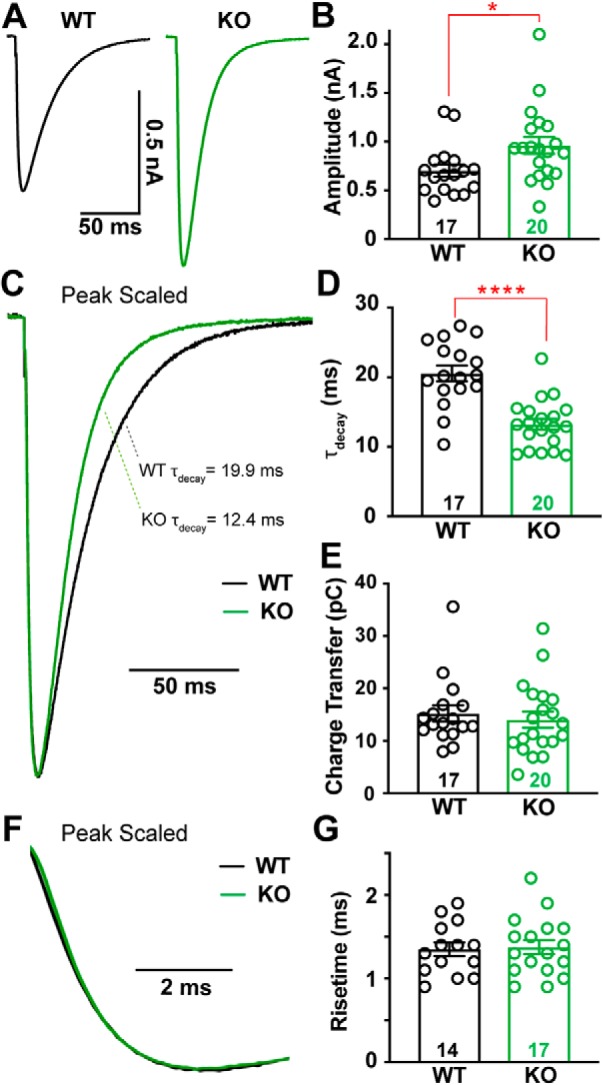
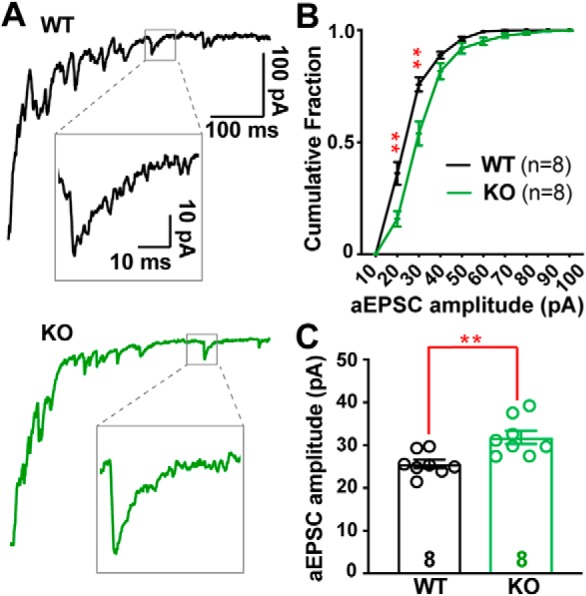
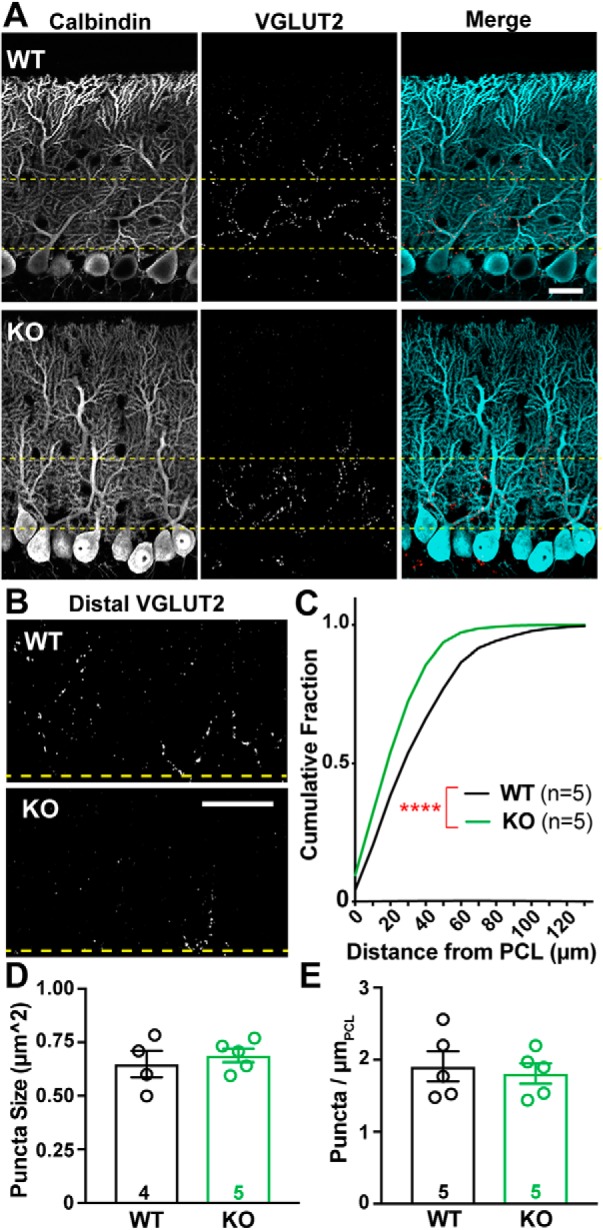
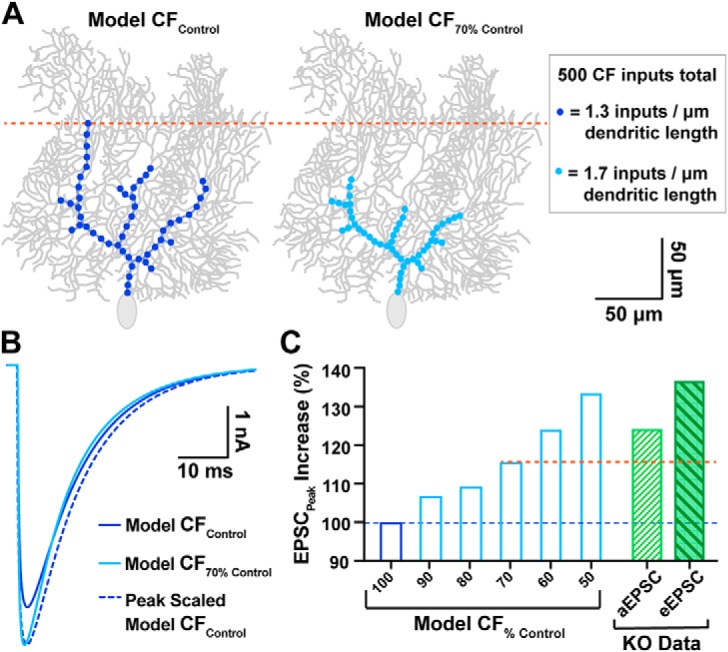
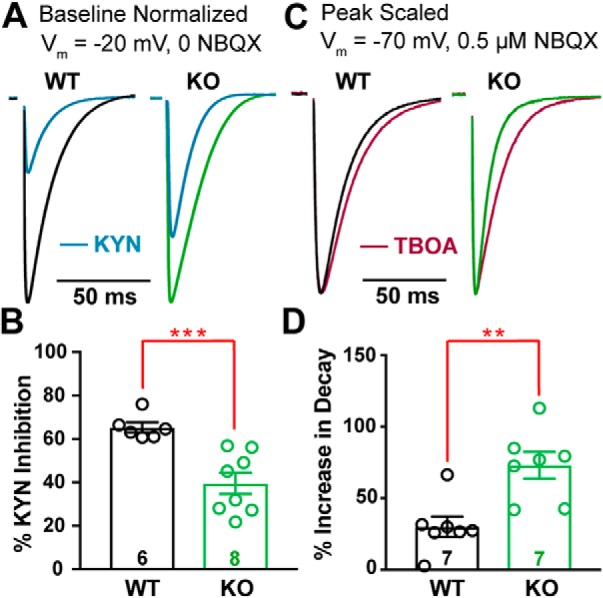
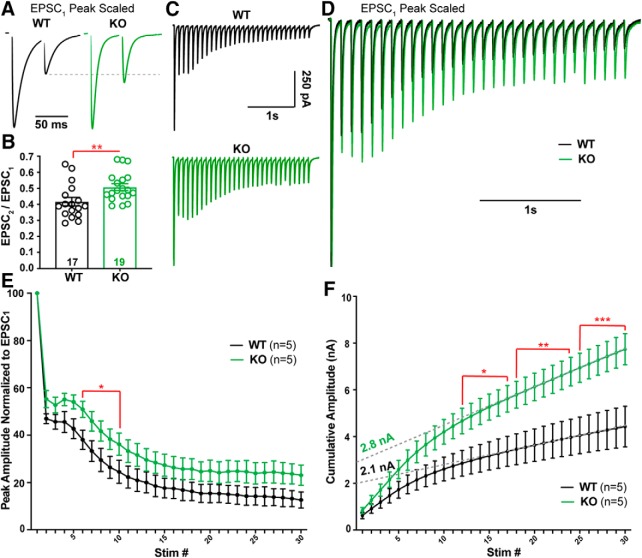
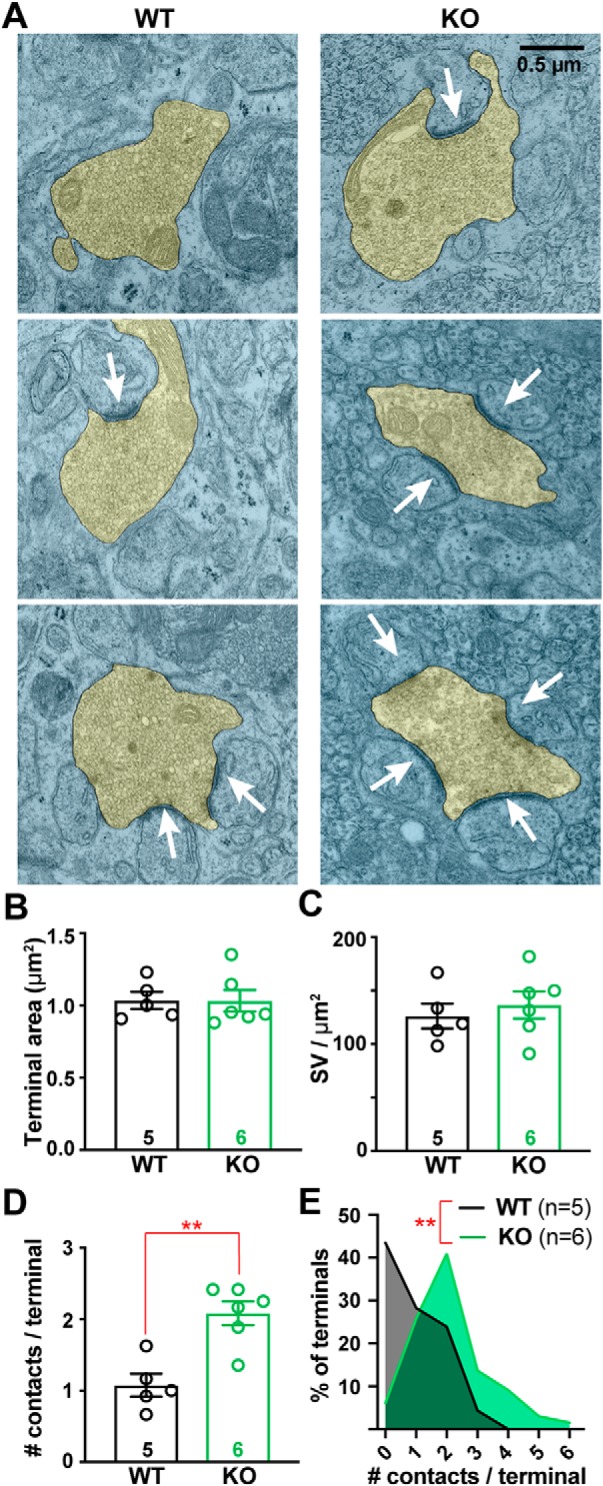
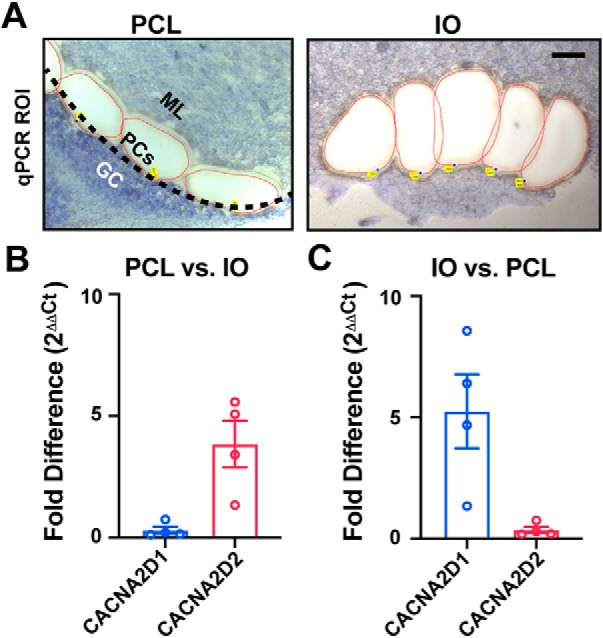
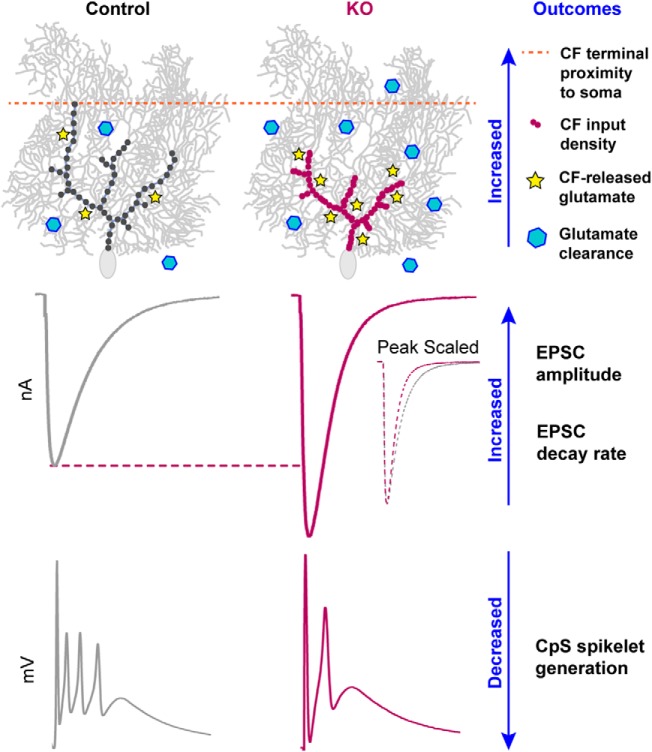
α2δ proteins (Cacna2d1-4) are auxiliary subunits of voltage-dependent calcium channels that also drive synapse formation and maturation. Because cerebellar Purkinje cells (PCs) predominantly, if not exclusively, express one isoform of this family, α2δ-2 (Cacna2d2), we used PCs as a model system to examine roles of α2δ in excitatory synaptic function in male and female Cacna2d2 knock-out (KO) mice. Whole-cell recordings of PCs from acute cerebellar slices revealed altered climbing fiber (CF)-evoked complex spike generation, as well as increased amplitude and faster decay of CF-evoked EPSCs. CF terminals in the KO were localized more proximally on PC dendrites, as indicated by VGLUT2+ immunoreactive puncta, and computational modeling demonstrated that the increased EPSC amplitude can be partly attributed to the more proximal location of CF terminals. In addition, CFs in KO mice exhibited increased multivesicular transmission, corresponding to greater sustained responses during repetitive stimulation, despite a reduction in the measured probability of release. Electron microscopy demonstrated that mutant CF terminals had twice as many vesicle release sites, providing a morphologic explanation for the enhanced glutamate release. Though KO CFs evoked larger amplitude EPSCs, the charge transfer was the same as wild-type as a result of increased glutamate reuptake, producing faster decay kinetics. Together, the larger, faster EPSCs in the KO explain the altered complex spike responses, which degrade information transfer from PCs and likely contribute to ataxia in Cacna2d2 KO mice. Our results also illustrate the multidimensional synaptic roles of α2δ proteins.SIGNIFICANCE STATEMENT α2δ proteins (Cacna2d1-4) regulate synaptic transmission and synaptogenesis, but coexpression of multiple α2δ isoforms has obscured a clear understanding of how various α2δ proteins control synaptic function. We focused on roles of the α2δ-2 protein (Cacna2d2), the deletion of which causes cerebellar ataxia and epilepsy in mice and humans. Because cerebellar Purkinje cells (PCs) only express this single isoform, we studied excitatory climbing fiber synaptic function onto PCs in Cacna2d2 KO mice. Using optical and electrophysiological analysis, we provide a detailed description of the changes in PCs lacking α2δ-2, and provide a comprehensive mechanistic explanation for how functional synaptic phenotypes contribute to the altered cerebellar output.

Keywords: CACNA2D2; Purkinje cell; alpha2delta proteins; calcium channel; climbing fiber.


Figures

Figure 1.
Figure 1.
CF-evoked complex spikes (CpSs) are altered in the Cacna2d2 KO, but intrinsic PC excitability is unchanged. A, Representative CF-evoked complex spikes in WT (left) and KO (right) PCs, arrow indicates CF stimulation. Each trace consists of 10 overlaid traces (lighter color) and the corresponding CpS average (dark color). B, Average number of spikelets per CpS in WT and KO PCs; **p < 0.01 (Mann–Whitney). C, Percentage of spikelets exceeding 30 mV trough-to-peak amplitude, ordered by spikelet number. D, Average CpS initial spike amplitude; p = 0.89 (NS). E, Average PC membrane potential when in zero current mode; p = 0.60 (NS). F, Representative single traces of membrane voltage responses to current injection, showing steps of 0, 100, 200 pA injections from Vm = −60 mV; left, WT (black); right, KO (green). Average Istep to initiate spiking WT = 200 ± 39 pA, n = 10; KO = 289 ± 82 pA, n = 9; p = 0.33 (NS). G, Average spike count during current steps from −0.2 to 1 nA, Vm = −60 mV. WT (black) and KO (green); p = 0.63 (NS; Two-way ANOVA with repeated measures, F(1,19) = 0.23). Data shown ± SEM, n = cells; unpaired Student's t test unless otherwise indicated.
Figure 2.
Figure 2.
CF-evoked EPSCs are larger and faster in Cacna2d2 KO mice, but total charge transfer is conserved. A, Representative CF-evoked EPSCs. Left, WT average (black); right, KO average (green). B, Average peak CF EPSC amplitude; *p < 0.05. C, Peak scaled EPSCs, demonstrating the relative decay time constants for these example traces (τdecay) based on single exponential fits; WT (black) and KO (green). D, τdecay (ms) for CF EPSCs in WT vs KO PCs; ****p < 0.0001. E, Average charge transfer within the first 100 ms of EPSC; p = 0.58 (NS). F, Peak scaled EPSCs, expanded to display risetime kinetics; WT (black) and KO (green). G, Average CF EPSC 20–80% risetime (ms); p = 0.83 (NS). Data are shown as ± SEM, n = cells; unpaired Student's t test.
Figure 3.
Figure 3.
Desynchronized CF-evoked vesicle release reveals larger quantal responses in Cacna2d2 KO. A, Representative CF-evoked EPSCs in the presence of 1.3 mm Sr2+; top, WT EPSC (black) and example asynchronous EPSC (aEPSC; inset); bottom, KO EPSC (green) and aEPSC (inset). B, Cumulative aESPC amplitude distribution graphed in 10 pA bins; WT (black) and KO (green); **p < 0.01 for 20 and 30 pA bins, all others NS (multiple t tests with Holm–Sidak correction for multiple comparisons). C, Average aEPSC amplitudes; **p < 0.01. Data are shown as ± SEM, n = cells; unpaired Student's t test.
Figure 4.
Figure 4.
CF terminal distribution, but not number, is altered in Cacna2d2 KO cerebellum. A, Representative images from p21 WT (above) and KO (below) tissue, depicting the PCL. Calbindin (left/blue in merge) marks PCs, and VGLUT2 immunoreactivity (middle/red in merge) marks CF terminals. Yellow lines demarcate the 50 μm most proximal to PC somata and is the region most highly innervated by climbing fibers. Scale bar, 20 μm. B, VGLUT2-immunoreactive CF terminals in the outer molecular layer, cropped at the distal yellow line (50 μm), illustrate differences in CF innervation of distal PC dendrites in WT (top) and KO (below) PCs. Scale bar, 20 μm. C, Cumulative distribution of VGLUT2+ puncta relative to PC somas in WT (black, n = 5 animals) and KO (green, n = 5 animals); ****p < 0.0001 (Kolmogorov–Smirnov test). D, Average VGLUT2+ punctum size was not significantly different between WT and KO terminals; p = 0.55 (NS). E, Average VGLUT2+ puncta density per length of PCL (puncta/ μmPCL) was not significantly different between WT and KO; p = 0.72 (NS). Unless otherwise stated, Data are shown as ± SEM, n = animal; unpaired Student's t test.
Figure 5.
Figure 5.
Computational PC model simulates the impact of proximally shifted CF inputs on EPSC waveform. A, Left, model CF input distribution similar to control PCs (dark blue; “model CFControl”) vs a similar PC with CF inputs shifted 30% more proximal (right, light blue, “model CF70% Control”), which matches the degree of proximal shift in WT vs KO innervation, respectively. All models conserved the total number of CF quantal inputs (500 inputs with 1 nS conductance), though input density was adjusted to accommodate the shortened region of CF innervation (see inset). B, Overlay of EPSC output waveforms from model CFControl simulations (dark blue; 4.7 nA), model CF70% Control (light blue; 5.4 nA), and peak scaled model CFControl to compare decay kinetics. For tau of decay; model CFControl τdecay = 12.0 ms; model CF70% Control τdecay = 10.2 ms). C, Predicted increase in EPSC peak amplitude for various degrees of proximally shifted model CFs (light blue bars, restricted to a zone 100–50% the width of control CFs, all including 500 quantal inputs) compared with model CFControl (dark blue bar). For comparison, the empirically determined increase in quantal EPSC (aEPSC; hatched green bar) and evoked EPSC (eEPSC; filled-hatched dark green bar) amplitudes in KO PCs are also displayed (derived from Figs. 3 and 2, respectively). The orange dotted line demarcates the predicted EPSC increase from the model based on the observed shift in CF location.
Figure 6.
Figure 6.
Cacna2d2 KO has increased glutamate release and clearance at CF–PC synapses. A, Representative CF EPSCs recorded at Vm = −20 mV in the absence of NBQX for WT and KO PCs (relative scales; WT = black; KO = green). For each, traces after exposure to 1 mm kynurenic acid (KYN; blue) are shown normalized to baseline EPSC amplitudes. B, Percentage inhibition of ESPC peak amplitude by KYN; ***p < 0.001. C, Representative normalized CF-evoked EPSCs recorded at Vm = −70 mV in the presence of 0.5 μm NBQX; left, WT average (black); right, KO average (green). Overlay average peak-scaled traces after exposure to 50 μm DL-TBOA (TBOA; magenta). D, Average increase in EPSC decay by TBOA; **p < 0.01. Data are shown as ± SEM, n = cells; unpaired Student's t test.
Figure 7.
Figure 7.
Repetitive stimulation of CF synapses reveals a lower probability of release and greater cumulative release in Cacna2d2 KO. A, Representative traces from WT (black) and KO (green) PCs during 50 ms paired-pulse stimulation. Traces are scaled to the first EPSC (EPSC1). Dotted gray line shows paired-pulse depression of the second EPSC (EPSC2) in WT compared with KO. B, Average paired-pulse ratio (EPSC2 /EPSC1); **p < 0.01. C, Representative traces in response to 10 Hz stimulation; WT (black); KO (green). D, Traces from (C) peak scaled to EPSC1 and overlaid, illustrating different relative steady-state EPSC amplitudes during latter portions of the train. E, Summary data of EPSC amplitudes normalized to EPSC1 during 10 Hz stimulation in WT (black) and KO (green). *p < 0.05 (multiple t tests with Holm–Sidak correction). F, EPSC amplitudes during 10 Hz stimulation plotted as cumulative amplitude from WT (black) and KO (green). For comparison of cumulative amplitude between WT and KO at various stimulation numbers (stim #); *p < 0.05, **p < 0.01, ***p < 0.001 (multiple t tests with Holm–Sidak correction). Dotted gray lines illustrate a linear fit to cumulative amplitude between stim # 20–30 from WT and KO trains. Data are shown as ± SEM, n = cells; unpaired Student's t test unless otherwise indicated.
Figure 8.
Figure 8.
CF terminals have increased numbers of synaptic contacts in Cacna2d2 KO animals. A, Representative transmission electron micrographs of CF terminals (pseudocolored yellow) from p21 WT (left) and KO (right) animals. White arrows indicate postsynaptic densities used to quantify synaptic contacts/terminal. Scale bar, 0.5 μm. B, Average CF terminal area (μm2); p = 0.55 (NS). C, Synaptic vesicle (SV) density (SV/ μm2) was not different between WT and KO animals; p = 0.57 (NS). D, Average number of contacts per CF terminal (# contacts/terminal) was increased in KO animals. **p < 0.01 (Mann–Whitney test). E, Histogram of all CFs analyzed from WT (black) and KO (green) cerebella, displaying the number of contacts per sampled CF terminal normalized to total number of CF terminals; **p < 0.01 (Kolmogorov–Smirnov test). Data are shown as ± SEM, n = animals using 15–20 images/animal; unpaired Student's t test unless otherwise stated.
Figure 9.
Figure 9.
Relative expression of Cacna2d transcripts by qPCR from Purkinje cell layer (PCL) and inferior olive (IO) tissues. A, Example PCL and IO regions of interest isolated by laser capture microdissection from fresh-frozen WT tissue. Left, PCL region of interest; black-dotted line indicates the monolayer of PCs that have been dissected along with regions of the inner molecular layer (ML; granule cells, GC). Right, IO region of interest; one hemisphere from a coronal section of ventral brainstem, scale = 100 μm. (B, C) Fold difference (2−ΔΔCt) expression of Cacna2d isoforms by quantitative PCR comparing (B) PCL versus IO, and (C) IO versus PCL samples. Data are shown as ± SEM, n = 4 animals.
Figure 10.
Figure 10.
Summary of CF–PC phenotypes in Cacna2d2 KO mice. Proximal distribution of CF inputs onto KO PCs enhanced postsynaptic quantal responses to CF glutamate release, and the increased number of synaptic release sites increased total glutamate concentration. Together, this resulted in a 140% EPSC amplitude in the KO compared with control. Counteracting effects included a lower CF PR and enhanced glutamate clearance, which doubled the EPSC decay rate. Ultimately, larger synaptic conductances in the KO likely contribute to depolarization block of CF-evoked spikelet generation.

References

    1. Auger C, Attwell D (2000) Fast removal of synaptic glutamate by postsynaptic transporters. Neuron 28:547–558. 10.1016/S0896-6273(00)00132-X - DOI - PubMed
    1. Barclay J, Balaguero N, Mione M, Ackerman SL, Letts VA, Brodbeck J, Canti C, Meir A, Page KM, Kusumi K, Perez-Reyes E, Lander ES, Frankel WN, Gardiner RM, Dolphin AC, Rees M (2001) Ducky mouse phenotype of epilepsy and ataxia is associated with mutations in the Cacna2d2 gene and decreased calcium channel current in cerebellar Purkinje cells. J Neurosci 21:6095–6104. 10.1523/JNEUROSCI.21-16-06095.2001 - DOI - PMC - PubMed
    1. Bergles DE, Dzubay JA, Jahr CE (1997) Glutamate transporter currents in bergmann glial cells follow the time course of extrasynaptic glutamate. Proc Natl Acad Sci U S A 94:14821–14825. 10.1073/pnas.94.26.14821 - DOI - PMC - PubMed
    1. Bosman LW, Konnerth A (2009) Activity-dependent plasticity of developing climbing fiber-Purkinje cell synapses. Neuroscience 162:612–623. 10.1016/j.neuroscience.2009.01.032 - DOI - PubMed
    1. Brockhaus J, Schreitmüller M, Repetto D, Klatt O, Reissner C, Elmslie K, Heine M, Missler M (2018) α-neurexins together with α2δ-1 auxiliary subunits regulate Ca2+ influx through Cav2.1 channels. J Neurosci 38:8277–8294. 10.1523/JNEUROSCI.0511-18.2018 - DOI - PMC - PubMed

Publication types

LinkOut - more resources