. 2020 May;48(5):368-377.
doi: 10.1124/dmd.119.089276. Epub 2020 Feb 21.

Evaluation of Quantitative Relationship Between Target Expression and Antibody-Drug Conjugate Exposure Inside Cancer Cells

Affiliations

Evaluation of Quantitative Relationship Between Target Expression and Antibody-Drug Conjugate Exposure Inside Cancer Cells

Sharad Sharma et al. Drug Metab Dispos. 2020 May.

Abstract

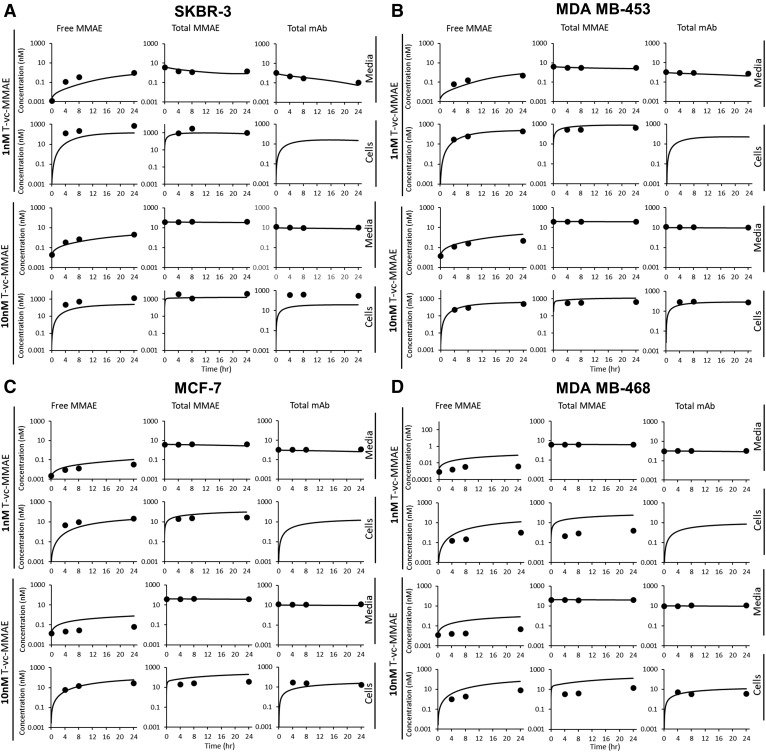
Antibody-drug conjugates (ADCs) employ overexpressed cell surface antigens to deliver cytotoxic payloads inside cancer cells. However, the relationship between target expression and ADC efficacy remains ambiguous. In this manuscript, we have addressed a part of this ambiguity by quantitatively investigating the effect of antigen expression levels on ADC exposure within cancer cells. Trastuzumab-valine-citrulline-monomethyl auristatin E was used as a model ADC, and four different cell lines with diverse levels of human epidermal growth factor receptor 2 (HER2) expression were used as model cells. The pharmacokinetics (PK) of total trastuzumab, released monomethyl auristatin E (MMAE), and total MMAE were measured inside the cells and in the cell culture media following incubation with two different concentrations of ADC. In addition, target expression levels, target internalization rate, and cathepsin B and MDR1 protein concentrations were determined for each cell line. All the PK data were mathematically characterized using a cell-level systems PK model for ADC. It was found that SKBR-3, MDA-MB-453, MCF-7, and MDA-MB-468 cells had ∼800,000, ∼250,000, ∼50,000, and ∼10,000 HER2 receptors per cell, respectively. A strong linear relationship (R 2 > 0.9) was observed between HER2 receptor count and released MMAE exposure inside the cancer cells. There was an inverse relationship found between HER2 expression level and internalization rate, and cathepsin B and multidrug resistance protein 1 (MDR1) expression level varied slightly among the cell lines. The PK model was able to simultaneously capture all the PK profiles reasonably well while estimating only two parameters. Our results demonstrate a strong quantitative relationship between antigen expression level and intracellular exposure of ADCs in cancer cells. SIGNIFICANCE STATEMENT: In this manuscript, we have demonstrated a strong linear relationship between target expression level and antibody-drug conjugate (ADC) exposure inside cancer cells. We have also shown that this relationship can be accurately captured using the cell-level systems pharmacokinetics model developed for ADCs. Our results indirectly suggest that the lack of relationship between target expression and efficacy of ADC may stem from differences in the pharmacodynamic properties of cancer cells.


Figures

Fig. 1.
Fig. 1.
Cellular disposition model for T-vc-MMAE. The circle represents intracellular space and the region outside the circle represents extracellular media space. The model shows cell surface receptor (HER2) binding to ADC (T-vc-MMAE), followed by receptor mediated internalization. The internalized ADC transits through endosomal/lysosomal compartment where it gets degraded to release free MMAE, which can interact with intracellular tubulin or effluxes out into the media space. Free MMAE can also be generated outside the cells by nonspecific deconjugation of ADC in cell culture media. Please refer to Tables 1 and 2 for detailed description of the symbols used in the figure.
Fig. 2.
Fig. 2.
HER2 receptor number quantification for different breast cancer cells by flow cytometry. (A) Histogram overlay of control (blue line) and Alexa Fluor 488–conjugated trastuzumab labeled cells (red line). The histograms show one representative result from three separate experiments. (B) Histogram overlay of QSC beads labeled with Alexa Fluor 488–conjugated trastuzumab. The histograms show one representative result from three separate experiments. (C) Antigen binding capacity vs. MFI plot generated using QuickCal v. 2.3 Data Analysis program. Three separate experiments are represented by open circles, squares, or triangles, with individual R values. (D) HER2 receptor count (mean ± S.D., n = 3) on SKBR-3, MDA-MB-453, MCF-7, and MDA-MB-468 cells.
Fig. 3.
Fig. 3.
Trastuzumab internalization rate determined for different breast cancer cells. (A) Bright green color in each image represents cell membrane bound and internalized fraction of Alexa Fluor 488–conjugated trastuzumab. Each image in the panel represents one cell out of 1500 gated cells that were used for calculation at each time point. (B) The plot of internalization score vs. time used to calculate internalization half-life. Solid square, upward triangle, and downward triangle represents SKBR-3, MDA-MB-453, and MCF-7 cells, respectively. Symbol represents mean and error bars represent S.D.
Fig. 4.
Fig. 4.
Cellular cathepsin B and MDR1 protein expression levels quantified for each breast cancer cell line using ELISA. (A) Cathepsin B. (B) MDR1. Bar plot represents mean ± S.D. of each protein concentration.
Fig. 5.
Fig. 5.
Cellular disposition of T-vc-MMAE. Intracellular (A–H) and extracellular (I–P) concentration vs. time plots for total trastuzumab (solid circle), free MMAE (solid square), and total MMAE (solid triangle) in breast cancer cells treated with 1 and 10 nM concentrations of T-vc-MMAEIntracellular concentrations of each cell line treated with 1 or 10nM T-vc-MMAE represented by panel (A-H)= (A, B, C, D, E, F, G, H)Extracellular concentrations of each cell line treated with 1 or 10nM T-vc-MMAE represented by panel (I-P)=(I, J, K, L, M, N, O, P).
Fig. 6.
Fig. 6.
Free MMAE exposure (AUC0–24hr) vs. HER2 receptor count plots. Intracellular (A) and extracellular (B) free MMAE exposure (mean ± S.E.M.) vs. HER2 receptor count (mean ± S.E.M.) plot, with respective R2 values, after treatment with 1 (open square) and 10 nM (solid square) concentrations of T-vc-MMAE.
Fig. 7.
Fig. 7.
Observed and model predicted concentration vs. time plots for intracellular and extracellular free MMAE, total MMAE, and total mAb concentrations. SKBR-3 (A), MDA-MB-453 (B), MCF-7 (C), and MDA-MB-468 (D) cells. All the data were simultaneously fitted using the single cell PK model for ADCs shown in Fig. 1.

References

    1. Ait-Oudhia S, Zhang W, Mager DE. (2017) A mechanism-based PK/PD model for hematological toxicities induced by antibody-drug conjugates. AAPS J 19:1436–1448. - PubMed
    1. Barok M, Tanner M, Köninki K, Isola J. (2011) Trastuzumab-DM1 causes tumour growth inhibition by mitotic catastrophe in trastuzumab-resistant breast cancer cells in vivo. Breast Cancer Res 13:R46. - PMC - PubMed
    1. Beck A, Goetsch L, Dumontet C, Corvaïa N. (2017) Strategies and challenges for the next generation of antibody-drug conjugates. Nat Rev Drug Discov 16:315–337. - PubMed
    1. Bornstein GG. (2015) Antibody drug conjugates: preclinical considerations. AAPS J 17:525–534. - PMC - PubMed
    1. Caculitan NG, Dela Cruz Chuh J, Ma Y, Zhang D, Kozak KR, Liu Y, Pillow TH, Sadowsky J, Cheung TK, Phung Q, et al. (2017) Cathepsin B is dispensable for cellular processing of cathepsin B-cleavable antibody-drug conjugates. Cancer Res 77:7027–7037. - PubMed

Publication types

MeSH terms