. 2020 Apr;10(4):568-587.
doi: 10.1158/2159-8290.CD-19-1059. Epub 2020 Feb 21.

Relapse-Fated Latent Diagnosis Subclones in Acute B Lineage Leukemia Are Drug Tolerant and Possess Distinct Metabolic Programs

Affiliations

Relapse-Fated Latent Diagnosis Subclones in Acute B Lineage Leukemia Are Drug Tolerant and Possess Distinct Metabolic Programs

Stephanie M Dobson et al. Cancer Discov. 2020 Apr.

Abstract

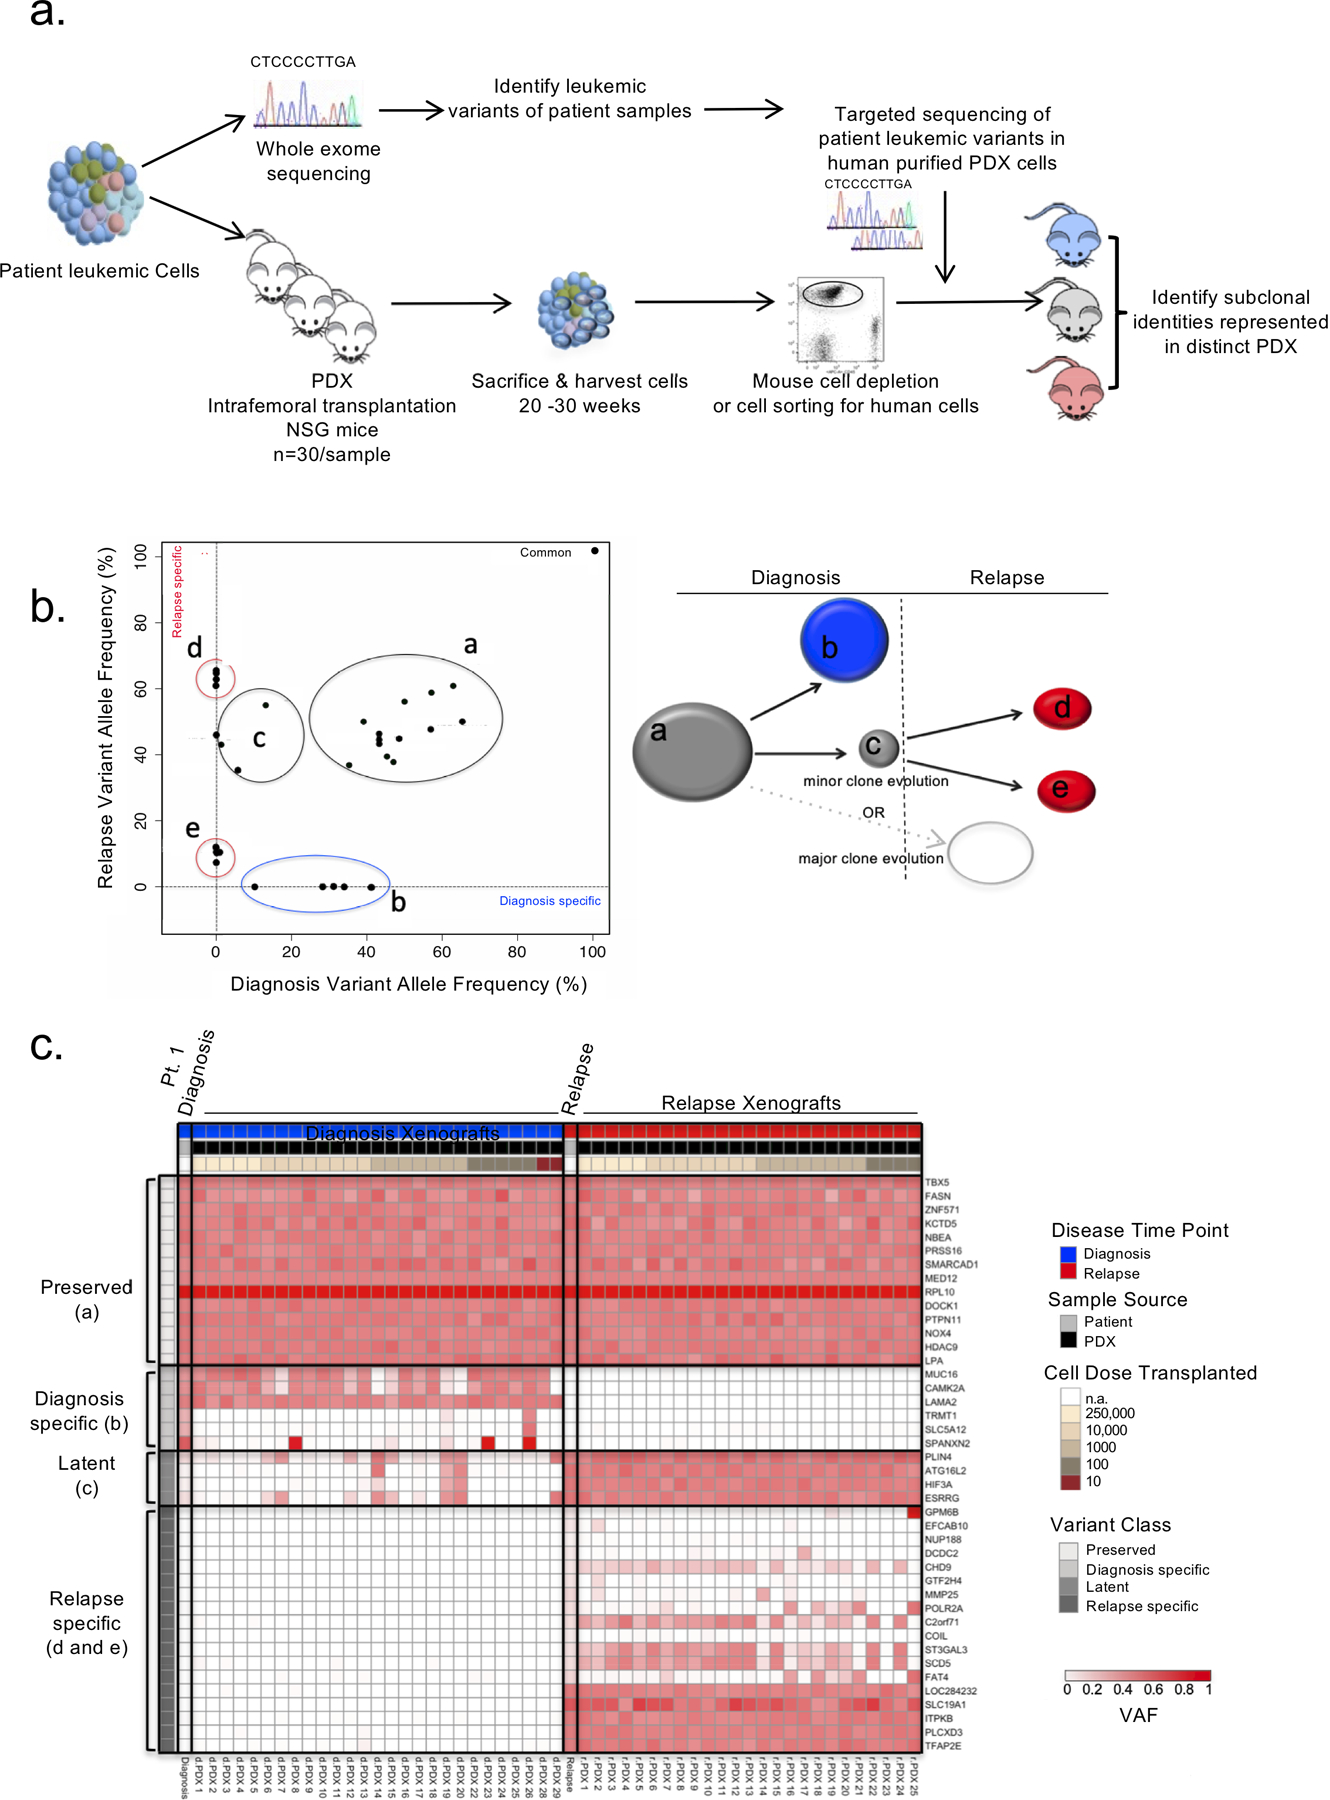
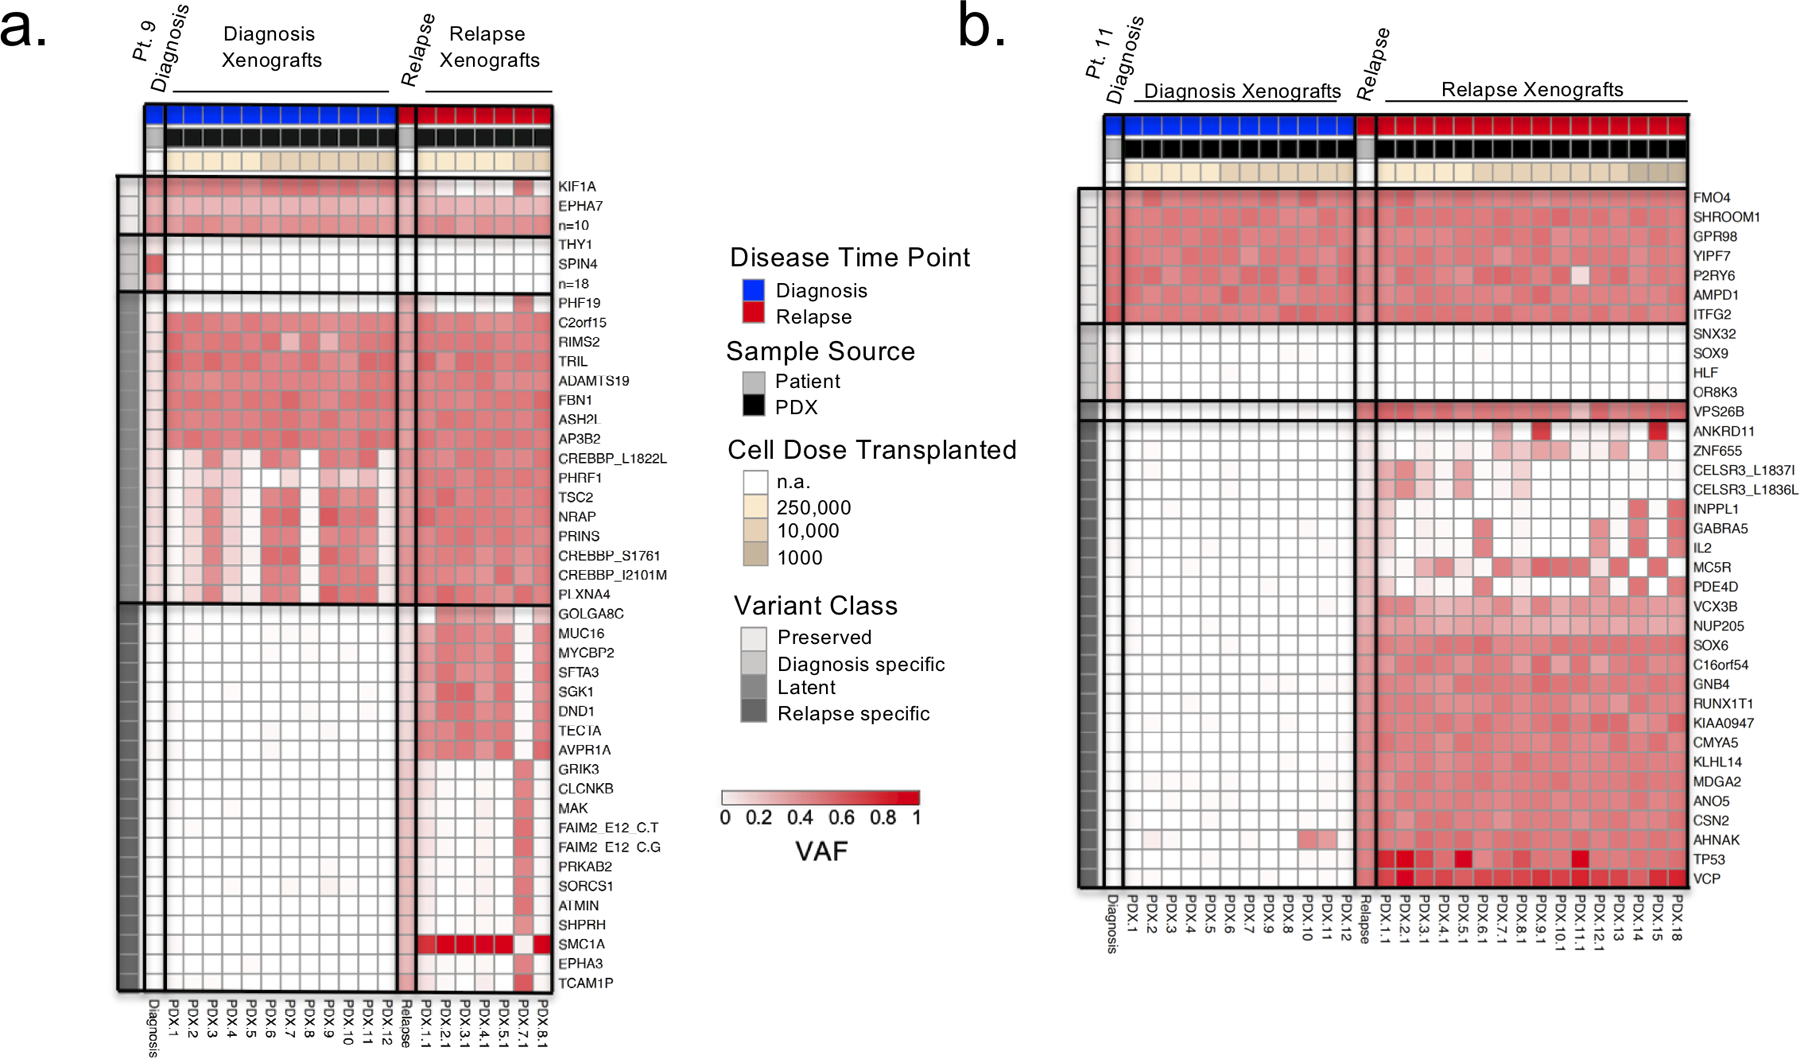
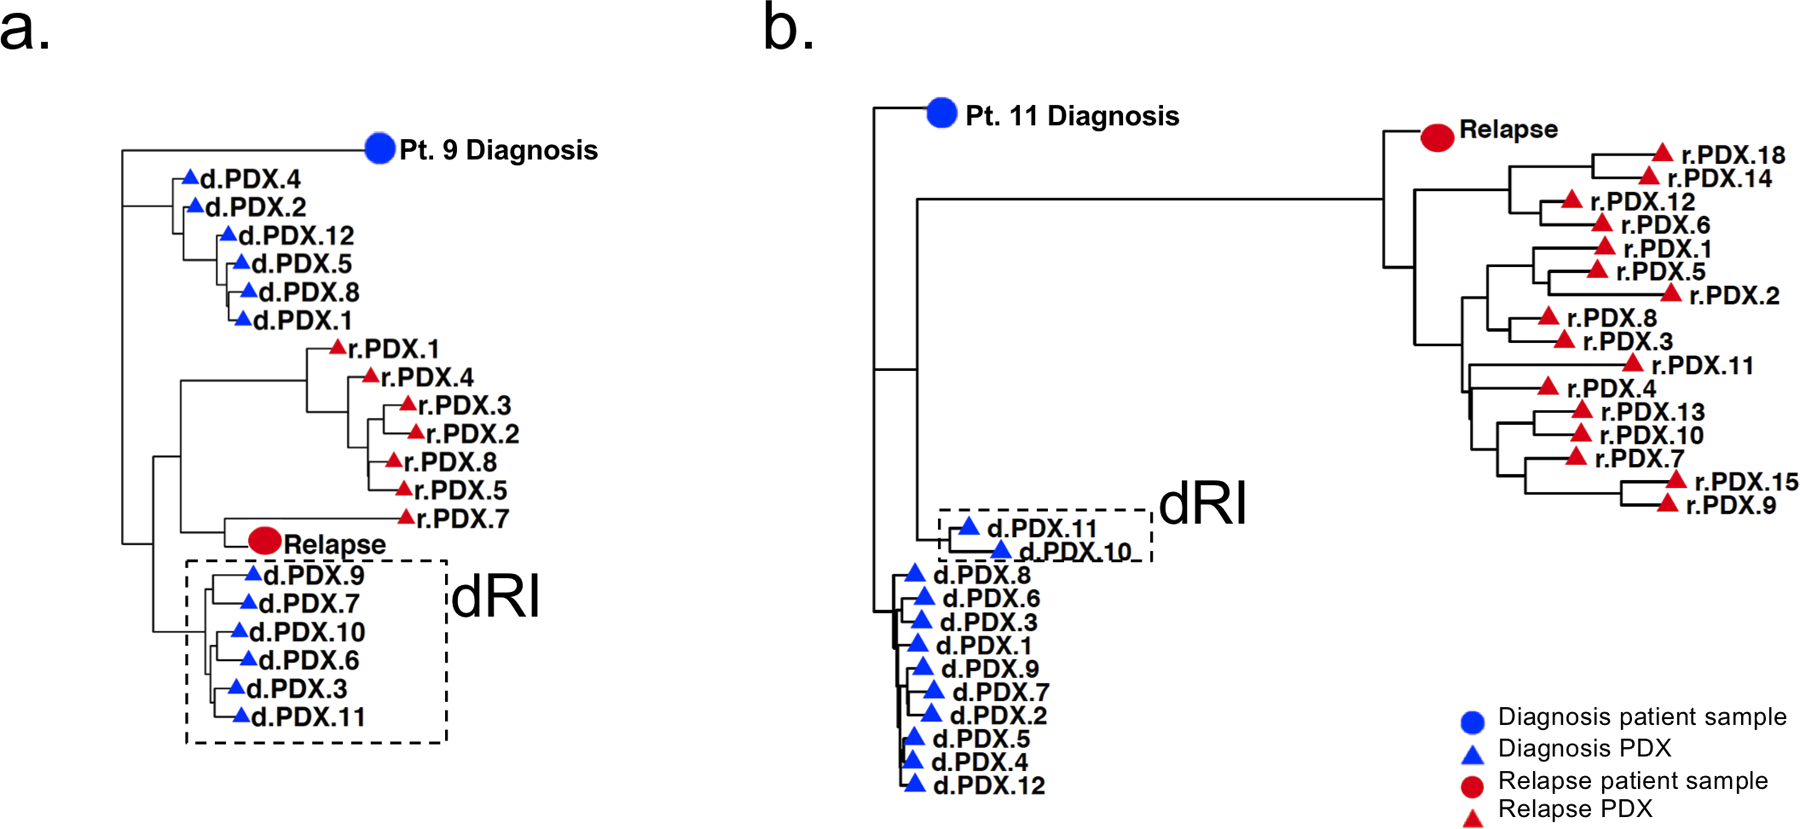
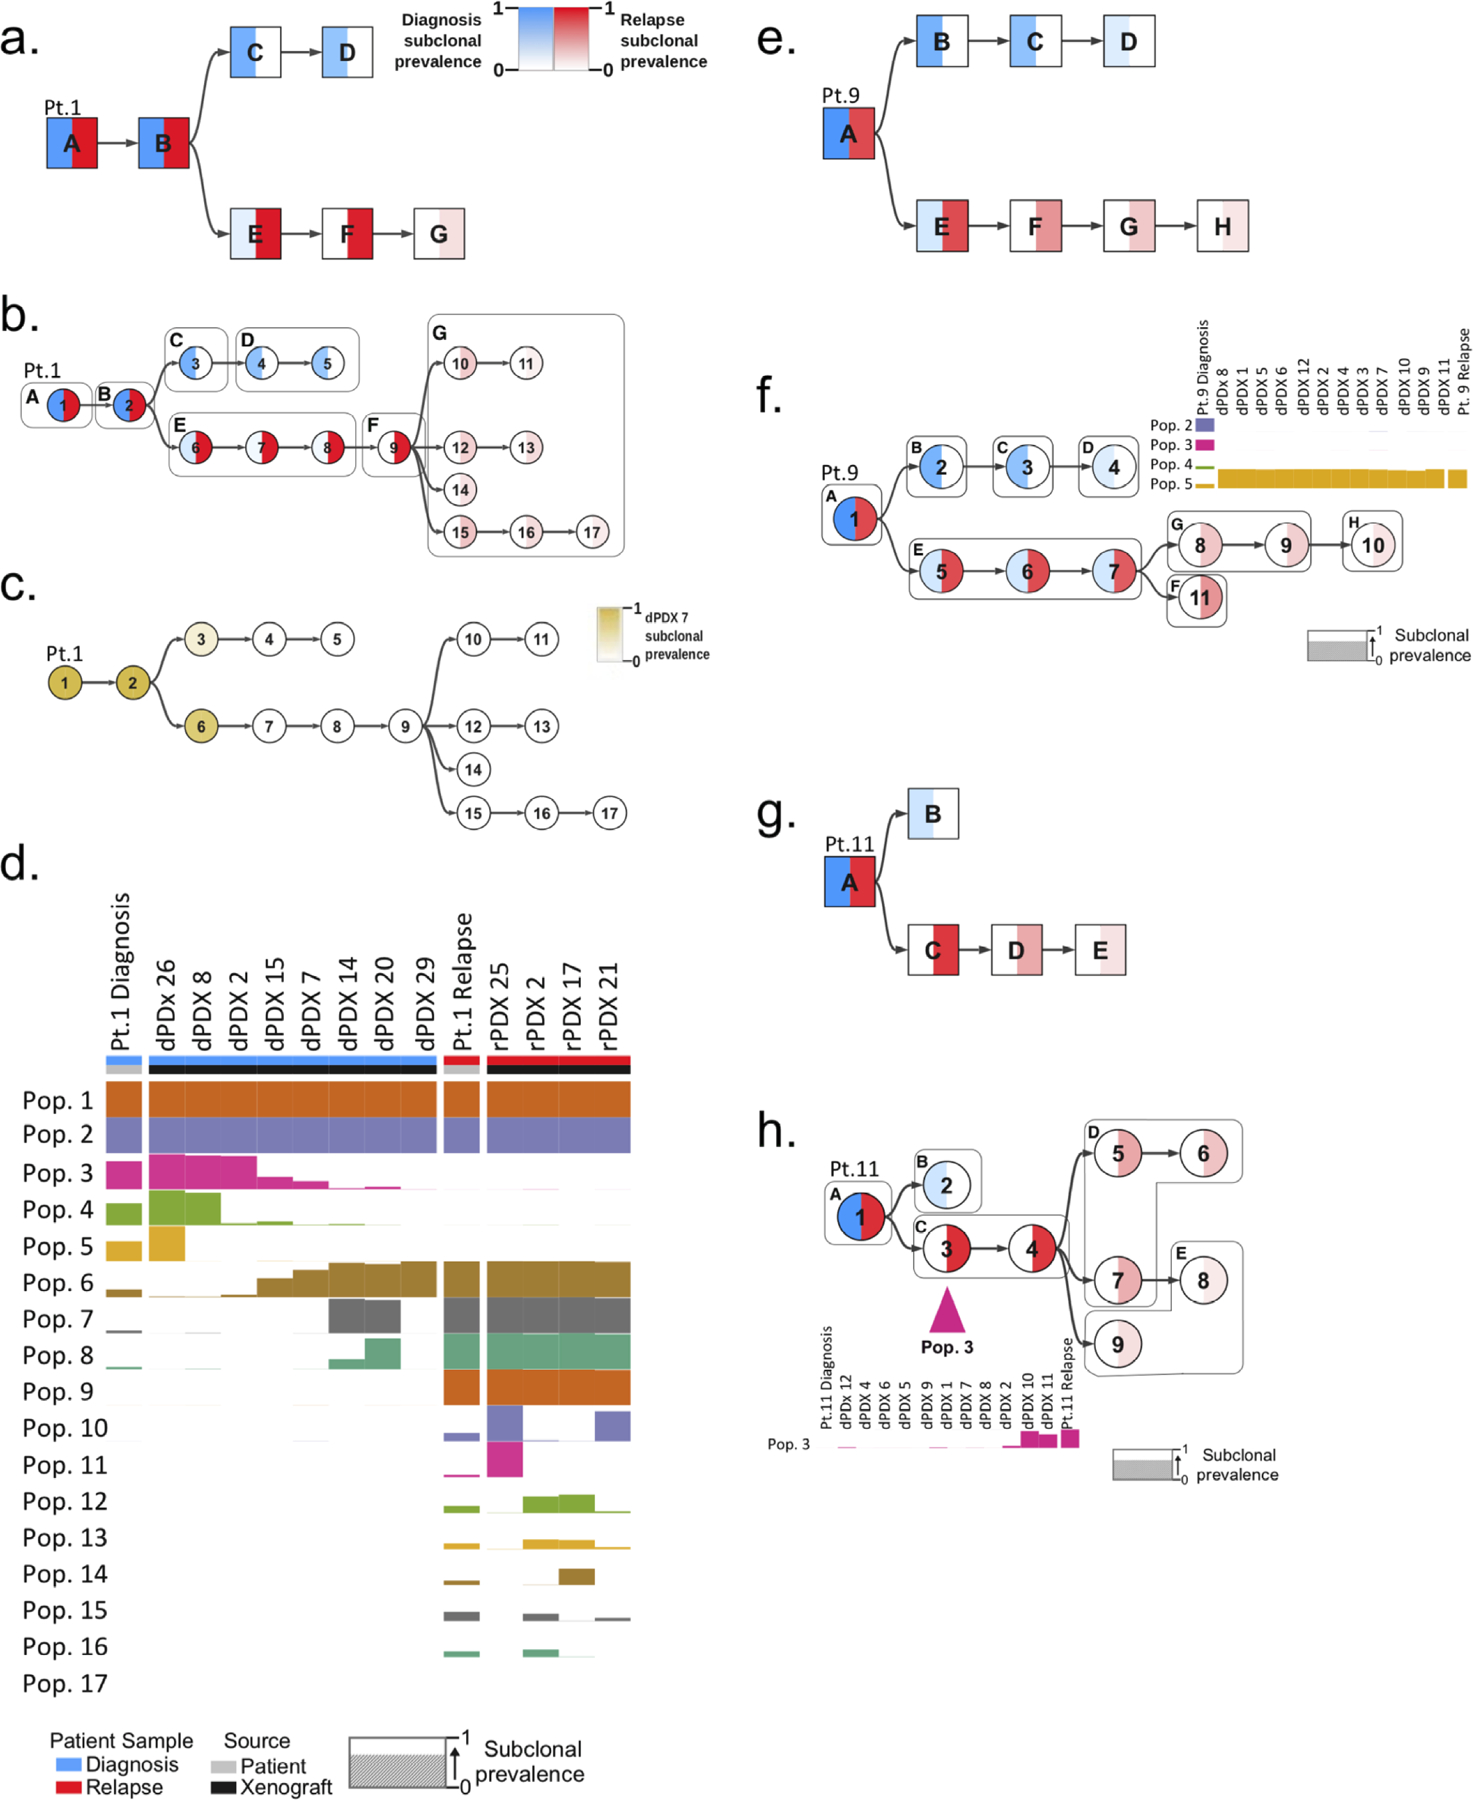
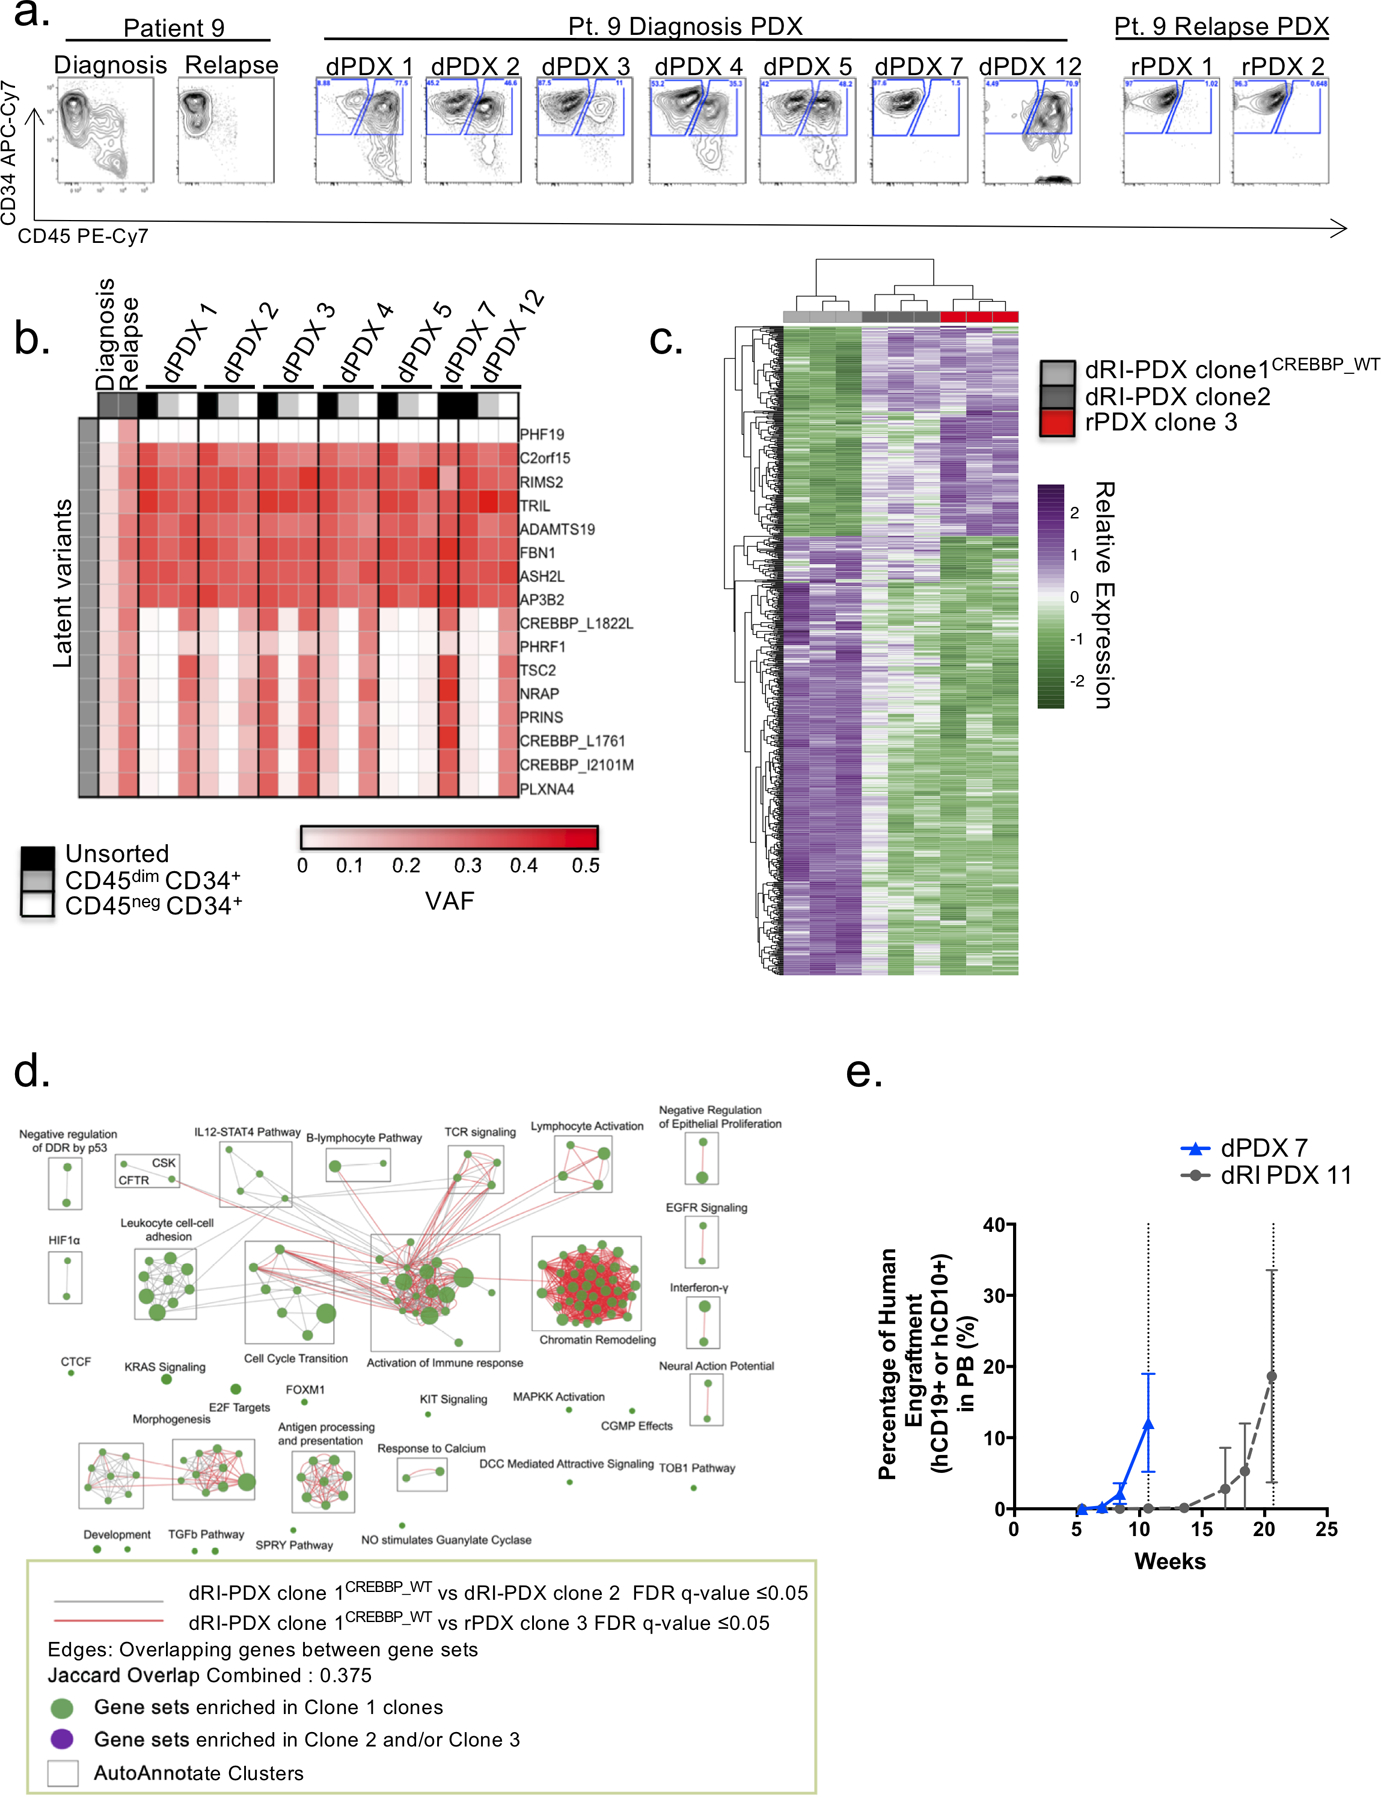
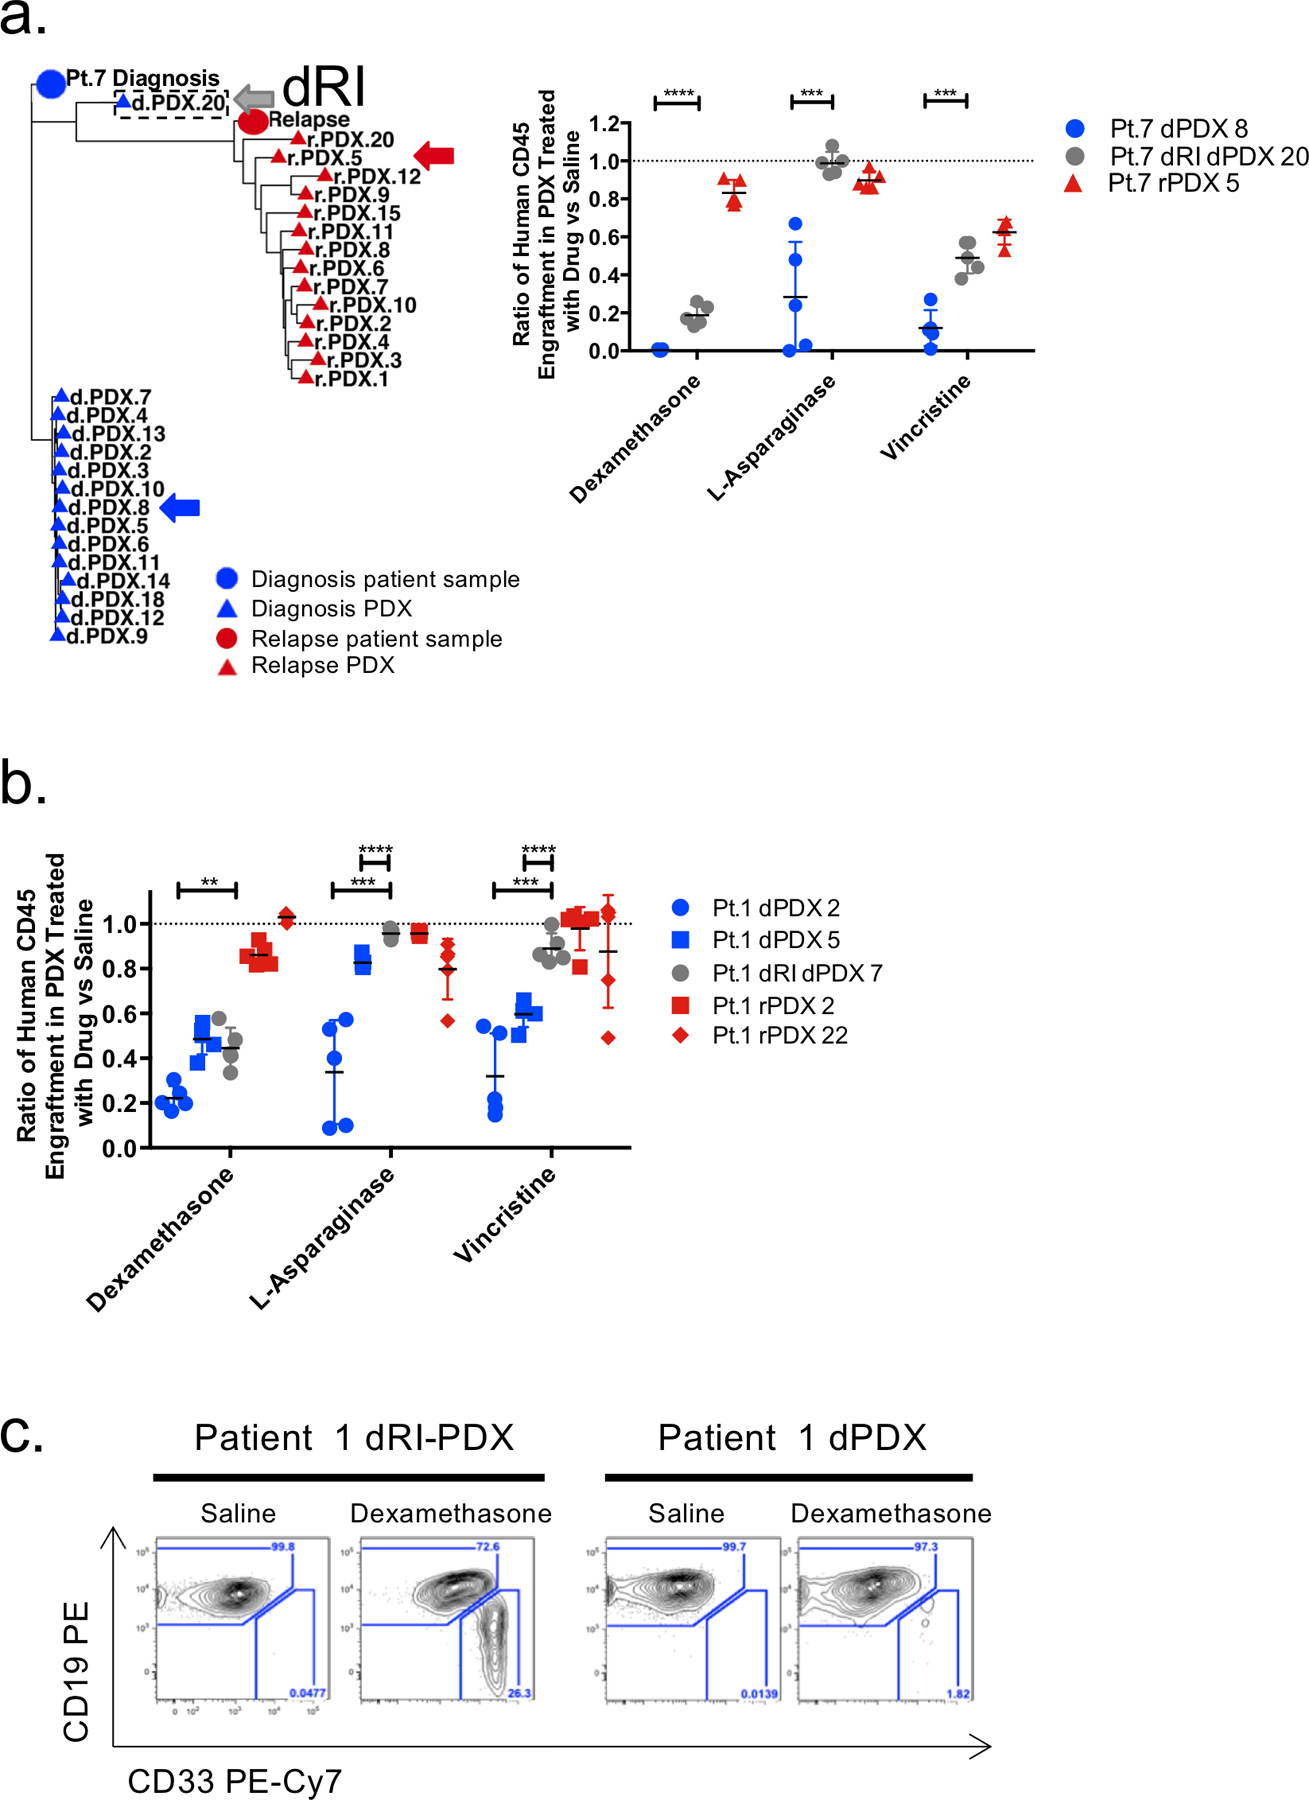
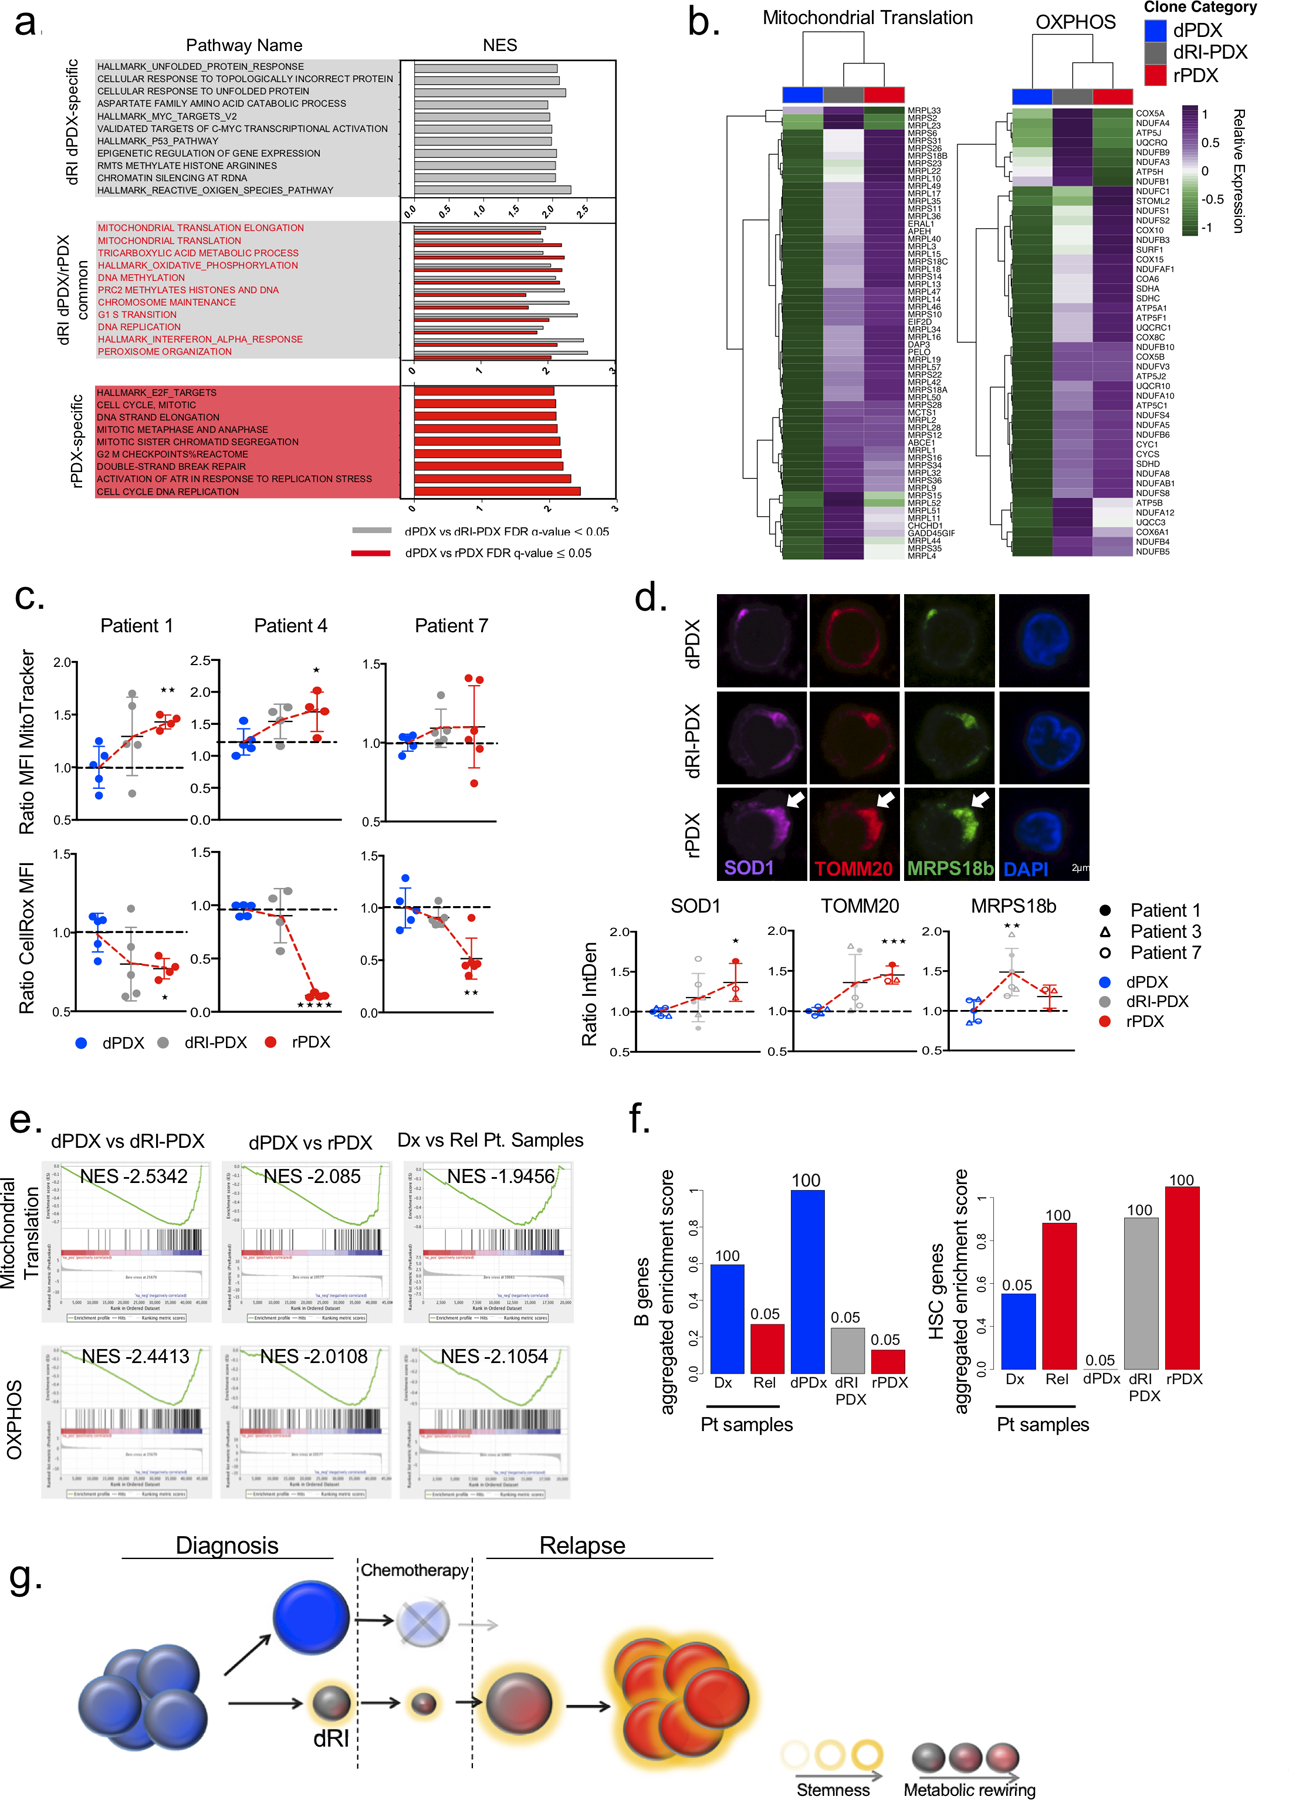
Disease recurrence causes significant mortality in B-progenitor acute lymphoblastic leukemia (B-ALL). Genomic analysis of matched diagnosis and relapse samples shows relapse often arising from minor diagnosis subclones. However, why therapy eradicates some subclones while others survive and progress to relapse remains obscure. Elucidation of mechanisms underlying these differing fates requires functional analysis of isolated subclones. Here, large-scale limiting dilution xenografting of diagnosis and relapse samples, combined with targeted sequencing, identified and isolated minor diagnosis subclones that initiate an evolutionary trajectory toward relapse [termed diagnosis Relapse Initiating clones (dRI)]. Compared with other diagnosis subclones, dRIs were drug-tolerant with distinct engraftment and metabolic properties. Transcriptionally, dRIs displayed enrichment for chromatin remodeling, mitochondrial metabolism, proteostasis programs, and an increase in stemness pathways. The isolation and characterization of dRI subclones reveals new avenues for eradicating dRI cells by targeting their distinct metabolic and transcriptional pathways before further evolution renders them fully therapy-resistant. SIGNIFICANCE: Isolation and characterization of subclones from diagnosis samples of patients with B-ALL who relapsed showed that relapse-fated subclones had increased drug tolerance and distinct metabolic and survival transcriptional programs compared with other diagnosis subclones. This study provides strategies to identify and target clinically relevant subclones before further evolution toward relapse.


Conflict of interest statement

Conflict of Interest:

J.E.D. Celgene: research funding; Trillium Therapeutics: Advisory Board funding; Abbvie: research funding

C.G.M. Illumina: Advisory board, honorarium, sponsored travel; Pfizer: research

Figures

Figure 1:
Figure 1:. PDXs capture clonal diversity present in paired diagnosis and relapse B-ALL samples
a. Experimental schematic. PDXs were generated for 6 adult and 8 pediatric B-ALL patient samples at diagnosis and relapse by intrafemoral transplantation of sorted leukemic blasts into 30 irradiated NSG mice in a limiting dilution assay. Mice were sacrificed 20–30 weeks post transplant and their engraftment was assessed by flow cytometry. Patient samples were also subjected to genomic analysis including whole exome sequencing (WES). Variants identified from the WES of patient samples at either time point were used to create custom capture baits for targeted sequencing at a deeper depth in the patient samples and their corresponding PDX. PDXs representing varying clones were identified. b. Schematic representation of the results obtanined by mutational clustering of variants based on the variant allele frequencies (VAF) at diagnosis (x-axis) and relapse (y-axis) of patient 1 in 2D VAF plots showing evolution from a minor subclone as depicted. Each dot represents a variant. Shared variants are shown in grey clusters (clusters a and c). Diagnosis and relapse specific variants are shown in the blue cluster (cluster b) and red clusters (clusters d and e) respectively. c. Heatmap of the variant allele frequencies of leukemic variants at diagnosis, relapse and in their corresponding PDXs for patient 1. Variant classes are labeled with their class and a letter corresponding to the clusters illustrated in b.
Figure 2:
Figure 2:. PDXs enrich for latent diagnosis clones
a. and b. Heatmaps of VAF of the SNV and indel leukemic variants identified by whole exome and targeted sequencing in diagnosis/relapse patient samples and PDX respectively. Variants are clustered as preserved (present in diagnosis and relapse patient samples), diagnosis specific (present in diagnosis patient sample and absent in relapse patient sample), latent (present in diagnosis patient sample with VAF < 0.3 and expanding in relapse sample), and relapse specific (present in relapse patient sample and absent in diagnosis patient sample). PDX are ordered in decreasing numbers of transplanted cell doses. a. Representative heatmap for the selection of latent variants in diagnosis PDX as observed in patient 9. b. Representative heatmap of patient 11 describing the identification of a relapse specific variant undetectable in the patient diagnosis sample but present in diagnosis PDX.
Figure 3:
Figure 3:. PDXs identify relapse-fated clones in diagnosis patient samples
a. and b. Phylogenetic analysis showing relationship of patient 9 (a) and patient 11 (b) patient samples and xenografts, based on VAF of leukemic variants. The distance between symbols on the tree were estimated by a nearest neighbour joining method and represent the degrees of relation between them (Minkowski’s distance). Circles represent patient samples and triangles represent PDX; blue represents diagnosis and red represents relapse. Diagnosis clones on the trajectory to relapse were termed diagnosis relapse initiating clones or dRI and are indicated by a box with a hatched border.
Figure 4:
Figure 4:. Generation of mutational trees from the combined genomic data of xenografts and bulk diagnosis and relapse patient samples
Mutational trees of variants clustered to form populations using the PairTree algorithm. Nodes in mutational trees are divided in half, with the intensity of blue in the left half indicating the frequency of the population’s variants at diagnosis, and the intensity of red in the right half showing the frequency of the population’s variants at relapse. Colour intensity shows subclonal prevalence as noted in the legend of a. and applicable to all other trees except c. a. Mutational tree of patient 1 derived by analysis of the patient samples (diagnosis and relapse) alone. Mutational populations identified from bulk patient samples alone are denoted by a square node labeled with with an alphabetical letter. b. Combined mutational tree derived from the variant analysis of both patient 1 patient samples and all their generated xenografts. Mutational populations derived from combined patient and xenograft analysis are represented by cicrcular nodes labeled with numerals. The mutational populations identified using the patient samples alone in a., are overlaid on the tree as boxes labeled with their corresponding alphabetical letter. This identifies instances where single populations in a correspond to multiple populations when xenografts are included (ie. mutational population G). c. Combined mutational tree of patient 1 shaded to indicate the prevalence of variants in dPDX 7 (instead of diagnosis and relapse) demonstrating that this PDX is composed primarily of variants of the relapse lineage. d. Presence of identified mutational populations in patient samples and representative xenografts. Mutational populations (Pop.) are displayed on the y-axis and individual patient samples or xenografts are displayed on the x-axis. The height of the population bar represents the prevalence of the lineage in the patient sample (Pt.) or xenograft. e. Mutational tree, similar to a, derived from patient samples alone of patient 9. f. Combined mutational tree, similar to b, derived jointly from patient 9 patient samples and xenografts. Subclonal prevalences of populations 2–5 are shown, indicating the absence of diagnosis populations 2–4 and presence of population 5 (the first node in the relapse lineage branch) in all dPDX. g. Mutational tree, similar to a, of patient 11 derived from patient samples alone. h. Combined mutational tree, similar to b, of patient 11 derived from patient samples and xenografts. The prevalence of mutational population 3 is displayed, highlighting its absence in the diagnosis patient and its detection in only two dPDX.
Figure 5:
Figure 5:. Competitive dRI-PDX clones identified in diagnosis PDX
a.Flow cytometry analysis of patient samples and representative dPDX and rPDX of patient 9 display the presence of two different immunophenotypic populations: a CD45dimCD34+ and a CD45negCD34+. b.Targeted sequencing of the dPDX revealed variability in the VAF of latent variants that corresponded with the shift in immunophenotypic populations. Cell sorting for immunophenotypic populations followed by targeted sequencing revealed the isolation of the latent variants in the CD45negCD34+ population. c. RNA-sequencing analysis of differentially expressed genes (adjusted p-value of < 0.05 and absolute log2 fold change of > 1) between the two dPDX (dRI-PDX clone 2; dRI-PDX clone 1CREBBP_WT) vs rPDX for Patient 9. Relative expression was generated from variance stabilized normalized counts. d. Enrichment map of gene sets differentially enriched in patient 9 dRI-PDX clone 1CREBBP_WT vs dRI-PDX clone 2 (FDR q value ≤ 0.05) and dRI-PDX clone 1CREBBP_WT vs rPDX clone 3 (FDR q value ≤ 0.05). Node size is proportional to the number of genes included in each gene set (minimum 10 genes/gene set). Grey and Red edges indicate gene overlap. Green node: enrichment in dRI-PDX clone 1CREBBP_WT (positive NES). Purple node: enrichment in dRI-PDX clone 2 and/or rPDX clone 3 (negative NES). Autoannotate app in Cytoscape was used to automatically annotate clusters (black squares). NES: normalized enrichment score; DDR: DNA Damage Response; TCR: T-Cell Receptor; UPR: Unfolded Protein Response; cGMP: cyclic Guanosine Monophosphate; DCC: Deleted in Colorectal Cancer gene; NO: Nitric Oxide; CSK: C-terminal Src Kinase; CFTR: Cystic Fibrosis Transmembrane Conductance Regulator; SPRY: Sprouty gene. e. Human purified cells from primary dPDX and dRI-PDX from patient 4 were transplanted into secondary NSG recipients. Mice were monitored for peripheral blood human chimerism until mean blood levels reached greater than 10% revealing different kinetics of chimerism between dPDX 7 and dRI-PDX 11. Symbols represent the mean chimerism value of dPDX 7 (n= 20 mice) and dRI-PDX 11 (n= 16 mice) and bars represent standard deviation.
Figure 6:
Figure 6:. dRI subclones display decreased sensitivity to commonly used chemotherapeutic drugs
a. Phylogenetic analysis showing clonal relationships in patient 7 based on VAF of leukemic variants shows clear evidence of the isolation of a relapse-fated, dRI, clone in dPDX 20. The distance between symbols on the tree were estimated by a nearest neighbour joining method and represent the degrees of relation between them (Minkowski’s distance). Circles represent patient samples and triangles represent PDX; blue represents diagnosis and red represents relapse. dRI-PDX 20 is indicated by a hatched border box. Purified human cells from primary dPDX 7, dRI-PDX 20 and rPDX 5 (representative relapse genetics) xenografts were injected into secondary NSG mice and allowed to engraft. Mice were randomized into 4 groups (with 4–5 mice per group) and treated with either saline, dexamethasone, L-asparagine or vincristine. After 4 weeks of treatment mice were sacrificed and engraftment in the IF, BM and SPL were analyzed by flow cytometry. Ratio of human chimerism in the BM of drug treated mice in comparison to saline controls is shown. b..Ratio of human chimerism in the BM of drug treated mice in comparison to saline controls of dPDX, dRI-PDX and rPDX of patient 1. c. Representative flow plots of the CD19 and CD33 immunophenotype of dPDX and dRI-PDX dexamethasone treated mice from patient 1. Lines represent mean and standard deviation. Only significance between dPDX and dRI-PDX are shown. **p < 0.01, *** p < 0.001, **** p < 0.0001, unpaired two-sided t-tests.
Figure 7:
Figure 7:. dRI subclones share a common metabolic and stem cell profile
a. Plot showing the normalized enrichment score (NES) for the top differentially enriched gene sets (FDR q value ≤ 0.05) of dRI-PDX unique, dRI-PDX/rPDX common and rPDX unique groups from GSEA analysis of the following comparisons: dPDX vs dRI-PDX and dPDX vs rPDX. b. Heatmaps showing the expression of leading-edge genes (subset of genes found in the ranking at or just before the maximal enrichment score in GSEA analysis) for selected gene sets enriched in dRI-PDX and rPDX from enrichment map in (a). Relative expression was generated from variance stabilized normalized counts c. dPDX, dRI-PDX and rPDX from Patient 1, Patient 4 and Patient 7 were stained with MitoTracker and CellROX dyes and analyzed by flow cytometry. Mean fluorescence intensity (MFI) for each sample and dye is represented as ratio to dPDX for each patient (Patient 1: dPDX n=5, dRI-PDX n=5, rPDX=4; ; Patient 4: dPDX n=5, dRI-PDX n=4, rPDX=4; Patient 7: dPDX n=5, dRI-PDX n=5, rPDX=5). d. Immunostaining analysis for TOMM20, MRPS18B and SOD1 in dPDX, dRI-PDX and rPDX cells from Patient 1, 3 and 7. The Integrated Density (IntDen= Area* Mean Fluorescence Intensity) for 40–50 cells from each clone was analyzed using Fiji. The mean for each clone was normalized and calculated as a ratio to the dPDX for each patient separately. Representative images for Patient 7 are shown. (Patient 1: dPDX n=1, dRI-PDX n=2, rPDX=1; Patient 7: dPDX n=2, dRI-PDX n=2, rPDX=1; Patient 3: dPDX n=2, dRI-PDX n=2, rPDX=1). e. GSEA enrichment plots from the following comparisons (1) dPDX vs dRI-PDX (n=4 pts), (2) dPDX vs rPDX (n=4 pts) and (3) diagnosis vs relapse patient samples from our cohort, were generated for mitochondrial translation and OXPHOS gene sets. f. Barplot of the aggregated GSVA scores for B cell genes and HSC genes in each sample. GSVA scores for samples in each category were summed and scaled from 0 to 1. The numbers above the bars represent how many times the observed score was higher than random scores obtained in 1000 permutations using a list of 1000 random genes. g. Schematic diagram of dRI with altered metabolic and stem cell programs pre-exisiting in diagnosis patient samples that survive chemotherapy and seed the relapse disease. *p<0.05, **p < 0.01, ***p<0.001, unpaired two-sided t-test.

References

    1. Forman SJ, Rowe JM. The myth of the second remission of acute leukemia in the adult. Blood 2013;121(7):1077–82 doi 10.1182/blood-2012-08-234492. - DOI - PMC - PubMed
    1. Liew E, Atenafu EG, Schimmer AD, Yee KW, Schuh AC, Minden MD, et al. Outcomes of adult patients with relapsed acute lymphoblastic leukemia following frontline treatment with a pediatric regimen. Leuk Res 2012;36(12):1517–20 doi 10.1016/j.leukres.2012.08.019. - DOI - PubMed
    1. Hunger SP, Mullighan CG. Acute Lymphoblastic Leukemia in Children. N Engl J Med 2015;373(16):1541–52 doi 10.1056/NEJMra1400972. - DOI - PubMed
    1. Mullighan CG, Phillips LA, Su X, Ma J, Miller CB, Shurtleff SA, et al. Genomic analysis of the clonal origins of relapsed acute lymphoblastic leukemia. Science 2008;322(5906):1377–80 doi 10.1126/science.1164266. - DOI - PMC - PubMed
    1. Ma X, Edmonson M, Yergeau D, Muzny DM, Hampton OA, Rusch M, et al. Rise and fall of subclones from diagnosis to relapse in pediatric B-acute lymphoblastic leukaemia. Nat Commun 2015;6:6604 doi 10.1038/ncomms7604. - DOI - PMC - PubMed

Publication types