. 2020 Feb 21;5(44):eaay6017.
doi: 10.1126/sciimmunol.aay6017.

Defining the emergence of myeloid-derived suppressor cells in breast cancer using single-cell transcriptomics

Affiliations

Defining the emergence of myeloid-derived suppressor cells in breast cancer using single-cell transcriptomics

Hamad Alshetaiwi et al. Sci Immunol. .

Abstract

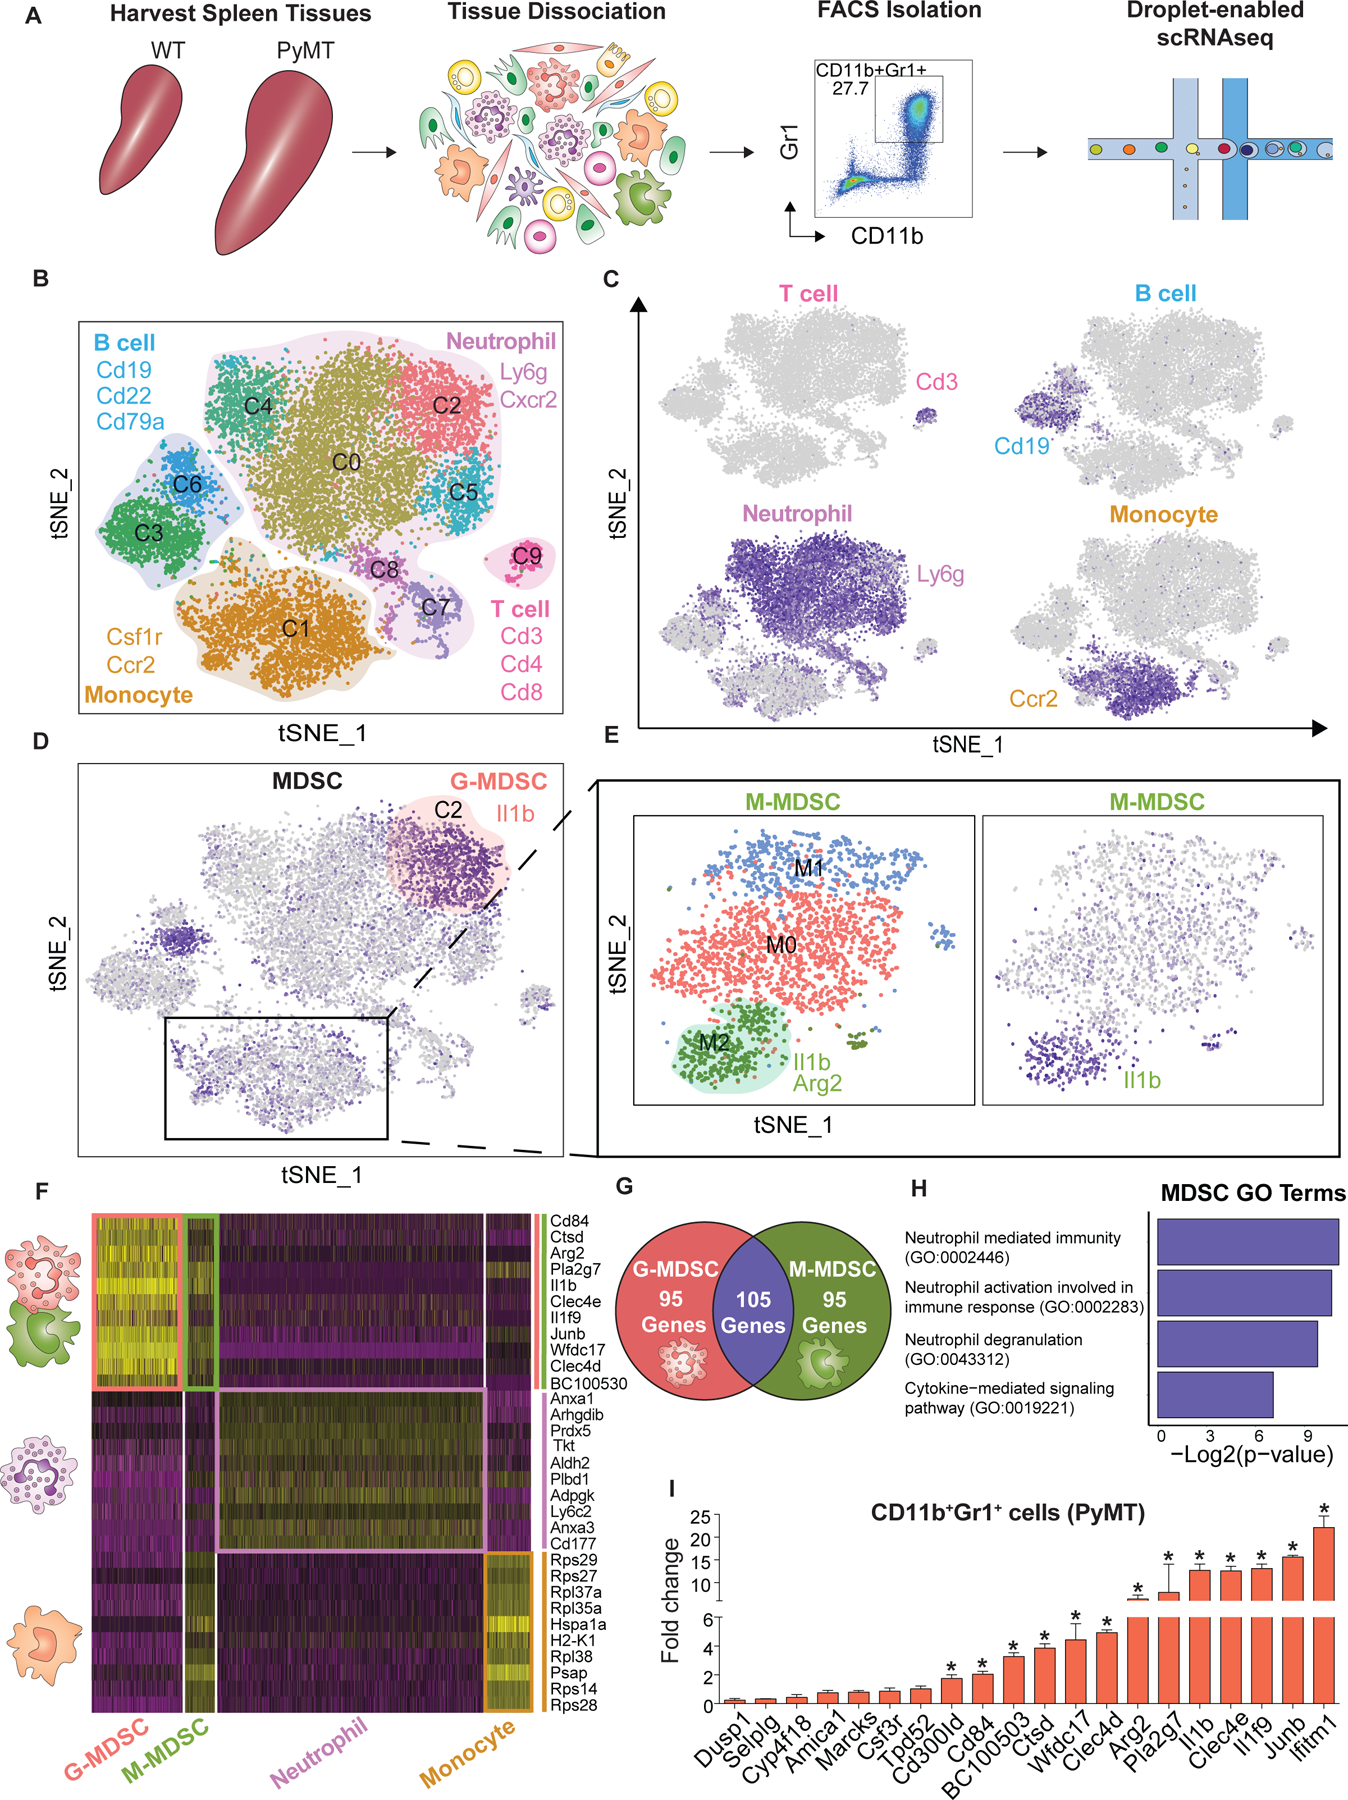
Myeloid-derived suppressor cells (MDSCs) are innate immune cells that acquire the capacity to suppress adaptive immune responses during cancer. It remains elusive how MDSCs differ from their normal myeloid counterparts, which limits our ability to specifically detect and therapeutically target MDSCs during cancer. Here, we sought to determine the molecular features of breast cancer-associated MDSCs using the widely studied mouse model based on the mouse mammary tumor virus (MMTV) promoter-driven expression of the polyomavirus middle T oncoprotein (MMTV-PyMT). To identify MDSCs in an unbiased manner, we used single-cell RNA sequencing to compare MDSC-containing splenic myeloid cells from breast tumor-bearing mice with wild-type controls. Our computational analysis of 14,646 single-cell transcriptomes revealed that MDSCs emerge through an aberrant neutrophil maturation trajectory in the spleen that confers them an immunosuppressive cell state. We establish the MDSC-specific gene signature and identify CD84 as a surface marker for improved detection and enrichment of MDSCs in breast cancers.


Conflict of interest statement

Competing interests: The authors declare no competing financial or non-financial interests.

Figures

Fig. 1.
Fig. 1.. Identifying MDSC-specific gene expression signatures using scRNAseq.
(A) Approach overview for single-cell analysis of and (sytox blue-negative) CD45+CD11b+Gr1+ cells were sorted from the spleen of control WT and tumor-bearing PyMT’s mice by FACS following droplet-enabled scRNAseq. (B-C) Combined Seurat analysis of in total 14,646 cells from control and PyMT mice shown in tSNE projection results in various distinct clusters of splenic CD11b+Gr1+ cells. Main cell types (T cells, B cells, neutrophils, monocytes) are outlined based on hallmark gene expression. (C) Feature plots of characteristic markers of the four main cell types showing expression levels with low expression in grey to high expression in dark blue. (D) G-MDSCs were identified in cluster C1 by expression marker genes (Arg2 & Il1β) from the PyMT sample. (E) Subset analysis of monocytes cluster identified M-MDSCs. Three clusters were found; cluster M2 was identified as M-MDSCs (positive for Arg2 & Il1β). (F) Heatmap displaying the scaled expression patterns of top marker genes within each G-MDSCs and M-MDSCs clusters compared to normal neutrophil and monocyte clusters from WT mice, respectively; yellow = high expression; purple = low expression. (G) Venn diagram showing the number of statistically significant marker genes and overlap between G-MDSC and M-MDSC. (H) Gene ontology (GO) term analysis using Enrichr of curated MDSC signature. (I) Validation using qPCR of selected upregulated MDSC genes, statistical analysis unpaired t-test (Mean ± SEM of n = 3) *P< 0.05.
Fig. 2.
Fig. 2.. Comparative analysis using MDSC signature in myeloid cells from human breast cancer patients.
(A) Seurat analysis of previously published scRNAseq dataset comprising various immune cell populations in primary human breast tumor samples projected in UMAP with cell type labels as indicated in different colors. (B) Violin plot showing relative MDSC score of all cells in this dataset ordered by cell type showing highest scores in neutrophils and monocytes. (C) Separate unbiased Seurat clustering analysis of neutrophil alone projected in UMAP yielded four distinct clusters of neutrophils in this dataset. (D) Heatmap showing top 10 marker genes for each neutrophil cluster. (E) Violin plots showing relative MDSC score ordered by neutrophil subcluster showing that cluster 0 exhibit highest expression of MDSC gene signature. (F) Subset monocyte-specific Seurat clustering analysis projected in UMAP yielded three distinct clusters of monocytes in this dataset. (G) Heatmap showing top 10 marker genes for each monocyte cluster. (H) Violin plots showing relative MDSC score ordered by monocytes subclusters.
Fig. 3.
Fig. 3.. Identification of cell surface markers for MDSCs in breast cancer models.
(A) CD84 expression profiling in WT and tumor-bearing PyMT showing that only spleen and primary tumor from PyMT exhibit significant expression. (B) Combined results and statistical analysis using unpaired t-test (Mean ± SEM of n = 10) *P< 0.05. (D) Profiling Jaml expression in WT and PyMT showing only spleen and tumor from PyMT exhibit significant expression. (E) Combined results and statistical analysis unpaired t-test (Mean ± SEM of n = 3 *P< 0.05. (C&F) Concatenate multiple flow samples to visualize CD84 and Jaml1 expression in one feature plot across all samples including; (FMO, Bone marrow, lung, spleen, MFP and tumor from WT and PyMT); significant expression was only observed in spleen and tumor from PyMT. (G) Overview of PBMC collection, culture condition, and FACS approach. (H) Concatenate multiple flow samples to visualize CD84 expression in G- and M-MDSCs in one feature plot across all samples including PBMC control and treated. (I-J) Statistical analysis using unpaired t-test (Mean ± SEM of n = 3) *P< 0.05
Fig. 4.
Fig. 4.. CD11b+Gr1+CD84hi cells exhibit potent capacity for T cell suppression and increased ROS production.
(A) Overview of FACS approach using two different tissues (spleen and primary tumor) from WT and PyMT were subjected to T cell activation, ROS formation and qPCR assays. (B-C) Splenic CD11b+Gr1+CD84hi cells from tumor-bearing mice suppress T cell proliferation. Histogram overly (B) and quantitative bar charts (C) showing CD4/CD8 T cell proliferation measured by FACS in control samples with T cells only (black), T cells activated by CD3/CD28 (blue), activated T cells plus CD11b+Gr1+ cells from control spleens (orange), activated T cells plus CD11b+Gr1+CD84−/lo cells (purple) and activated T cells plus CD11b+Gr1+CD84hi (red) from spleen of tumor-bearing mice. (C) Statistical analysis unpaired t-test (Mean ± SEM of n = 3) *P< 0.05. (D-E) T cell suppression analysis using CD11b+Gr1+CD84hi and CD84−/lo cells isolated from primary tumors. Histogram overly (D) and quantitative bar charts (E) showing CD4/CD8 T cell proliferation measured by FACS in control samples T cells (black), T cells activated by CD3/CD28 (blue), activated T cells plus CD11b+Gr1+CD84−/lo cells (purple) and activated T cells plus CD11b+Gr1+CD84hi (red) from tumor of tumor-bearing mice. (E) Statistical analysis unpaired t-test (Mean ± SEM of n = 3) *P< 0.05. (F-G) CD11b+Gr1+CD84hi cells from tumor-bearing mice show increased ROS formation compared to CD11b+Gr1+CD84−/lo; PMA-treated cells were used as positive control. ROS was measured by FACS using H2DCFDA. (E) Statistical analysis of ROS assay unpaired t-test (Mean ± SEM of n = 3) *P< 0.05.
Fig. 5.
Fig. 5.. G-MDSCs emerge through aberrant differentiation trajectory during cancer.
(A) Neutrophil-specific Monocle analysis on subset of Ly6g+ neutrophil clusters resulted in branched trajectory with 5 distinct Monocle states (color code for each state is indicated) which are named based on respective gene expression profile. (B) Pseudotime plot illustrating expression of selected marker genes over pseudotime with the branch ending in State 1 shown with the dotted line, and the branch ending with state 3 highlighted by the solid line. Neutrophil progenitors are characterized by high levels of Elane, Mpo and Prtn3 (state 4), which bifurcate into mature neutrophils (state 3; Camp, Ltf, Lcn2) on the one branch, and MDSCs (state 1; e.g. CD84) on the other branch. (C) Early G-MDSC transition was marked by high expression of Asprv1, Plscr1 and Pirb. (D) Summary schematic indicates that G-MDSCs emerge from neutrophil progenitor cells via an aberrant form of neutrophil differentiation rather than from mature neutrophils that are reprogrammed into immunosuppressive cells.
Fig. 6.
Fig. 6.. Proposed model of aberrant neutrophil differentiation in the spleen during cancer.
Myeloid cells differentiate in bone marrow from hematopoietic stem cells through common myeloid progenitors. Common granulocyte/monocyte progenitors expand in the bone marrow and migrate to spleen as a marginated pool, where they give rise to normal neutrophil maturation and, in cancer, aberrant neutrophil differentiation into G-MDSCs. Our findings that indicate MDSC-specific gene signature that is largely shared between G- and M-MDSCs but differs from their normal myeloid counterparts. This MDSC signature includes numerous chemokine receptors, which likely guide their migration towards primary tumor or metastatic sites (indicated by arrows), where they may shield tumor cells from anti-tumor immunity.

References

    1. Society, A. C. Cancer Facts & Figures 2018. Am. Cancer Soc (2018). doi:10.1182/blood-2015-12-687814 - DOI
    1. Casbon A-J et al. Invasive breast cancer reprograms early myeloid differentiation in the bone marrow to generate immunosuppressive neutrophils. Proc. Natl. Acad. Sci 112, E566–E575 (2015). - PMC - PubMed
    1. Gabrilovich DI, Ostrand-Rosenberg S & Bronte V Coordinated regulation of myeloid cells by tumours. Nat. Rev. Immunol 12, 253–268 (2012). - PMC - PubMed
    1. Gabrilovich DI & Nagaraj S Myeloid-derived suppressor cells as regulators of the immune system. Nat. Rev. Immunol 9, 162–174 (2009). - PMC - PubMed
    1. Diaz-Montero CM et al. Increased circulating myeloid-derived suppressor cells correlate with clinical cancer stage, metastatic tumor burden, and doxorubicin-cyclophosphamide chemotherapy. Cancer Immunol. Immunother 58, 49–59 (2009). - PMC - PubMed

Publication types

MeSH terms