

Hepatocellular adenomas: is there additional value in using Gd-EOB-enhanced MRI for subtype differentiation?
- PMID: 32086574
- PMCID: PMC8645538
- DOI: 10.1007/s00330-020-06726-8
Hepatocellular adenomas: is there additional value in using Gd-EOB-enhanced MRI for subtype differentiation?
Erratum in
-
Correction to: Hepatocellular adenomas: is there additional value in using Gd-EOB-enhanced MRI for subtype differentiation?Eur Radiol. 2022 May;32(5):3609. doi: 10.1007/s00330-021-08386-8. Eur Radiol. 2022. PMID: 34866169 Free PMC article. No abstract available.
Abstract
Purpose: To differentiate subtypes of hepatocellular adenoma (HCA) based on enhancement characteristics in gadoxetic acid (Gd-EOB) magnetic resonance imaging (MRI).
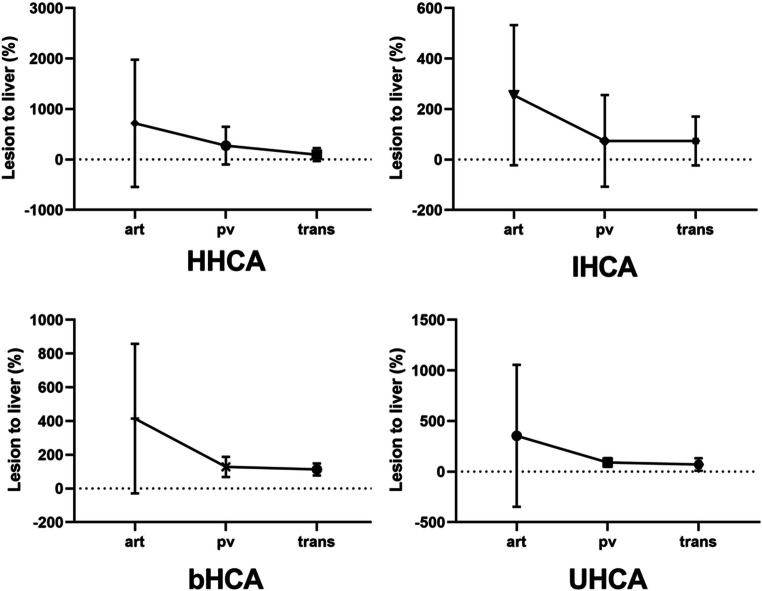
Materials and methods: Forty-eight patients with 79 histopathologically proven HCAs who underwent Gd-EOB-enhanced MRI were enrolled (standard of reference: surgical resection). Two blinded radiologists performed quantitative measurements (lesion-to-liver enhancement) and evaluated qualitative imaging features. Inter-reader variability was tested. Advanced texture analysis was used to evaluate lesion heterogeneity three-dimensionally.
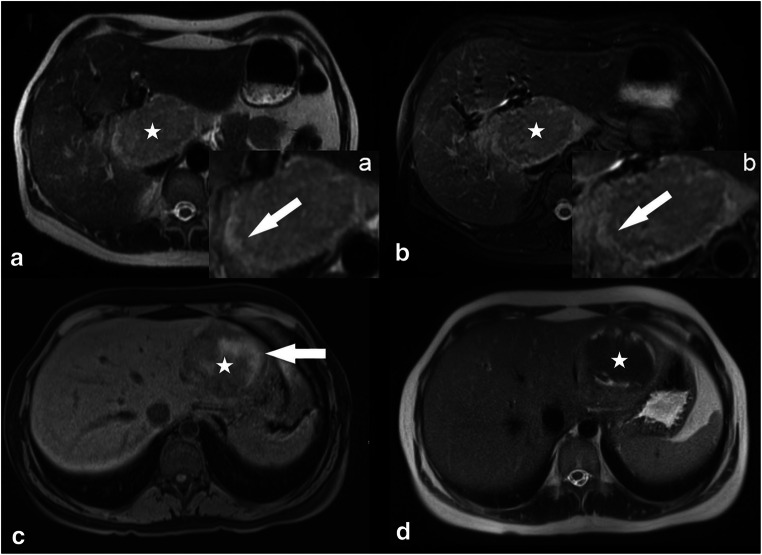
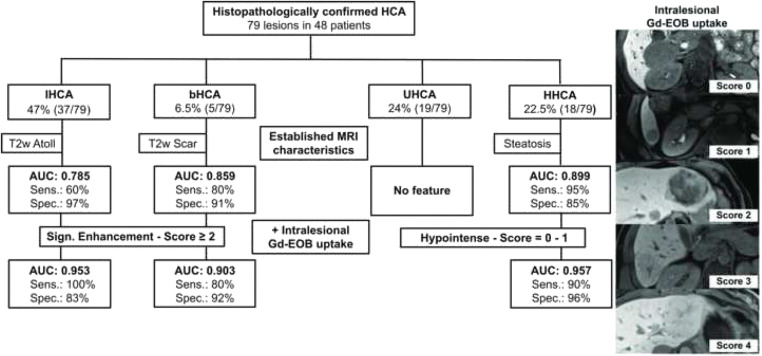
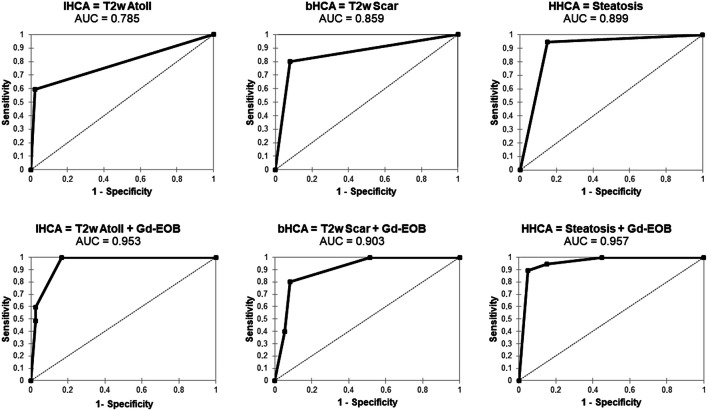
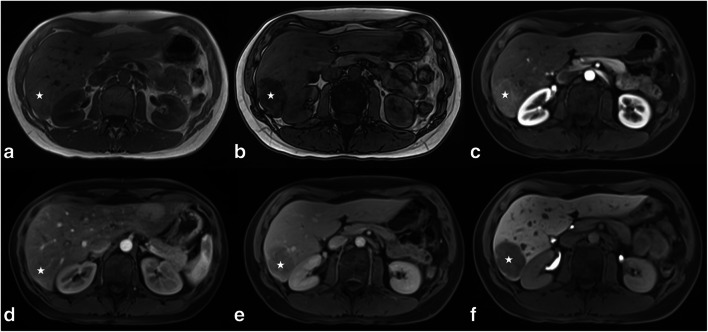
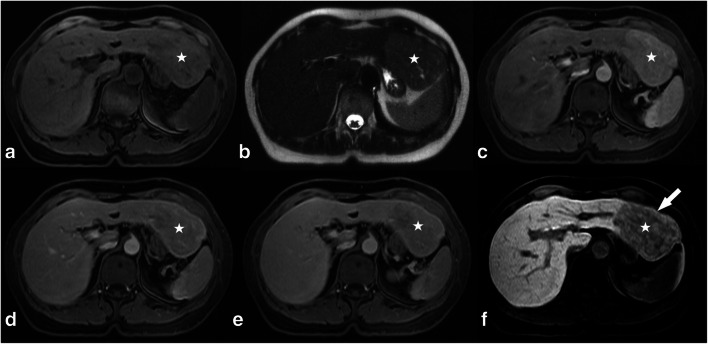
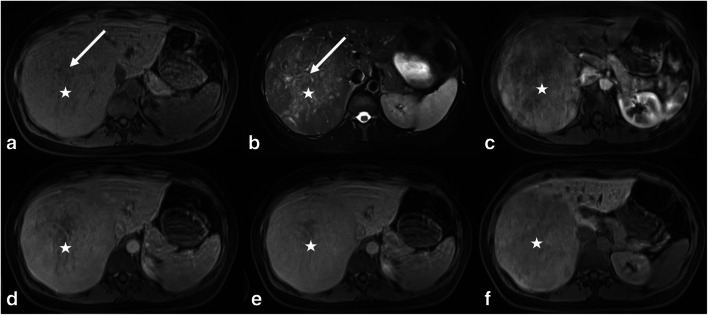
Results: Overall, there were 19 (24%) hepatocyte nuclear factor (HNF)-1a-mutated (HHCAs), 37 (47%) inflammatory (IHCAs), 5 (6.5%) b-catenin-activated (bHCA), and 18 (22.5%) unclassified (UHCAs) adenomas. In the hepatobiliary phase (HBP), 49.5% (39/79) of all adenomas were rated as hypointense and 50.5% (40/79) as significantly enhancing (defined as > 25% intralesional GD-EOB uptake). 82.5% (33/40) of significantly enhancing adenomas were IHCAs, while only 4% (1/40) were in the HHCA subgroup (p < 0.001). When Gd-EOB uptake behavior was considered in conjunction with established MRI features (binary regression model), the area under the curve (AUC) increased from 0.785 to 0.953 for differentiation of IHCA (atoll sign + hyperintensity), from 0.859 to 0.903 for bHCA (scar + hyperintensity), and from 0.899 to 0.957 for HHCA (steatosis + hypointensity). Three-dimensional region of interest (3D ROI) analysis showed significantly increased voxel heterogeneity for IHCAs (p = 0.038).
Conclusion: Gd-EOB MRI is of added value for subtype differentiation of HCAs and reliably identifies the typical heterogeneous HBP uptake of IHCAs. Diagnostic accuracy can be improved significantly by the combined analysis of established morphologic MR appearances and intralesional Gd-EOB uptake.
Key points: •Gd-EOB-enhanced MRI is of added value for subtype differentiation of HCA. •IHCA and HHCA can be identified reliably based on their typical Gd-EOB uptake patterns, and accuracy increases significantly when additionally taking established MR appearances into account. •The small numbers of bHCAs and UHCAs remain the source of diagnostic uncertainty.
Keywords: Gd-DTPA; Hepatic neoplasms; Hepatocellular adenoma; Liver; Magnetic resonance imaging.
Conflict of interest statement
Christian Grieser, Dominik Geisel, Daniel Seehofer, and Timm Denecke received honoraria, and travel expenses from Bayer Schering Pharma, Berlin, Germany in the past. All other authors who took part in this study declared that they do not have anything to disclose regarding funding or conflict of interest with respect to this manuscript.
Figures
Similar articles
-
HBP-enhancing hepatocellular adenomas and how to discriminate them from FNH in Gd-EOB MRI.BMC Med Imaging. 2021 Feb 15;21(1):28. doi: 10.1186/s12880-021-00552-0. BMC Med Imaging. 2021. PMID: 33588783 Free PMC article.
-
Hepatocellular Adenoma Subtypes Based on 2017 Classification System: Exploratory Study of Gadoxetate Disodium-Enhanced MRI Features With Proposal of a Diagnostic Algorithm.AJR Am J Roentgenol. 2023 Apr;220(4):539-550. doi: 10.2214/AJR.22.28233. Epub 2022 Sep 28. AJR Am J Roentgenol. 2023. PMID: 36169546
-
Iso- or hyperintensity of hepatocellular adenomas on hepatobiliary phase does not always correspond to hepatospecific contrast-agent uptake: importance for tumor subtyping.Eur Radiol. 2019 Jul;29(7):3791-3801. doi: 10.1007/s00330-019-06150-7. Epub 2019 Apr 1. Eur Radiol. 2019. PMID: 30937584
-
Beta-Catenin-Mutated Hepatocellular Adenomas at Hepatobiliary Phase MRI: A Systematic Review and Meta-Analysis.J Magn Reson Imaging. 2024 Nov;60(5):2104-2114. doi: 10.1002/jmri.29279. Epub 2024 Feb 14. J Magn Reson Imaging. 2024. PMID: 38465878
-
Paradoxical uptake of Gd-EOB-DTPA on the hepatobiliary phase in the evaluation of hepatic metastasis from breast cancer: is the "target sign" a common finding?Magn Reson Imaging. 2012 Oct;30(8):1083-90. doi: 10.1016/j.mri.2012.03.007. Epub 2012 May 11. Magn Reson Imaging. 2012. PMID: 22578929 Review.
Cited by
-
Key CT and MRI findings of drug-associated hepatobiliary and pancreatic disorders.Jpn J Radiol. 2024 Mar;42(3):235-245. doi: 10.1007/s11604-023-01505-z. Epub 2023 Nov 6. Jpn J Radiol. 2024. PMID: 37926781 Free PMC article. Review.
-
A case study of glycogen storage disease type Ia presenting with multiple hepatocellular adenomas: an analysis by gadolinium ethoxybenzyl-diethylenetriamine-pentaacetic acid magnetic resonance imaging.Quant Imaging Med Surg. 2021 Jun;11(6):2785-2791. doi: 10.21037/qims-20-746. Quant Imaging Med Surg. 2021. PMID: 34079743 Free PMC article.
-
Lesions hyper- to isointense to surrounding liver in the hepatobiliary phase of gadoxetic acid-enhanced MRI.Eur Radiol. 2024 Dec;34(12):7661-7672. doi: 10.1007/s00330-024-10829-x. Epub 2024 Jun 20. Eur Radiol. 2024. PMID: 38900280 Free PMC article.
-
Hyperintense liver lesions on hepatobiliary phase of gadoxetic acid-enhanced magnetic resonance imaging: clinical insights and significance.Abdom Radiol (NY). 2025 Aug 18. doi: 10.1007/s00261-025-05169-3. Online ahead of print. Abdom Radiol (NY). 2025. PMID: 40824538 Review.
-
Differentiation of hepatocellular adenoma by subtype and hepatocellular carcinoma in non-cirrhotic liver by fractal analysis of perfusion MRI.Insights Imaging. 2022 Apr 28;13(1):81. doi: 10.1186/s13244-022-01223-6. Insights Imaging. 2022. PMID: 35482151 Free PMC article.
References
MeSH terms
Substances
LinkOut - more resources
Full Text Sources
Medical
Miscellaneous
