. 2020 Mar:140:30-41.
doi: 10.1016/j.yjmcc.2020.02.006. Epub 2020 Feb 19.

IRF-1 mediates the suppressive effects of mTOR inhibition on arterial endothelium

Affiliations

IRF-1 mediates the suppressive effects of mTOR inhibition on arterial endothelium

Kai Peng et al. J Mol Cell Cardiol. 2020 Mar.

Abstract

Aims: Mammalian target of rapamycin (mTOR) inhibitors used in drug-eluting stents (DES) to control restenosis have been found to delay endothelialization and increase incidence of late-stent thrombosis through mechanisms not completely understood. We revealed that mTOR inhibition (mTORi) upregulated the expression of cell growth suppressor IRF-1 in primary human arterial endothelial cells (HAEC). This study aimed to examine how mTOR-regulated IRF-1 expression contributes to the suppressive effect of mTORi on arterial endothelial proliferation.

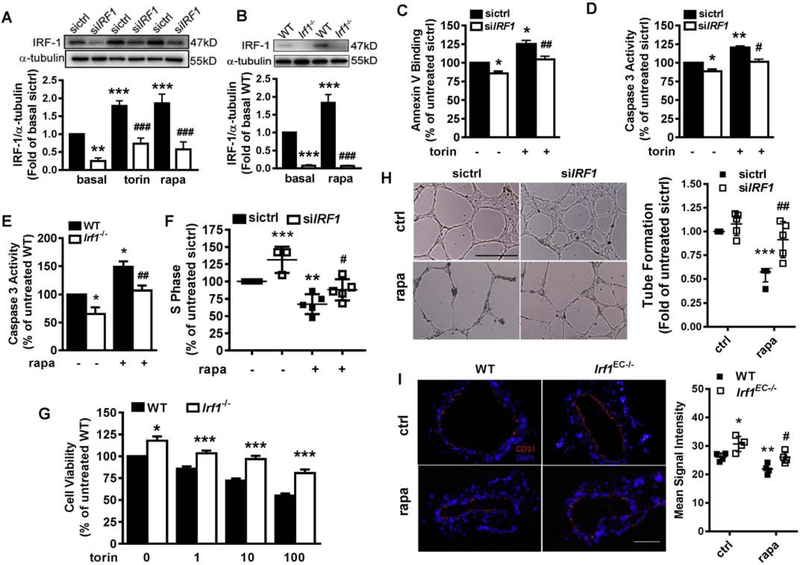
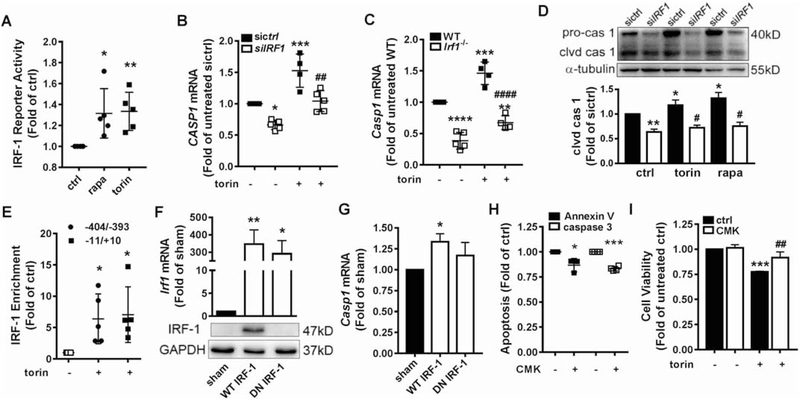
Methods and results: Western blotting, quantitative PCR, and a dual-luciferase reporter assay indicated that mTOR inhibitors rapamycin and torin 1 upregulated IRF-1 expression and increased its transcriptional activity. IRF-1 in turn contributed to the suppressive effect of mTORi by mediating HAEC apoptosis and cell cycle arrest in part through upregulation of caspase 1 and downregulation of cyclin D3, as revealed by CCK-8 assay, Annexin V binding assay, measurement of activated caspase 3, BrdU incorporation assay, and matrigel tube formation assay. In a mouse model of femoral artery wire injury, administration of rapamycin inhibited EC recovery, an effect alleviated by EC deficiency of IRF-1. Chromatin immunoprecipitation assay with HAEC and rescue expression of wild type or dominant-negative IRF-1 in EC isolated from Irf1-/- mice confirmed transcriptional regulation of IRF-1 on the expression of CASP1 and CCND3. Furthermore, mTORi activated multiple PKC members, among which PKCζ was responsible for the growth-inhibitory effect on HAEC. Activated PKCζ increased IRF1 transcription through JAK/STAT-1 and NF-κB signaling. Finally, overexpression of wild type or mutant raptor incapable of binding mTOR indicated that mTOR-free raptor contributed to PKCζ activation in mTOR-inhibited HAEC.

Conclusions: The study reveals an IRF-1-mediated mechanism that contributes to the suppressive effects of mTORi on HAEC proliferation. Further study may facilitate the development of effective strategies to reduce the side effects of DES used in coronary interventions.

Keywords: Cell proliferation; Drug-eluting stents; Endothelium; Transcription factor; mTOR.


Figures

Figure 1.
Figure 1.. mTORi suppressed HAEC proliferation concomitant with upregulation of IRF-1 expression.
(A) HAEC were treated with vehicle (ctrl), rapamycin (rapa) or torin 1(torin) at indicated dose for 18h prior to CCK-8 assay to measure cell viability. n=3; *p<0.05; **p<0.01; ***p<0.001 vs. control. (B) 96h post-transfection with control siRNA (sictrl) or MTOR-targeting siRNA (siMTOR), HAEC were subjected to CCK-8 assay (n=4) or Western blotting (C). (D) HAEC were treated with rapa or torin at indicated dose for 18h prior to BrdU incorporation assay to evaluate cell cycle progression. Shown are relative cell numbers at S phase (n=3). (E) HAEC were treated with rapa or torin at indicated dose for 18h prior to Annexin V binding assay to evaluate apoptosis (n=3–5). (F-G) HAEC were treated with rapa or torin at indicated dose for 18h (F), or at 10nM for indicated time (G) prior to Western blotting followed by quantification. Shown is representative image from at least three experiments. (H) HAEC were treated with rapa or torin at indicated dose for 2h prior to quantitative PCR to measure mRNA (n=3–4). (I) pGL3/IRF1998/+33 plasmid was constructed and promoter activity induced by 1h treatment with 10nM rapa or torin and quantified by dual-luciferase assay (n=6). *p<0.05; **p<0.01; ***p<0.001 vs. ctrl or sictrl (one way ANOVA with Dunnett’s test, A, D, E, F,G, H and I; or two-tailed paired t test, B).
Figure 2.
Figure 2.. IRF-1 contributed to mTORi-induced endothelial apoptosis and cell cycle arrest.
(A-B) HAEC were transfected with control (sictrl) or IRF1-targeting siRNA (siIRF1) before treatment with 10nM rapa and torin at 10nM for 4h (A). Murine EC were isolated from Irf1−/− or wild type (WT) littermates followed by treatment with 10nM rapa for 2h (B). Western blotting confirmed depletion of IRF-1 in HAEC (A) and mouse EC (B). Shown are representative images (n=4). (C-D) After transfection of siRNA, HAEC were treated with or without 10nM torin for 18h, prior to flow cytometric analyses of apoptosis by measuring phosphatidylserine exposed to cell surface (n=4, C) or caspase 3 activity (n=5, D). (E) EC were treated with (n=3) or without (n=5) 50nM rapa for 18h, prior to flow cytometric analyses of caspase 3 activity. (F) After transfection of siRNA, HAEC were treated with (n=5) or without (n=3) 1nM rapa for 18h, prior to BrdU incorporation assay to evaluate cell cycle progression. (G) WT or Irf1−/− EC were treated with torin at indicated dose for 18h prior to CCK-8 assay to measure cell viability (n=3). *p<0.05; ***p<0.001 vs. WT treated with identical dose of torin (two-tailed paired t test). (H) After transfection of siRNA, HAEC were seeded into matrigel in the presence or absence of 1nM rapa, and tube formation was quantified as total tube length of the network after 12h. n=5; Shown are representative images. Scale=500μm. (I) 7 days after wire injury, the femoral artery of the EC-specific Irf1 knockout mice (Irf1flox/floxTek2Cre, Irf1EC−/−) or the wild type control (Irf1flox/flox, WT), administered with vehicle or rapa was sectioned for analysis of CD31 expression (n=3). Scale=100μm *p<0.05; **p<0.01; ***p<0.001 vs. untreated sictrl or WT; #p<0.05; ##p<0.01; ###p<0.001 vs. rapa/ torin-treated sictrl or WT (one way ANOVA with Tukey’s test, A, B, C, D, E, F, H and I).
Figure 3.
Figure 3.. IRF-1 promoted apoptosis in part through transcriptional activation of caspase 1.
(A) Dual-luciferase assay indicated that 1h treatment with 10nM rapa or torin increased IRF-1 transcriptional activity (n=5). (B-C) HAEC were transfected with control (sictrl) or IRF1-targeting siRNA (siIRF1) (B). Murine EC were isolated from Irf1−/− or wild type (WT) littermate (C). EC were treated with 10nM torin for 2h, prior to quantitative PCR to measure mRNA (n=4–5). (D) siRNA-transfected HAEC were treated with 10nM rapa or torin for 2h followed by Western blotting to detect pro-caspase 1 (pro-cas 1) and cleaved caspase 1 (clvd cas 1). Shown is representative blot (n=3). (E) HAEC were treated with or without 10nM torin for 2h. IRF-1 binding to CASP1 promoter region −404/−393 or −11/+10 was examined with ChIP followed by real time PCR with primers flanking these two sequences (n=3). (F) Irf1−/− EC were transfected with pcDNA (sham), pcDNA/WT IRF1 or pcDNA/dominant-negative (DN) IRF1. After 96h, Western blotting and quantitative PCR confirmed successful rescue of IRF-1 expression. The primary antibody for Western blotting is unable to detect the truncated DN IRF-1 (n=3–4). (G) Casp1 expression was increased by rescue of WT IRF-1 expression but not the DN form (n=3–4). (H) HAEC were treated with 5μM caspase 1 inhibitor Ac-YVAD-CMK (CMK) for 1h before incubation with 10nM torin for 18h. Apoptosis was evaluated by flow cytometric analysis of Annexin V binding and caspase 3 activity (n=3–4). (I) HAEC were treated with 5μM CMK for 1h before incubation with 10nM torin for 18h. Cell viability was measured by CCK-8 assay (n=3). ***p<0.001 vs. untreated. ##p<0.01 vs. torin-treated (one way ANOVA with Tukey’s test). *p<0.05; **p<0.01; ***p<0.001 vs. untreated sictrl or WT or sham; #p<0.05; ##p<0.01; ###p<0.001 vs. rapa/ torin-treated sictrl or WT (one way ANOVA with Dunnett’s test, A, E, F and G; one way ANOVA with Tukey’s test, B, C, D, I; two-tailed paired t test, H).
Figure 4.
Figure 4.. IRF-1 inhibited cell cycle progression in part through downregulation of cyclin D3.
(A-B) HAEC (A) or murine (B) EC were treated with rapa or torin for 18h at indicated dose prior to Western blot analysis. (C) HAEC were transfected with siRNA, treated with or without 10nM rapa for 4h followed by Western blotting. Images were from the same blot. (D) EC isolated from WT or Irf1−/− mice, treated with torin at indicated dose for 18h followed by Western blotting. Shown is representative blot (n=3). (E) HAEC were transfected with siRNA, treated with 1nM rapa for 2h followed by quantitative PCR ( n=3). (F) EC isolated from WT or Irf1−/− mice, treated with 1nM rapa for 2h followed by quantitative PCR (n=3–4). (G) Ccnd3 expression was repressed by rescue of WT IRF-1 expression but not the DN form (n=3). (H) Western blotting confirmed successful overexpression of cyclin D3 after transfection of Rc/CMV-CCND3. (I) At 48h post transfection of Rc/CMV-CCND3, HAEC were treated with 1nM rapa for 18h followed by BrdU incorporation assay to evaluate cell cycle progression (n=4). (J) At 48h post transfection of Rc/CMV-CCND3, HAEC were treated with 1nM rapa for 18h followed by CCK-8 assay to evaluate cell viability (n=3–4). *p<0.05; ***p<0.001 vs. untreated sictrl or WT or sham; #p<0.05; ##p<0.01 vs. rapa-treated sictrl or WT (one way ANOVA with Tukey’s test, E, F, J; one way ANOVA with Dunnett’s test, G; one-tail paired t test, I).
Figure 5.
Figure 5.. mTORi activated STAT-1 and NF-κB.
(A) HAEC were treated with 10nM rapa or torin at indicated time followed by Western blot analysis. (B) HAEC were treated with 10nM rapa or torin for 2h (B) or 0.5h (C) followed by dual-luciferase assay to detect the transcriptional activity of NF-κB (B) or STAT-1 (C). n=3. (D) After pretreated with vehicle (ctrl), JAK, STAT-1 or NF-κB specific inhibitors Ruxolitinib (Ruxo, 1μM), Fludarabine (Flu, 17.5μM) or BAY 11–7082 (Bay, 5μM) for 1h, HAEC were incubated with 10nM torin for 2h before IRF1 mRNA was quantified with real-time PCR(n=3–5). (E-F) HAEC were treated with vehicle (ctrl), Bay (5μM) (E), Ruxo (1μM) or Flu (L: 3.5μM; H:17.5μM) (F) for 1h before incubation with 10nM rapa or torin for another 4h. HAEC lysates were subjected to Western blotting for analysis of IRF-1. (G-H) HAEC were treated with vehicle (ctrl), Bay (5μM) or Flu (17.5μM) for 1h before incubation with 10nM torin (G) or 1nM rapa (H) for 2h. CASP1 (G, n=3) or CCND3 (H, n=6) mRNA was quantified with real-time PCR. (I) HAEC were treated with vehicle (ctrl), Bay (5μM) or Flu (17.5μM) for 1h before incubation with 10nM torin for 18h. Caspase 3 activity was measure by flow cytometry (n=5). (J) HAEC were treated with vehicle (ctrl), Bay (5μM) or Flu (17.5μM) for 1h before incubation with 10nM torin for 18h. Cell viability was measured with CCK-8 assay (n=3). *p<0.05; **p<0.01 vs. ctrl (B, C); *p<0.05; **p<0.01; ***p<0.001 vs. torin/rapa-only treatment (D, G, H, I) (one way ANOVA with Dunnett’s test); **p<0.01 vs. untreated ctrl; ###p<0.001 vs. torin-only treatment (one way ANOVA with Tukey’s test, J).
Figure 6.
Figure 6.. PKCζ mediated mTORi-induced IRF-1 upregulation and cell growth suppression.
(A) HAEC were treated with 10nM rapa or torin for indicated time prior to Western blot analysis. (B) Western blotting confirmed successful knockdown of PKCζ by transfection of siRNA. (C) After transfection with control siRNA or PKCζ-targeting siRNA (siPKCζ), HAEC were treated with 1nM rapa or 100nM torin for 18h prior to CCK-8 assay to measure cell viability (n=3). (D) After transfection with control siRNA or siPKCζ, HAEC were treated with 10nM rapa or torin for 2h prior to real-time PCR to quantify IRF1 mRNA (n=3–5). (E) HAEC were pretreated with 1μM PKCζ inhibitor Pseudo-substrate inhibitor Myristoylated (PSI) followed by treatment with 10nM torin for 4h. Cell lysates were analyzed with Western blotting. (F-G) After transfection with siRNA, HAEC were treated with 10nM torin (F) or 1nM rapa (G) for 2h. CASP1 (F, n=3) or CCND3 (G, n=4) mRNA was quantified with real-time PCR. (H) After transfection of siRNA, HAEC were treated with 10nM torin for 18h. Caspase 3 activity was evaluated with flow cytometry (n=6). (I) After pretreatment with 1μM PSI for 1h, HAEC were incubated with 1nM rapa for 18h. BrdU assay was applied to evaluate cell cycle progression (n=5). *p<0.05; **p<0.01; ***p<0.001 vs. identically-treated sictrl or ctrl (two-tail unpaired t test, C; two-tail unpaired t test, D, F-I).
Figure 7.
Figure 7.. Raptor contributed to mTORi-induced PKCζ activation independent of mTORC1.
(A) At 48h post transfection with control siRNA, siRNA against RPTOR and RICTOR (siRPT+RIC), or MTOR-targeting siRNA, HAEC were submitted to Western blot analysis (A). (B) Quantification of the ratio of phosphorylated PKCζ to total PKCζ (n=3). (C) At 48h post transfection, IRF1 mRNA was measured with real-time PCR (n=5). (D) At 48h post transfection with control siRNA, siRNA against RPTOR, or siRNA against RICTOR, HAEC were submitted to Western blot analysis. (E) HAEC were treated with rapa at 25nM (rapa-L) or 250nM (rapa-H), or with torin at 50nM (torin-L) or 500nM (torin-H) for 18h prior to Western blot analysis. (F) Immunoprecipitation assay confirmed interaction between mTOR and raptor. (G) The same whole cell lysates used for immunoprecipitation in (F), or the lysates collected after immunoprecipitation reaction, were analyzed with Western blotting. Shown were results from one independent experiment each with two batches of lysates from two separate plates of HAEC culture. (H) HAEC were transfected with vector (pRK-5), pRK-5/HA-RPTOR (WT) or pRK-5/HA-RPTOR mutant (Mut) along with sictrl or siMTOR. (I) Transfected HAEC were treated with or without 10nM rapa for 1h prior to Western blot analysis. All blots shown are representative images from at least three experiments. *p<0.05; ***p<0.001 vs. sictrl; ###p<0.001 vs. siMTOR (one way ANOVA with Tukey’s test, B-C).

Similar articles

Cited by

References

    1. Bavry AA, Kumbhani DJ, Helton TJ, Borek PP, Mood GR, Bhatt DL, Late thrombosis of drug-eluting stents: a meta-analysis of randomized clinical trials, The American journal of medicine 119(12) (2006) 1056–61. - PubMed
    1. Kastrati A, Mehilli J, Pache J, Kaiser C, Valgimigli M, Kelbaek H, et al., Analysis of 14 trials comparing sirolimus-eluting stents with bare-metal stents, The New England journal of medicine 356(10) (2007) 1030–9. - PubMed
    1. Nakazawa G, Vorpahl M, Finn AV, Narula J, Virmani R, One step forward and two steps back with drug-eluting-stents: from preventing restenosis to causing late thrombosis and nouveau atherosclerosis, JACC. Cardiovascular imaging 2(5) (2009) 625–8. - PubMed
    1. Vezina C, Kudelski A, Sehgal SN, Rapamycin (AY-22,989), a new antifungal antibiotic. I. Taxonomy of the producing streptomycete and isolation of the active principle, The Journal of antibiotics 28(10) (1975) 721–6. - PubMed
    1. Laplante M, Sabatini DM, mTOR signaling in growth control and disease, Cell 149(2) (2012) 274–93. - PMC - PubMed

Publication types

MeSH terms

Substances