. 2020 Jul:329:113252.
doi: 10.1016/j.expneurol.2020.113252. Epub 2020 Feb 19.

cADPR is a gene dosage-sensitive biomarker of SARM1 activity in healthy, compromised, and degenerating axons

Affiliations

cADPR is a gene dosage-sensitive biomarker of SARM1 activity in healthy, compromised, and degenerating axons

Yo Sasaki et al. Exp Neurol. 2020 Jul.

Abstract

SARM1 is the central executioner of pathological axon degeneration, promoting axonal demise in response to axotomy, traumatic brain injury, and neurotoxic chemotherapeutics that induce peripheral neuropathy. SARM1 is an injury-activated NAD+ cleavage enzyme, and this NADase activity is required for the pro-degenerative function of SARM1. At present, SARM1 function is assayed by either analysis of axonal loss, which is far downstream of SARM1 enzymatic activity, or via NAD+ levels, which are regulated by many competing pathways. Here we explored the utility of measuring cADPR, a product of SARM1-dependent cleavage of NAD+, as an in cell and in vivo biomarker of SARM1 enzymatic activity. We find that SARM1 is a major producer of cADPR in cultured dorsal root ganglion (DRG) neurons, sciatic nerve, and brain, demonstrating that SARM1 has basal activity in the absence of injury. Following injury, there is a dramatic SARM1-dependent increase in the levels of axonal cADPR that precedes morphological axon degeneration. In vivo, there is also a rapid and large injury-stimulated increase in cADPR in sciatic and optic nerves. The increase in cADPR after injury is proportional to SARM1 gene dosage, suggesting that SARM1 activity is the prime regulator of cADPR levels. The role of cADPR as an important calcium mobilizing agent prompted exploration of its functional contribution to axon degeneration. We used multiple bacterial and mammalian engineered enzymes to manipulate cADPR levels in neurons but found no changes in the time course of axonal degeneration, suggesting that cADPR is unlikely to be an important contributor to the degenerative mechanism. Using cADPR as a SARM1 biomarker, we find that SARM1 can be partially activated by a diverse array of mitochondrial toxins administered at doses that do not induce axon degeneration. Hence, the subcritical activation of SARM1 induced by mitochondrial dysfunction may contribute to the axonal vulnerability common to many neurodegenerative diseases. Finally, we assay levels of both nerve cADPR and plasma neurofilament light chain (NfL) following nerve injury in vivo, and demonstrate that both biomarkers are excellent readouts of SARM1 activity, with cADPR reporting the early molecular changes in the nerve and NfL reporting subsequent axonal breakdown. The identification and characterization of cADPR as a SARM1 biomarker will help identify neurodegenerative diseases in which SARM1 contributes to axonal loss and expedite target validation studies of SARM1-directed therapeutics.


Conflict of interest statement

Declaration of Competing Interest A.D and J.M. co-founders of and shareholders in Disarm Therapeutics. Y.S. is a consultant to Disarm Therapeutics. R.K., R.O.H., T.M.E., T.B. and R.D. are employees and shareholders of Disarm Therapeutics. The authors have no additional competing financial interests.

Figures

Figure 1
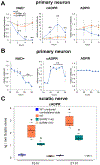
Figure 1. SARM1 is a major cADPR producing enzymes in neurons.
cADPR and NAD+ levels in cultured DRG neurons (A, B), brains (C), or sciatic nerves (D). (A) Intracellular cADPR in wild type (wt) or SARM1 KO DRG neurons expressing Venus fluorescent protein (control), SARM1, or catalytically inactive SARM1 (E642A). Wild type (wt) or SARM1 KO DRG neurons were infected with lentivirus expressing each protein and metabolites were extracted and measured using LC-MS/MS as described in the methods. Statistical analysis was performed by one-way ANOVA with Holm-Bonferroni multiple comparison (n=12-16). F(3,44) = 131.9, p<1.5x10⁻⁹. *p<1x10⁻⁵. (B) Intracellular cADPR and NAD+ levels in wt or SARM1 KO DRG neurons expressing Venus (control) or NAMPT. Statistical analysis was performed by one-way ANOVA with Holm-Bonferroni multiple comparison (n=12-16). F(3,48) = 131.9, p<2x10⁻¹⁶ for cADPR and F(3,48)=36.69, p=1.78x10⁻¹² for NAD+ (n=12-16). *p<1x10⁻⁶. (C) Brain cADPR and NAD+ levels in wt or SARM1 KO mice. Statistical analysis between wt and SARM1 KO was performed by Mann-Whitney test (n=4 for each genotype). *p<0.05. (D) Sciatic nerve cADPR and NAD+ levels in wt or SARM1 KO mice. Statistical analysis between wt and SARM1 KO was performed by Mann-Whitney test (n=7-8 for each genotype). *p<0.001. Data show the first and third quartile (box height) and median (line in the box) ± 1.5 times the interquartile.
Figure 2
Figure 2. cADPR is significantly increased in injured axons.
(A) Axonal NAD+, cADPR, and ADPR levels were quantified via LC-MS/MS at 0, 1, 2, 3, 4, and 6 hours post axotomy of cultured DRG neurons. Statistical analysis was performed by one-way ANOVA with Holm-Bonferroni multiple comparison (n=12-20). F(11,156) = 40, p=2x10⁻¹⁶ for NAD+, F(11,156) = 30, p=2x10⁻¹⁶ for cADPR, and F(11,156) = 8, p=1x10⁻¹⁰ for ADPR. **p<1x10⁻³, p*1x10⁻² denotes a significant difference compared with wt 0hr post axotomy. (B) Axonal NAD+, cADPR, and ADPR levels were quantified using LC-MS/MS at 15 to 30 hours after vincristine treatment of cultured DRG neurons. Statistical analysis was performed by one-way ANOVA with Holm-Bonferroni multiple comparison (n=2-3 for each time point). F(14,29) = 50, p=2x10⁻¹⁶ for NAD+, F(14,29) = 19, p=6.7x10⁻¹¹ for cADPR, and F(14,29) = 12, p=1.2x10⁻⁸ for ADPR. **p<1x10⁻³, p*1x10⁻² denotes a significant difference compared with 15 hours post vincristine addition. (C) Sciatic nerve cADPR and NAD+ were quantified at 15 or 24 hours post axotomy in wt, SARM1 heterozygotes (Het) or SARM1 KO sciatic nerves using LC-MS/MS. Statistical analysis was performed by one-way ANOVA with Holm-Bonferroni multiple comparison (n=4-6 mice for each condition). F(3,18) = 60, p=1.5x10⁻⁹ for 15 hours post axotomy and F(3,18) = 133, p=1.8x10⁻¹² for 21 hours post axotomy. **p<1x10⁻⁴ denotes a significant difference compared with uninjured contralateral side. Data show the first and third quartile (box height) and median (line in the box) ± 1.5 times the interquartile.
Figure 3
Figure 3. Manipulating the level of cADPR does not alter the time course of axon degeneration.
(A) Axonal cADPR and NAD+ levels were quantified at 0, 2, 4 hours after axotomy using LC-MS/MS. Axonal metabolites were extracted from Venus (control) or sCD38-DM expressing DRG neurons. Statistical analysis was performed by one-way ANOVA with Holm-Bonferroni multiple comparison (n=11-15). F(5,75) = 60, p=2x10⁻¹⁶ for cADPR and F(5,75) = 30, p=2x10⁻¹⁶ for NAD+. ***p<1x10⁻¹⁰, **p<1x10⁻³, *p<0.05 denotes a significant difference from metabolite levels in control axons at each time post axotomy. (B) Axonal degeneration was quantified using the degeneration index of Venus (control) or sCD38-DM expressing DRG neurons from 0 to 48 hours post axotomy. Statistical analysis was performed by one-way ANOVA with Holm-Bonferroni multiple comparison (n=14-29). F(7,180) = 160, p=2x10⁻¹⁶. *p<2x10⁻¹⁶ denotes significant difference from degeneration index of control 0 hour post axotomy. (C) Axonal cADPR and NAD+ levels were quantified at 0, 2, 4 hours after axotomy using LC-MS/MS. Axonal metabolites were extracted from Venus (control) or ADPRM-QM expressing DRG neurons. Statistical analysis was performed by one-way ANOVA with Holm-Bonferroni multiple comparison (n=12). F(5,66) = 80, p=2x10⁻¹⁶ for cADPR and F(5,66) = 27, p=7.4x10⁻¹⁵ for NAD+. ***p<1x10⁻¹⁵, **p<0.0015 denotes a significant difference from metabolite levels in control axons at each time post axotomy. (D) Axonal degeneration was quantified using the degeneration index of Venus (control) or ADPRM-QM expressing DRG neurons from 0 to 48 hours post axotomy. Statistical analysis was performed by one-way ANOVA with Holm-Bonferroni multiple comparison (n=27-31). F(7,223) = 72, p=2x10⁻¹⁶. *p<2x10⁻¹⁶ denotes a significant difference from degeneration index of control 0 hour post axotomy. Data show the first and third quartile (box height) and median (line in the box) ± 1.5 times the interquartile.
Figure 4
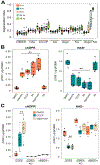
Figure 4. Mitochondria dysfunction induces a SARM1-dependent increase in the levels of cADPR.
(A) Axonal degeneration was quantified the using degeneration index of DMSO, rotenone (rote), CCCP, antimycin A (AA), oligomycin (Oligo), koningic acid (KA) or oligomycin with koningic acid (oligo + KA) treated DRG neurons from 0 to 48 hours post chemical addition. Statistical analysis was performed with one-way ANOVA and Holm-Bonferroni multiple comparison (n=8-12). F(34,292) = 31, p=2x10⁻¹⁶. *p<1x10⁻¹³ denotes significant difference from degeneration index of post 0 hour DMSO treated axons. (B) Axonal cADPR and NAD+ levels were quantified using LC-MS/MS at 6 hours after the addition of DMSO, rotenone, CCCP, antimycin A (AA), oligomycin, or coningic acid (KA) to DRG neurons. Statistical analysis was performed with one-way ANOVA and with Holm-Bonferroni multiple comparison (n=5-8). F(5,39) = 39, p=4.2x10⁻¹⁴ for cADPR and F(5,39) = 38, p=5.2x10⁻¹⁴ for NAD+. *p<1x10⁻⁶ denotes a significant difference from metabolite levels in axons treated with DMSO. (C) cADPR and NAD+ levels were quantified in wt (control), SARM1 KO, or cytNMNAT1 expressing (NMNAT1) DRG neurons at 6 hours after the addition of DMSO, CCCP, or oligomycin using LC-MS/MS. Statistical analysis was performed with one-way ANOVA and Holm-Bonferroni multiple comparison (n=4-12). F(8,51) = 25, p=5.7x10⁻¹⁵ for cADPR and F(8,51) = 52, p=2x10⁻¹⁶ for NAD+. *p<1x10⁻⁵ , *p<1x10⁻³ denotes a significant difference from metabolite levels compared with DMSO treated neurons in each group (control, SARM1 KO, or NMNAT1). Data show the first and third quartile (box height) and median (line in the box) ± 1.5 times the interquartile.
Figure 5
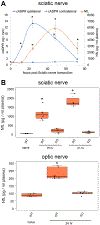
Figure 5. NfL increase after axonal injury is SARM1-dependnent.
(A) Sciatic nerve cADPR levels were quantified in axotomized (ipsilateral) and control (contralateral) sciatic nerves at 0, 3, 12, 24, 48, and 72 hours post axotomy. Plasma neurofilament light chain (NfL) levels were quantified from mouse plasma collected at 0,3,12,24,48,72 hours post sciatic nerve axotomy. Statistical analysis was performed with one-way ANOVA and Holm-Bonferroni multiple comparison (n=5-6). F(11,59) = 414, p=2x10⁻¹⁶ for cADPR and F(5,30) = 78, p=2.5x10⁻¹⁶ for NfL. *p<1x10⁻⁶ denotes a significant difference from cADPR or NfL levels compared with 0 hour post axotomy samples. (B) Plasma neurofilament light chain (NfL) levels were quantified from wild type (WT) or SARM1 KO (KO) mice (naïve) and mice receiving sciatic nerve axotomy (15 or 21 hours post injury, top panel) or optic nerve injury (24 hours post injury, bottom panel). Statistical analysis was performed with one-way ANOVA and Holm-Bonferroni multiple comparison (n=4-6 for mice with or without sciatic nerve axotomy and n=4-6 for mice with or without optic nerve injury). F(4,22) = 68, p=4.4x10⁻¹² for NfL levels after Sciatic nerve injury and F(2,13) = 52, p=6.2x10⁻⁷ for NfL levels after optic nerve injury. *p<1x10⁻⁵ denotes a significant difference from NfL levels compared with wt naive samples. Data show the first and third quartile (box height) and median (line in the box) ± 1.5 times the interquartile.

Similar articles

Cited by

References

    1. Araki T, Sasaki Y, Milbrandt J. Increased nuclear NAD biosynthesis and SIRT1 activation prevent axonal degeneration. Science 2004; 305: 1010–1013. - PubMed
    1. Beirowski B, Adalbert R, Wagner D, Grumme DS, Addicks K, Ribchester RR, et al. The progressive nature of Wallerian degeneration in wild-type and slow Wallerian degeneration (WldS) nerves. BMC Neurosci 2005; 6: 6–27. - PMC - PubMed
    1. Benatar M, Wuu J, Andersen PM, Lombardi V, Malaspina A. Neurofilament light: A candidate biomarker of presymptomatic amyotrophic lateral sclerosis and phenoconversion. Ann. Neurol 2018; 84: 130–139. - PMC - PubMed
    1. Cheng Y, Liu J, Luan Y, Liu Z, Lai H, Zhong W, et al. Sarm1 Gene Deficiency Attenuates Diabetic Peripheral Neuropathy in Mice. Diabetes 2019; 68: 2120–2130. - PMC - PubMed
    1. DiAntonio A Axon degeneration: mechanistic insights lead to therapeutic opportunities for the prevention and treatment of peripheral neuropathy. Pain 2019; 160 Suppl 1: S17–S22. - PMC - PubMed

Publication types

MeSH terms