

Orthonasal versus retronasal glomerular activity in rat olfactory bulb by fMRI
- PMID: 32087375
- PMCID: PMC9362851
- DOI: 10.1016/j.neuroimage.2020.116664
Orthonasal versus retronasal glomerular activity in rat olfactory bulb by fMRI
Abstract
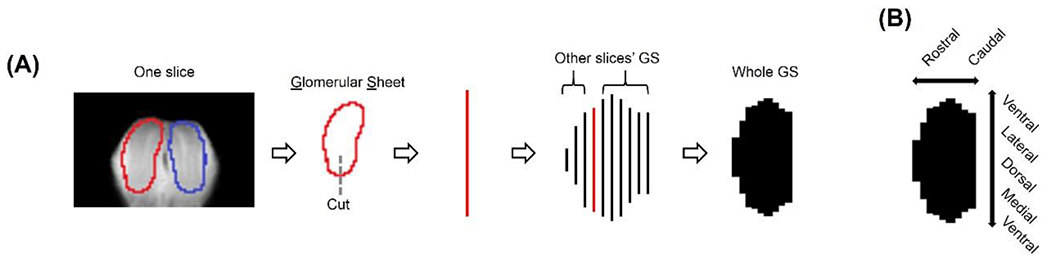
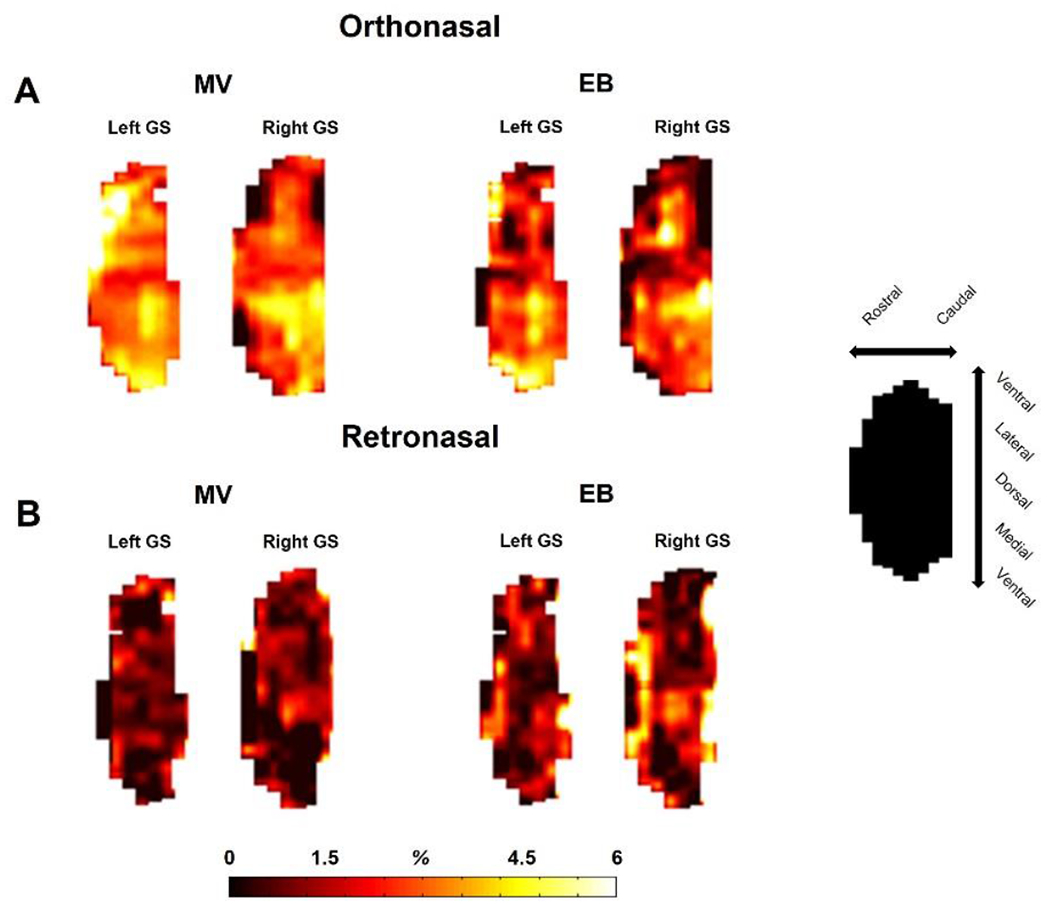
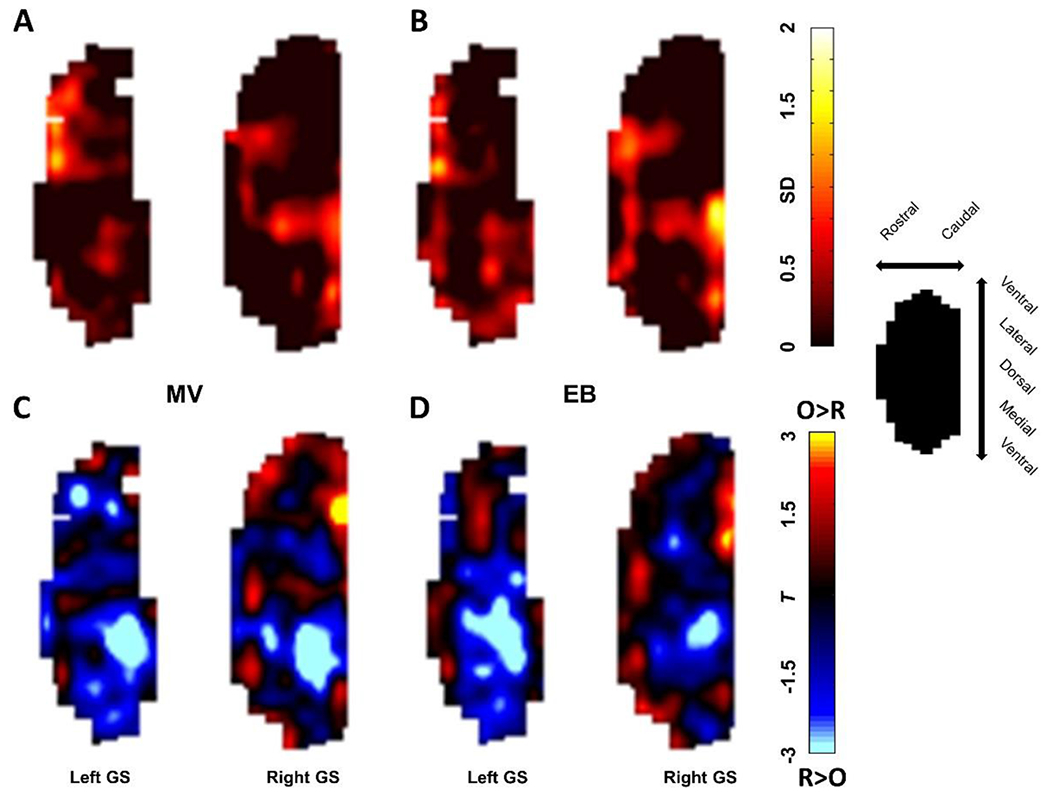
Odorants can reach olfactory receptor neurons (ORNs) by two routes: orthonasally, when volatiles enter the nasal cavity during inhalation/sniffing, and retronasally, when food volatiles released in the mouth pass into the nasal cavity during exhalation/eating. Previous work in humans has shown that both delivery routes of the same odorant can evoke distinct perceptions and patterns of neural responses in the brain. Each delivery route is known to influence specific responses across the dorsal region of the glomerular sheet in the olfactory bulb (OB), but spatial distributions across the entire glomerular sheet throughout the whole OB remain largely unexplored. We used functional MRI (fMRI) to measure and compare activations across the entire glomerular sheet in rat OB resulting from both orthonasal and retronasal stimulations of the same odors. We observed reproducible fMRI activation maps of the whole OB during both orthonasal and retronasal stimuli. However, retronasal stimuli required double the orthonasal odor concentration for similar response amplitudes. Regardless, both the magnitude and spatial extent of activity were larger during orthonasal versus retronasal stimuli for the same odor. Orthonasal and retronasal response patterns show overlap as well as some route-specific dominance. Orthonasal maps were dominant in dorsal-medial regions, whereas retronasal maps were dominant in caudal and lateral regions. These different whole OB encodings likely underlie differences in odor perception between these biologically important routes for odorants among mammals. These results establish the relationships between orthonasal and retronasal odor representations in the rat OB.
Keywords: Glomeruli; Olfactory bulb; Orthonasal; Retronasal; fMRI.
Copyright © 2020 The Authors. Published by Elsevier Inc. All rights reserved.
Figures

Similar articles
-
Retronasal odor representations in the dorsal olfactory bulb of rats.J Neurosci. 2012 Jun 6;32(23):7949-59. doi: 10.1523/JNEUROSCI.1413-12.2012. J Neurosci. 2012. PMID: 22674270 Free PMC article.
-
Glomerular input patterns in the mouse olfactory bulb evoked by retronasal odor stimuli.BMC Neurosci. 2013 Apr 8;14:45. doi: 10.1186/1471-2202-14-45. BMC Neurosci. 2013. PMID: 23565900 Free PMC article.
-
Retronasal odor concentration coding in glomeruli of the rat olfactory bulb.Front Integr Neurosci. 2014 Oct 24;8:81. doi: 10.3389/fnint.2014.00081. eCollection 2014. Front Integr Neurosci. 2014. PMID: 25386123 Free PMC article.
-
Processing of Odor Information During the Respiratory Cycle in Mice.Front Neural Circuits. 2022 Mar 31;16:861800. doi: 10.3389/fncir.2022.861800. eCollection 2022. Front Neural Circuits. 2022. PMID: 35431818 Free PMC article. Review.
-
Circuit formation and sensory perception in the mouse olfactory system.Front Neural Circuits. 2024 Feb 16;18:1342576. doi: 10.3389/fncir.2024.1342576. eCollection 2024. Front Neural Circuits. 2024. PMID: 38434487 Free PMC article. Review.
Cited by
-
Awake rodent fMRI: Gradient-echo echo planar imaging versus compressed-sensing fast low-angle shot.Imaging Neurosci (Camb). 2025 Jan 2;3:imag_a_00406. doi: 10.1162/imag_a_00406. eCollection 2025. Imaging Neurosci (Camb). 2025. PMID: 40800768 Free PMC article.
-
Odor modality is transmitted to cortical brain regions from the olfactory bulb.J Neurophysiol. 2023 Nov 1;130(5):1226-1242. doi: 10.1152/jn.00101.2023. Epub 2023 Oct 4. J Neurophysiol. 2023. PMID: 37791383 Free PMC article.
-
Resting State Brain Networks under Inverse Agonist versus Complete Knockout of the Cannabinoid Receptor 1.ACS Chem Neurosci. 2024 Apr 17;15(8):1669-1683. doi: 10.1021/acschemneuro.3c00804. Epub 2024 Apr 4. ACS Chem Neurosci. 2024. PMID: 38575140 Free PMC article.
-
Differences in olfactory bulb mitral cell spiking with ortho- and retronasal stimulation revealed by data-driven models.PLoS Comput Biol. 2021 Sep 20;17(9):e1009169. doi: 10.1371/journal.pcbi.1009169. eCollection 2021 Sep. PLoS Comput Biol. 2021. PMID: 34543261 Free PMC article.
-
Human Oral Sensitivity to and Taste Modulation by 3-Mercapto-2-Methylpentan-1-ol.Chemosens Percept. 2022;15(2):70-86. doi: 10.1007/s12078-022-09295-w. Epub 2022 Feb 25. Chemosens Percept. 2022. PMID: 35233259 Free PMC article.
References
-
- Bojanowski V, Hummel T, 2012. Retronasal perception of odors. Physiol Behav 107, 484–487. - PubMed
-
- Buettner A, Beer A, Hannig C, Settles M, 2001. Observation of the swallowing process by application of videofluoroscopy and real-time magnetic resonance imaging-consequences for retronasal aroma stimulation. Chem Senses 26, 1211–1219. - PubMed
-
- Frasnelli J, van Ruth S, Kriukova I, Hummel T, 2005. Intranasal concentrations of orally administered flavors. Chem Senses 30, 575–582. - PubMed
Publication types
MeSH terms
Grants and funding
LinkOut - more resources
Full Text Sources
Miscellaneous
