. 2020 Mar;19(3):e13108.
doi: 10.1111/acel.13108. Epub 2020 Feb 22.

Heterochromatin loss as a determinant of progerin-induced DNA damage in Hutchinson-Gilford Progeria

Affiliations

Heterochromatin loss as a determinant of progerin-induced DNA damage in Hutchinson-Gilford Progeria

Alexandre Chojnowski et al. Aging Cell. 2020 Mar.

Abstract

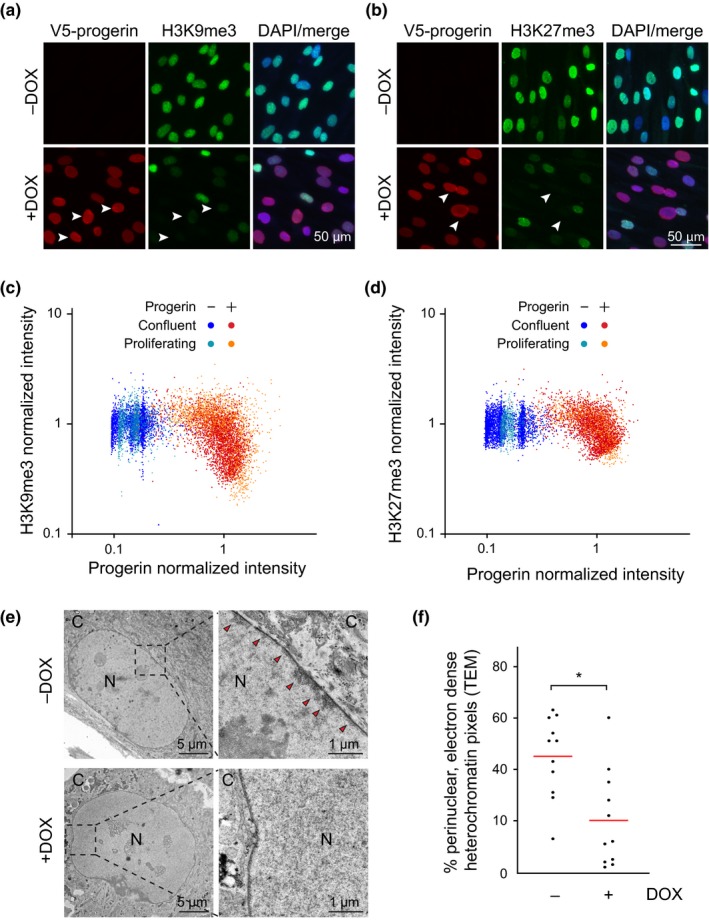
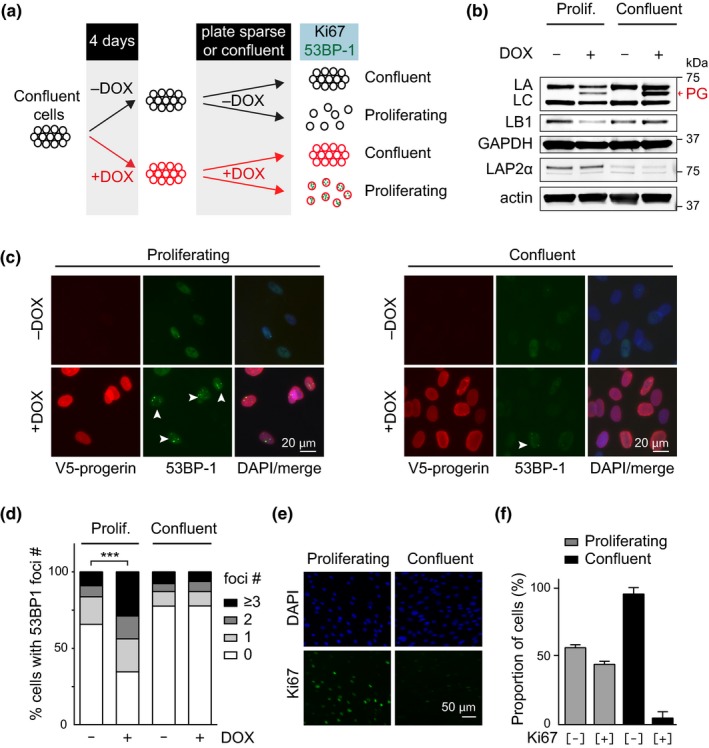
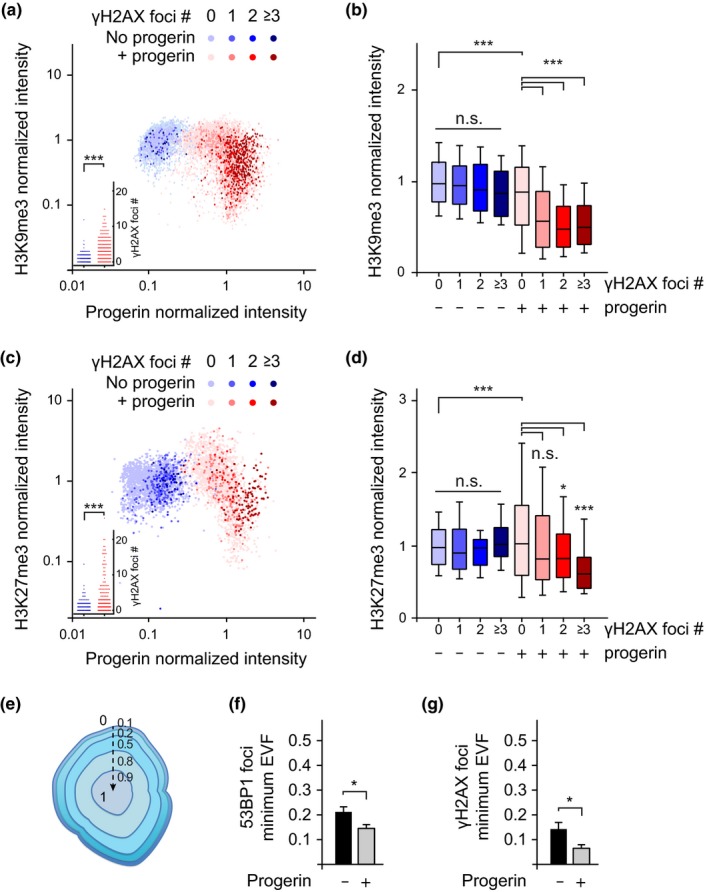
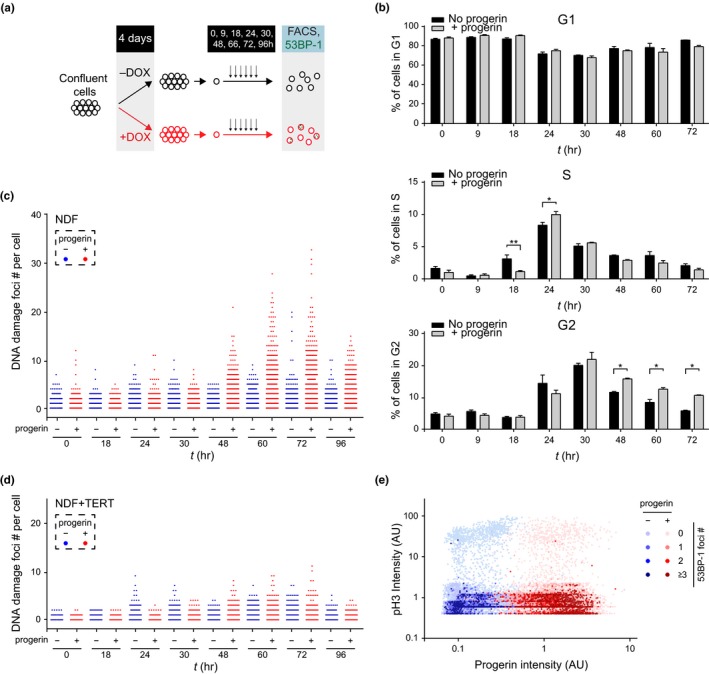
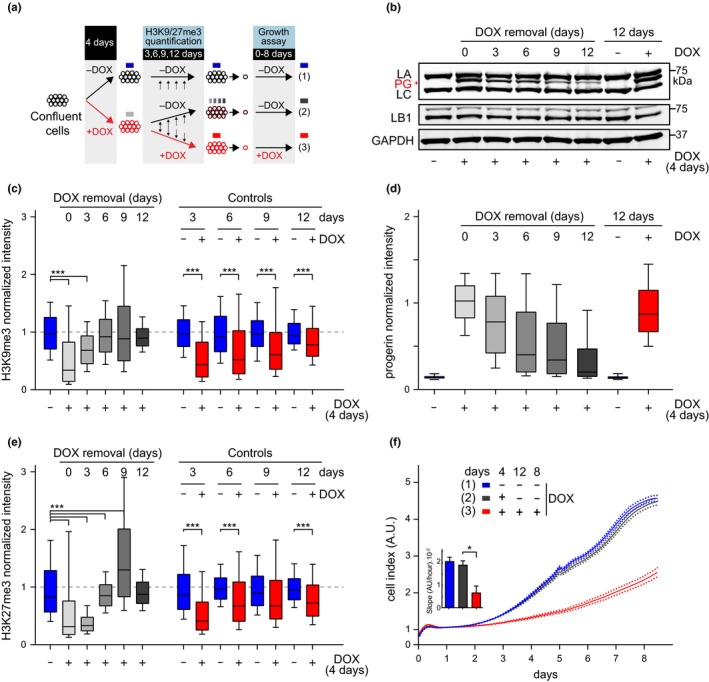
Hutchinson-Gilford progeria is a premature aging syndrome caused by a truncated form of lamin A called progerin. Progerin expression results in a variety of cellular defects including heterochromatin loss, DNA damage, impaired proliferation and premature senescence. It remains unclear how these different progerin-induced phenotypes are temporally and mechanistically linked. To address these questions, we use a doxycycline-inducible system to restrict progerin expression to different stages of the cell cycle. We find that progerin expression leads to rapid and widespread loss of heterochromatin in G1-arrested cells, without causing DNA damage. In contrast, progerin triggers DNA damage exclusively during late stages of DNA replication, when heterochromatin is normally replicated, and preferentially in cells that have lost heterochromatin. Importantly, removal of progerin from G1-arrested cells restores heterochromatin levels and results in no permanent proliferative impediment. Taken together, these results delineate the chain of events that starts with progerin expression and ultimately results in premature senescence. Moreover, they provide a proof of principle that removal of progerin from quiescent cells restores heterochromatin levels and their proliferative capacity to normal levels.

Keywords: DNA damage; HGPS; heterochromatin; lamin A; progerin; senescence.


Conflict of interest statement

Authors declare that there is no conflict of interest.

Figures

Figure 1
Figure 1
Progerin‐dependent loss of H3K9me3 and H3K27me3 heterochromatin marks in G1‐arrested confluent NDF. (a,b) Immunofluorescence microscopy of H3K9me3 (a) and H3K27me3 (b) staining in G1‐arrested cells in the presence or absence of progerin. V5‐progerin (V5 antibody) and H3K9me3/H3K27me3 antibodies are indicated, with DAPI overlay. Scale bar: 50 μm. Progerin‐expressing cells with extensive loss of H3K9me3 or H3K27me3 are marked by white arrowheads. (c,d) Scatter plot analysis of H3K9me3 (c) or H3K27me3 (d) and progerin levels in confluent or proliferating NDF in the presence (red, orange) or absence (blue, light blue) of progerin. H3K9me3 or H3K27me3 and progerin normalized intensities are plotted on Y and X axis, respectively. A total of ~9 × 103 and ~7 × 103 nuclei were quantified for H3K9me3 and H3K27me3 analysis, respectively, from 3 independent experiments. (e) Electron microscopy imaging of peripheral heterochromatin in confluent NDF in the presence (lower panel) or absence (upper panel, red arrowheads) of progerin. Nucleus (N) and cytoplasm (C) are indicated, scale bars: 5μm (left panels) and 1μm (right panels). (f) Quantification of perinuclear heterochromatin from TEM images in the absence (−DOX) and presence (+DOX) of progerin (see Figure S1‐1a) (*p < .05, n = 11 cells per condition, Mann‐Whitney test)
Figure 2
Figure 2
Progerin‐induced DNA damage is restricted to proliferating cells. (a) Schematic representation of the experimental set up. (b) Western blotting showing doxycycline‐dependent progerin expression in proliferating and confluent NDF. Progerin migrates between lamin A and C as indicated (red arrowhead). Lamin A (LA), lamin C (LC), progerin (PG), lamin B1 (LB1), LAP2α, GAPDH and actin are indicated. (c) Immunofluorescence microscopy showing progerin‐induced 53BP‐1 foci (white arrowheads) in proliferating (left panel) or confluent cells (right panel). V5‐progerin (V5 antibody) and 53BP‐1 foci (53BP‐1 antibody) are indicated. Scale bar: 20 μm. (d) Quantification of DNA damage foci (0, 1, 2, 3 or more 53BP‐1 foci), in proliferating or confluent cells in the absence or presence of progerin (***p < .001, n = 3, χ2 test). (e) Immunofluorescence microscopy showing Ki‐67 staining in proliferating (left panels) and confluent cells (right panels). DAPI and Ki‐67 antibody are shown on top and bottom panels, respectively. Scale bar: 50 μm. (f) Quantification of the percentage of Ki‐67‐positive and Ki‐67‐negative cells in proliferating or confluent cultures (grey and black bars, respectively)
Figure 3
Figure 3
Preferential accumulation of DNA damage foci in cells with lower levels of H3K9me3 and H3K27me3. (a) Scatter plot analysis of H3K9me3, progerin expression and γH2AX DNA damage foci number per nucleus, in NDF expressing progerin (red) or nonexpressing controls (blue). For each nuclei, H3K9me3 and progerin normalized intensities are plotted on Y and X axis, respectively, while the number of DNA damage foci is represented by colour intensity (light to dark colour: 0, 1, 2, 3 or more DNA damage foci per nucleus). Inset: DNA damage counts of the same data (***p < .001, Student's t test). A total of ~ 1x10⁴ cells from 3 independent experiments were analysed. (b) Box plot of data shown in (a), whiskers represent 10–90 percentile (***p < .001, one‐way ANOVA with Tukey's post‐test). (c) Scatter plot analysis of H3K27me3, progerin expression and γH2AX DNA damage foci number. Inset: DNA damage counts of the same data (***p < .001, Student's t test). A total of ~ 4x10³ cells from 3 independent experiments were analysed. (d) Box plot of the same data, whiskers represent 10–90 percentile (***p < .001, *p < .05, one‐way ANOVA with Tukey's post‐test). (e,f) 3D‐SIM analysis of DNA damage foci. Illustration of the Eroded Volume Fraction (EVF) index to assess proximity to the nuclear lamina, from closest (0) to furthest (1) (reproduction of Figure S1‐1b). (f,g) Quantification of the average minimum EVF value for 53BP‐1 (f) and γH2AX (g) DNA damage foci, ± progerin. A total of 225 53BP‐1 and 135 γH2AX DNA damage foci were analysed. (*p < .05, Student's t test)
Figure 4
Figure 4
Progerin‐induced DNA damage occurs in late S‐phase and is associated with a persistent G2 arrest. (a) Schematic representation of the experimental design. (b) Cell cycle profile of control (black bars) and progerin‐expressing (grey bars) NDF at each time point (in hours) after release from G1‐arrest by FACS (% of cells in G1, S‐phase and G2 are shown in top, middle and lower panels, respectively; *p < .05, **p < .01, n = 3, two‐way ANOVA with Sidak's post‐test). (c) DNA damage accumulation in control (blue) and progerin‐expressing (red) NDF upon release from G1. The number of 53BP‐1 foci per cell is displayed at each time point. A total of ~1 × 105 cells from 3 independent experiments were analysed. (d) Quantification of DNA damage foci in control (blue) and progerin‐expressing (red) TERT‐positive NDF upon G1 release. A total of 7 × 104 cells from 2 independent experiments were analysed. (e) Scatter plot analysis of phospho‐H3 (pH3), progerin expression and 53BP‐1 DNA damage foci per nucleus, in control (blue) and progerin‐expressing (red) NDF upon release from G1. Data from all time points post‐G1‐arrest release (0–96 hr) are represented. Phospho‐H3 and progerin normalized intensities are plotted on Y and X axis, respectively, while the number of DNA damage foci is represented by colour intensity. From light to dark colour: 0, 1, 2, 3 or more DNA damage foci. ~9 × 104 cells from 2 independent experiments were analysed
Figure 5
Figure 5
Restored heterochromatin levels and cell proliferation upon progerin removal in G1‐arrested NDF. (a) NDF were grown to confluence and exposed to progerin expression (+DOX, red circles) for 4 days. Nonexposed cells (−DOX, black circles, blue box) served as a control. After 4 days, progerin expression was either turned off (−DOX; black/red circles, grey box) or left on (+DOX, red circles, red box) and kept confluent for an additional 12 days. Proliferation rates were compared for cells never exposed to progerin (blue), cells in which progerin was removed (grey) and cells constitutively exposed to progerin (red). (b) Western blotting showing doxycycline‐dependent progerin expression and removal in confluent primary fibroblasts. Progerin (PG), lamin A (LA) and lamin C (LC), lamin B1 (LB1) and GAPDH are indicated. Progerin intensities quantified by single‐cell immunofluorescence microscopy at each day are indicated in panel (d). A total of ~ 7.7 × 104 nuclei were quantified for both H3K9me3 and H3K27me3 quantifications, from 2 independent experiments. Whiskers represent 10–90 percentile. (c,e) Box plot representation of H3K9me3 (c) and H3K27me3 (e) levels at the indicated times post doxycycline removal (0, 3, 6, 9, 12 days; grey bars) or in controls never (blue) or constitutively (red) exposed to progerin. A total of ~3.8 × 104 and ~3.9 × 104 nuclei were quantified for H3K9me3 and H3K27me3, respectively, from 2 independent experiments, ***p < .001, one‐way ANOVA with Sidak's post‐test. Whiskers represent 10–90 percentile. (d) Box plot representation of progerin normalized intensity per nucleus, in NDF induced to express progerin (grey, red) or noninduced (blue/black). (f) Growth curve of control and primary fibroblasts continuously expressing progerin (red line), not expressing progerin (blue line), or expressing progerin for 4 days while confluent and without induction thereafter (black). Dotted lines indicate SEM (n = 3). Inset: growth rate after 8 days, error bars indicate SEM (*p < .05, one‐way ANOVA with Tukey's post‐test)

References

    1. Anversa, P. , & Nadal‐Ginard, B. (2002). Myocyte renewal and ventricular remodelling. Nature, 415, 240–243. 10.1038/415240a - DOI - PubMed
    1. Arnoult, N. , Schluth‐Bolard, C. , Letessier, A. , Drascovic, I. , Bouarich‐Bourimi, R. , Campisi, J. , … Londoño‐Vallejo, A. (2010). Replication timing of human telomeres is chromosome arm‐specific, influenced by subtelomeric structures and connected to nuclear localization. PLoS Genetics, 6, e1000920 10.1371/journal.pgen.1000920 - DOI - PMC - PubMed
    1. Ballester, M. , Kress, C. , Hue‐Beauvais, C. , Kiêu, K. , Lehmann, G. , Adenot, P. , & Devinoy, E. (2008). The nuclear localization of WAP and CSN genes is modified by lactogenic hormones in HC11 cells. Journal of Cellular Biochemistry, 105, 262–270. 10.1002/jcb.21823 - DOI - PubMed
    1. Benson, E. K. , Lee, S. W. , & Aaronson, S. A. (2010). Role of progerin‐induced telomere dysfunction in HGPS premature cellular senescence. Journal of Cell Science, 123, 2605–2612. 10.1242/jcs.067306 - DOI - PMC - PubMed
    1. Bergmann, O. , Bhardwaj, R. D. , Bernard, S. , Zdunek, S. , Barnabé‐Heider, F. , Walsh, S. , … Frisén, J. (2009). Evidence for cardiomyocyte renewal in humans. Science, 324, 98–102. 10.1126/science.1164680 - DOI - PMC - PubMed

Publication types

MeSH terms

LinkOut - more resources