. 2020 Feb 22;17(1):70.
doi: 10.1186/s12974-020-01746-z.

Sustained hyperammonemia induces TNF-a IN Purkinje neurons by activating the TNFR1-NF-κB pathway

Affiliations

Sustained hyperammonemia induces TNF-a IN Purkinje neurons by activating the TNFR1-NF-κB pathway

Tiziano Balzano et al. J Neuroinflammation. .

Abstract

Background: Patients with liver cirrhosis may develop hepatic encephalopathy. Rats with chronic hyperammonemia exhibit neurological alterations mediated by peripheral inflammation and neuroinflammation. Motor incoordination is due to increased TNF-a levels and activation of its receptor TNFR1 in the cerebellum. The aims were to assess (a) whether peripheral inflammation is responsible for TNF-a induction in hyperammonemic rats, (b) the cell type(s) in which TNF-a is increased, (c) whether this increase is associated with increased nuclear NF-κB and TNFR1 activation, (d) the time course of TNF-a induction, and (e) if TNF-a is induced in the Purkinje neurons of patients who die with liver cirrhosis.

Methods: We analyzed the level of TNF-a mRNA and NF-κB in microglia, astrocytes, and Purkinje neurons in the cerebellum after 1, 2, and 4 weeks of hyperammonemia. We assessed whether preventing peripheral inflammation by administering an anti-TNF-a antibody prevents TNF-a induction. We tested whether TNF-a induction is reversed by R7050, which inhibits the TNFR1-NF-κB pathway, in ex vivo cerebellar slices.

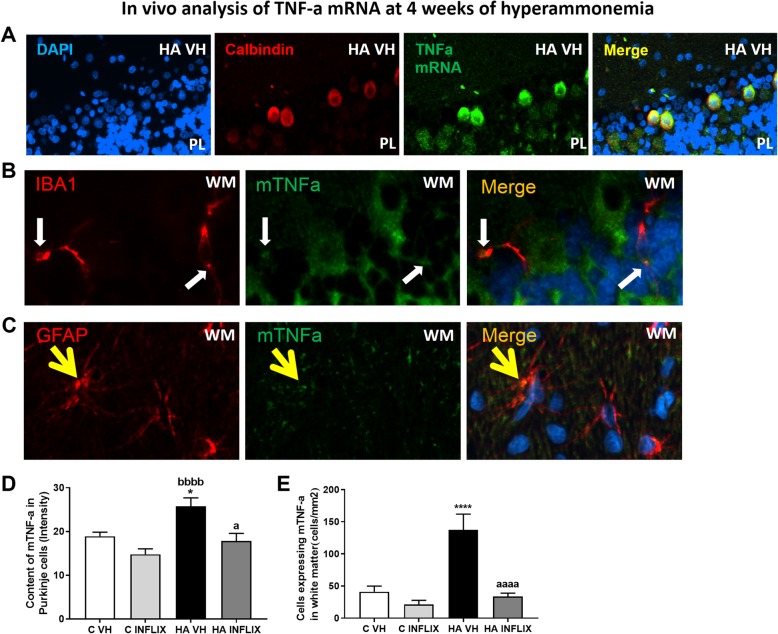
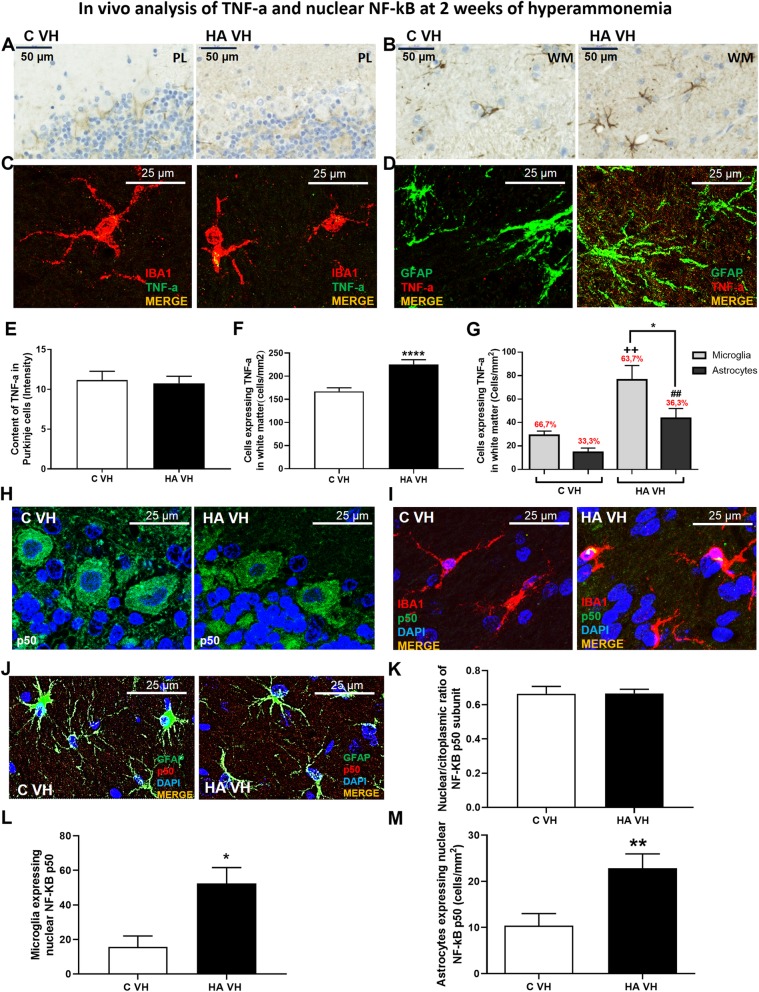
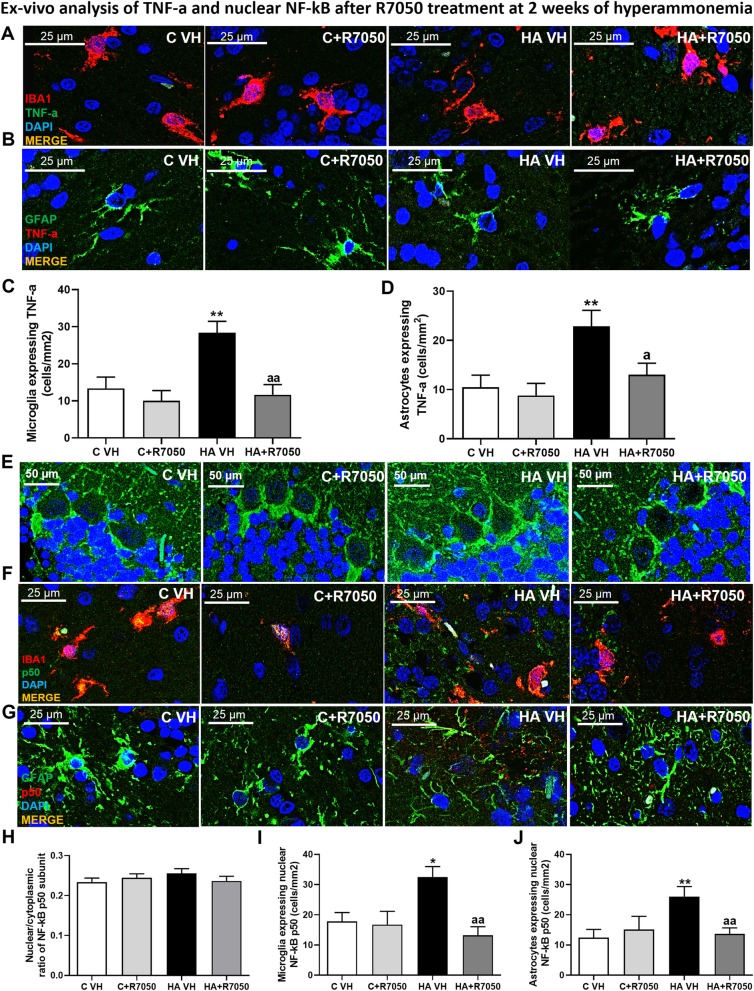
Results: Hyperammonemia induced microglial and astrocyte activation at 1 week. This was followed by TNF-a induction in both glial cell types at 2 weeks and in Purkinje neurons at 4 weeks. The level of TNF-a mRNA increased in parallel with the TNF-a protein level, indicating that TNF-a was synthesized in Purkinje cells. This increase was associated with increased NF-κB nuclear translocation. The nuclear translocation of NF-κB and the increase in TNF-a were reversed by R7050, indicating that they were mediated by the activation of TNFR1. Preventing peripheral inflammation with an anti-TNF-a antibody prevents TNF-a induction.

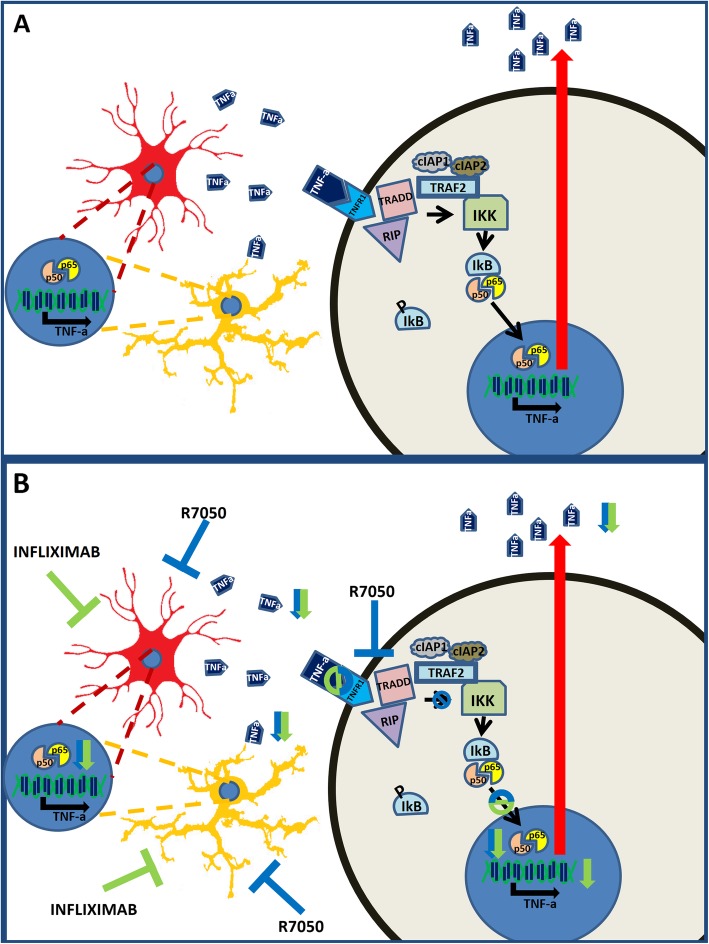
Conclusion: Sustained (4 weeks) but not short-term hyperammonemia induces TNF-a in Purkinje neurons in rats. This is mediated by peripheral inflammation. TNF-a is also increased in the Purkinje neurons of patients who die with liver cirrhosis. The results suggest that hyperammonemia induces TNF-a in glial cells and that TNF-a released by glial cells activates TNFR1 in Purkinje neurons, leading to NF-κB nuclear translocation and the induction of TNF-a expression, which may contribute to the neurological alterations observed in hyperammonemia and hepatic encephalopathy.

Keywords: Hyperammonemia; Neuroinflammation; Purkinje neurons; TNF-a; TNFR1.


Conflict of interest statement

The authors declare that they have no competing interests.

Figures

Fig. 1
Fig. 1
Experimental design. a Rats were fed an ammonia-containing diet for 4 weeks and sacrificed by perfusion for in vivo immunohistochemical analysis of microglial and astrocyte activation (blue box), the protein expression of nuclear NF-kB and TNF-a in glia and Purkinje neurons (green box), and the mRNA expression of TNF-a in glia and Purkinje neurons (violet box) in the cerebellum. The effects of peripheral intravenous infliximab administration were assessed by injecting the drug into the rats once per week (5 mg/kg) starting 3 days before the administration of an ammonia-containing diet. b Rats were fed an ammonia-containing diet and sacrificed at different time points for in vivo analysis of microglial and astrocyte activation after 1 week of hyperammonemia (blue box), in vivo analysis of nuclear NF-kB and TNF-a protein expression in glia and Purkinje neurons after 1 and 2 weeks of hyperammonemia (green box), and ex vivo analysis of nuclear NF-kB and TNF-a protein expression in glia and Purkinje neurons after 2 and 4 weeks of hyperammonemia (red box). c TNF-a expression in Purkinje neurons was also analyzed by immunohistochemistry on postmortem cerebellar samples from patients who died with liver cirrhosis
Fig. 2
Fig. 2
Infliximab prevents microglial and astrocyte activation in the white matter of the cerebellum of hyperammonemic rats. Representative images of microglial (a, b) and astrocyte activation (c) in the white matter of the cerebellum are shown. The perimeter of microglial cells (d), cells expressing CD68 (e), and the GFAP-stained area (f) were evaluated. Hyperammonemia (4 weeks) induced microglial and astrocyte activation in the white matter of the cerebellum, which was prevented by infliximab. The values are the mean ± SEM of 6 rats per group. Values that were significantly different from those of control rats are indicated by asterisks, and values that were significantly different from those of HA rats are indicated by a. ***p < 0.001, ****p < 0.0001, aa p < 0.01, aaaa p < 0.0001. Scale bar = 50 μm. C VH = vehicle-treated control rats, C INFLIX = control rats treated with infliximab, HA VH = vehicle-treated hyperammonemic rats, HA INFLIX = hyperammonemic rats treated with infliximab
Fig. 3
Fig. 3
The content of TNF-a is increased in microglia, astrocytes, and Purkinje neurons after 4 weeks of hyperammonemia and is normalized by infliximab. Immunohistochemistry for TNF-a was performed as described in the “Methods” section. Representative images of white matter (a) and Purkinje neurons (d, e) are shown, and the quantified data are shown in f and h. Double immunofluorescence was performed using antibodies against TNF-a and Iba-1 (b) or GFAP (c), and the percentage of glial cells expressing TNF-a was determined (g). Values that were significantly different from those of control rats are indicated by asterisks, and values that were significantly different from those of HA VH rats are indicated by a. + refers to microglia expressing TNF-a in HA VH rats vs microglia expressing TNF-a in C VH rats, # refers to astrocytes expressing TNF-a in HA VH rats vs astrocytes expressing TNF-a in C VH rats, α refers to microglia expressing TNF-a in HA VH rats vs microglia expressing TNF-a in HA INFLIX rats, and @ refers to astrocytes expressing TNF-a in HA VH rats vs astrocytes expressing TNF-a in HA INFLIX rats. One symbol indicates p ≤ 0.05; two symbols indicate p < 0.01 and three symbols indicate p ≤ 0.001. C VH = vehicle-treated control rats; C INFLIX = control rats treated with infliximab; HA VH = vehicle-treated hyperammonemic rats; HA INFLIX = hyperammonemic rats treated with infliximab
Fig. 4
Fig. 4
The expression of mTNF-a is increased in the white matter and Purkinje layer of the cerebellum after 4 weeks of hyperammonemia and is normalized by infliximab. Double fluorescence staining for TNF-a mRNA (green) and calbindin (red, a), Iba-1 (red, b), or GFAP (red, c) is shown. The content of TNF-a mRNA in Purkinje neurons (d) and white matter (e) was quantified. The values are the mean ± SEM of 3 rats per group. Values that were significantly different from those of the control rats are indicated by asterisks, values that were significantly different from those of the HA VH rats are indicated by a, and values that were significantly different from those infliximab-treated control rats are indicated by b. *p ≤ 0.05; ****p ≤ 0.0001; a p < 0.05; aaaa p ≤ 0.0001; bbbb p ≤ 0.0001. C VH = vehicle-treated control rats; C INFLIX = control rats treated with infliximab; HA VH = vehicle-treated hyperammonemic rats; HA INFLIX = hyperammonemic rats treated with infliximab
Fig. 5
Fig. 5
Sustained hyperammonemia increases the nuclear translocation of the p50 and p65 subunits of NF-KB in Purkinje neurons and glial cells, which is prevented by infliximab. Analysis of NF-kB in neurons was performed by immunofluorescence using antibodies against the p50 (a) and p65 (b) subunits of NF-kB (green staining). Nuclei were stained blue with DAPI. The nuclear/cytoplasmic ratios of p50 (c) and p65 (e) and the proportion of cells containing p50 in the nucleoli (d) are quantified. To analyze the nuclear translocation of NF-kB in glial cells, double immunofluorescence was performed for NF-kB p50 (green in f and red in g) and Iba-1, a microglial marker (red in F), or GFAP, an astroglial marker (green in g). The merged images show the colocalization of these proteins (yellow). The number of microglia (H) and astrocytes (i) expressing nuclear p50 was quantified. The values are the mean ± SEM of 3–4 rats per group. Values that were significantly different from those of the control rats are indicated by asterisks, and values that were significantly different from those of the HA VH rats are indicated by a. *p ≤ 0.05, **p ≤ 0.01, ***p < 0.001, a p < 0.05; aa p ≤ 0.01. C VH = vehicle-treated control rats, C INFLIX = control rats treated with infliximab, HA VH = vehicle-treated hyperammonemic rats, HA INFLIX = hyperammonemic rats treated with infliximab
Fig. 6
Fig. 6
TNF-a synthesis in the cerebellum is TRADD/RIP1/TRAF2 complex formation-dependent. Analysis of TNF-a expression and NF-kB p50 subunit nuclear translocation was performed in slices incubated with R7050 as described in the “Material and methods” section. The expression of TNF-a was reduced in neurons (a, d), microglia (Iba-1: red; TNF-a: green; b, e) and astrocytes (GFAP: green; TNF-a: red; c, e) in hyperammonemic rats after 30 min of incubation with R7050. These effects were due to a reduction in the nuclear NF-kB p50 in Purkinje neurons (f, i), microglia (g, k), and astrocytes (h, l). R7050 treatment also restored the nucleolar translocation of the p50 subunit in Purkinje neurons (j). The values are the mean ± SEM of 4 rats per group. Values that were significantly different from those of the control rats are indicated by asterisks, and values that were significantly different from those of the HA VH rats are indicated by a. + refers to microglia expressing TNF-a in HA VH rats vs microglia expressing TNF-a in C VH rats, # refers to astrocytes expressing TNF-a in HA VH rats vs microglia expressing TNF-a in HA + R7050 rats, and @ refers to astrocytes expressing TNF-a in HA VH rats vs astrocytes expressing TNF-a in HA + R7050 rats. One symbol indicates p ≤ 0.05, two symbols indicate p < 0.01, three symbols indicate p ≤ 0.001, and four symbols indicate p < 0.0001. C VH = cerebellar slices obtained from vehicle-treated control rats, C + R7050 = cerebellar slices obtained from control rats and incubated with R7050, HA VH = cerebellar slices obtained from vehicle-treated hyperammonemic rats, HA + R7050 = cerebellar slices obtained from hyperammonemic rats and incubated with R7050
Fig. 7
Fig. 7
TNF-a is increased in glial cells but not in Purkinje neurons after 2 weeks of hyperammonemia. An increase in TNF-a was observed in glial cells (white matter, b, e) but not in Purkinje neurons (a, d). Double immunofluorescence confirmed the presence of TNF-a in microglia (c) and astrocytes (d), and the proportion of these cells expressing TNF-a was quantified (f). To investigate the contribution of the nuclear translocation of NF-kB to TNF-a synthesis, immunofluorescence for the p50 subunit was performed in the Purkinje layer, and representative images are shown in g (green staining) and quantified in j. Double immunofluorescence was also performed for NF-kB p50 (green in h and red in i) and Iba-1, a microglial marker (red in h) or GFAP, an astroglial marker (green in i). The merged image shows the colocalization of these proteins (yellow). The number of microglia and astrocytes expressing nuclear p50 are quantified in k and l, respectively. The values are the mean ± SEM of 3 rats per group. Values that were significantly different from those of the control rats are indicated by asterisks. *p ≤ 0.05, **p ≤ 0.051, ****p ≤ 0.0001. ++ refers to microglia expressing TNF-a in HA VH rats vs microglia expressing TNF-a in C VH rats (p < 0.01) and ## refers to astrocytes expressing TNF-a in HA VH rats vs astrocytes expressing TNF-a in C VH rats (p < 0.01). C VH = vehicle-treated control rats, HA VH = vehicle-treated hyperammonemic rats
Fig. 8
Fig. 8
Analysis of the TNF-a-TNFR1-NF-κB pathway after 2 weeks of hyperammonemia. The effects of R7050 treatment on TNF-a expression in microglia (a, c) and astrocytes (b, d) and on NF-kB p50 nuclear translocation in Purkinje neurons (e, h), microglia (f, i) and astrocytes (g, j) after 2 weeks of hyperammonemia are shown. The values are the mean ± SEM of 3 rats per group. Values that were significantly different from those of the control rats are indicated by asterisks, and values that were significantly different from those of HA VH rats are indicated by a. *p ≤ 0.05, **p ≤ 0.01, a < 0.05, and aa p ≤ 0.01. C VH = cerebellar slices obtained from vehicle-treated control rats; C + R7050 = cerebellar slices obtained from control rats and incubated with R7050; HA VH = cerebellar slices obtained from vehicle-treated hyperammonemic rats, HA + R7050 = cerebellar slices obtained from hyperammonemic rats and incubated with R7050
Fig. 9
Fig. 9
TNF-a and nuclear NF-kB are not increased in hyperammonemic rats at 1 week. Representative images of TNF-a expression and nuclear NF-kB in Purkinje neurons (a, f, respectively), microglia (b, g, respectively), and astrocytes (c, h, respectively) are shown. The content of TNF-a and the nuclear/cytoplasmic ratio of the p50 subunit of NF-kB are quantified in d and i, respectively. e The percentage of microglia vs astrocytes expressing TNF-a. The numbers of microglia and astrocytes expressing nuclear p50 are quantified in j and k, respectively. C VH = vehicle-treated control rats, HA VH = vehicle-treated hyperammonemic rats
Fig. 10
Fig. 10
Microglia and astrocytes are already activated after only 1 week of hyperammonemia. Representative images of microglial (a, c) and astrocyte activation (e) in the white matter of the cerebellum are shown. The perimeter of microglial cells (b), cells expressing CD68 (d), and the GFAP-stained area (f) was evaluated. The values are the mean ± SEM of 3 rats per group. Values that were significantly different from those of the control rats are indicated by asterisks. *p < 0.05, **p < 0.01, and ****p < 0.0001. C VH = vehicle-treated control rats, HA VH = vehicle-treated hyperammonemic vehicle rats
Fig. 11
Fig. 11
TNF-a is increased in the Purkinje neurons of patients who die with liver cirrhosis. Representative images of Purkinje cells expressing TNF-a are shown in a and b and quantified in c. The values are the mean ± SEM of 3–4 subjects per group. Values that were significantly different from those of the control rats are indicated by asterisks. *p < 0.05
Fig. 12
Fig. 12
Proposed mechanisms by which chronic hyperammonemia increases TNF-a in neurons and glial cells. a Chronic hyperammonemia induces the activation of microglia and astrocytes in the white matter of the cerebellum. Activated glial cells increase the nuclear translocation of NF-kB, which induces the transcription of pro-inflammatory TNF-a. Glial TNF-a binds to the TNFR1 receptor in Purkinje cells, leading to the activation of the NF-kB pathway and TNF-a synthesis in these neurons. b Peripheral treatment with infliximab reduces glial cell activation and TNF-a synthesis, which prevents the activation of the NF-KB pathway and TNF-a synthesis in Purkinje neurons. Finally, ex vivo treatment of cerebellar slices from hyperammonemic rats with R7050 shows that TNF-a synthesis in glial cells and neurons is mediated by the activation of the TNFR1-TRAD/RIP1-NF-κB pathway

References

    1. Felipo V. Hepatic encephalopathy: effects of liver failure on brain function. Nat Rev Neurosci. 2013;14:851–858. doi: 10.1038/nrn3587. - DOI - PubMed
    1. Shawcross DL, Davies NA, Williams R, Jalan R. Systemic inflammatory response exacerbates the neuropsychological effects of induced hyperammonemia in cirrhosis. J Hepatol. 2004;40:247–254. doi: 10.1016/j.jhep.2003.10.016. - DOI - PubMed
    1. Montoliu C, Piedrafita B, Serra MA, del Olmo JA, Urios A, Rodrigo JM, et al. IL-6 and IL-18 in blood may discriminate cirrhotic patients with and without minimal hepatic encephalopathy. J Clin Gastroenterol. 2009;43:272–279. doi: 10.1097/MCG.0b013e31815e7f58. - DOI - PubMed
    1. Felipo V, Urios A, Montesinos E, Molina I, Garcia-Torres ML, Civera M, et al. Contribution of hyperammonemia and inflammatory factors to cognitive impairment in minimal hepatic encephalopathy. Metab Brain Dis. 2012;27:51–58. doi: 10.1007/s11011-011-9269-3. - DOI - PubMed
    1. Cabrera-Pastor A, Arenas YM, Taoro-Gonzalez L, Montoliu C, Felipo V. Chronic hyperammonemia alters extracellular glutamate, glutamine and GABA and membrane expression of their transporters in rat cerebellum. Modulation by extracellular cGMP. Neuropharmacology. 2019; - PubMed

MeSH terms

Substances

LinkOut - more resources