. 2020 Feb 22;12(1):20.
doi: 10.1186/s13073-020-0719-6.

Cell-free DNA analysis reveals POLR1D-mediated resistance to bevacizumab in colorectal cancer

Affiliations

Cell-free DNA analysis reveals POLR1D-mediated resistance to bevacizumab in colorectal cancer

Qing Zhou et al. Genome Med. .

Abstract

Background: Bevacizumab, a monoclonal antibody against soluble VEGFA, is an approved and commonly administered anti-angiogenic drug in patients with metastasized colorectal cancer (mCRC). The survival benefit of anti-VEGF therapy in mCRC patients is limited to a few months, and acquired resistance mechanisms are largely unknown. Here, we employed whole-genome sequencing of plasma DNA to evaluate the tumor genome of patients undergoing treatment with bevacizumab to determine novel aberrations associated with resistance.

Methods: Using longitudinal plasma analyses, we studied the evolution of tumor genomes in a mCRC cohort (n = 150) and conducted analyses of CRC cases from The Cancer Genome Atlas (TCGA) database (n = 619) to identify associations between genomic aberrations and clinical features. We employed whole-genome sequencing to identify the most frequently occurring focal somatic copy number alterations (SCNAs). Using the TCGA data as a comparative and supporting dataset, we defined the minimally amplified overlapping region and studied the mechanistic consequences of copy number gain of the involved genes in this segment. In addition, we established an in vitro cell model and conducted downstream gene expression and cell viability assays to confirm our findings from the patient dataset.

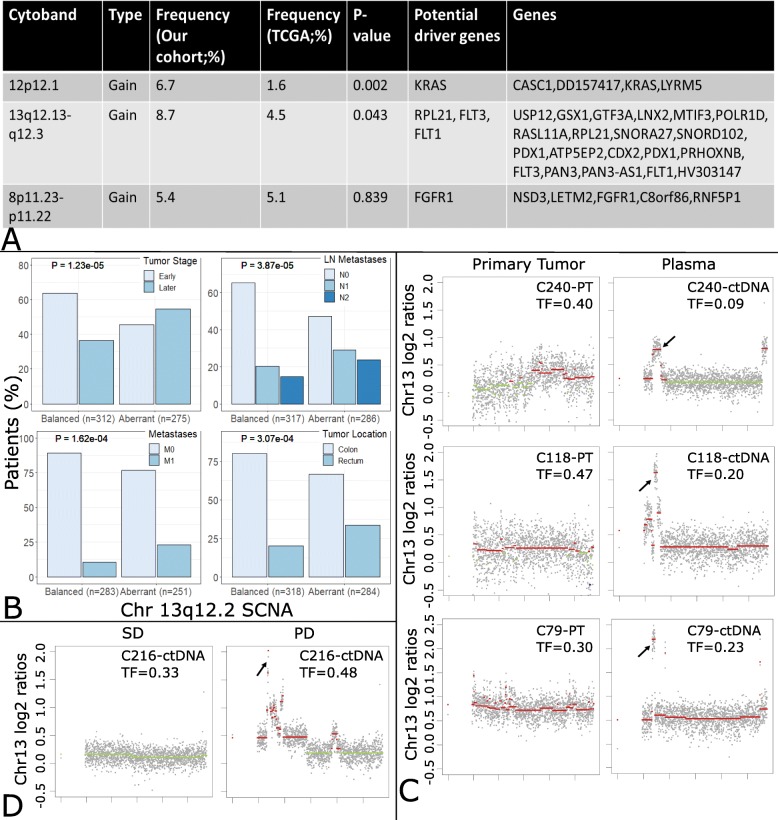
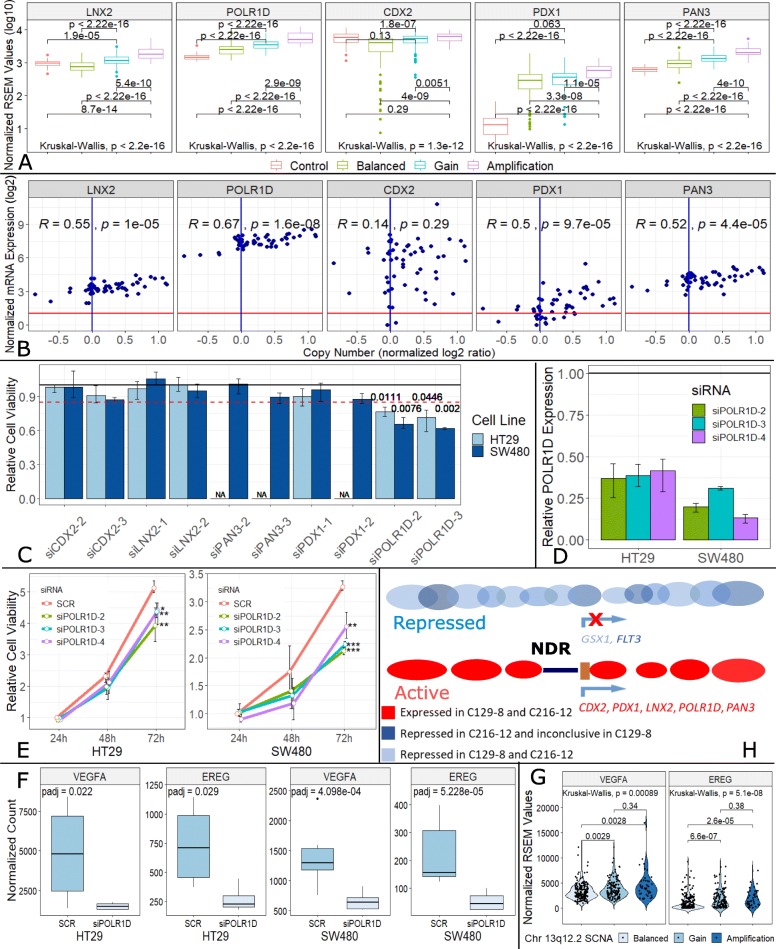
Results: We observed a recurrent focal amplification (8.7% of cases) on chromosome 13q12.2. Analysis of CRC cases from the TCGA database suggested that this amplicon is associated with more advanced stages. We confirmed that this 13q12.2 amplicon frequently emerges later during the clinical course of disease. After defining the minimally amplified region, we observed that the amplification and expression of one gene, POLR1D, impacted cell proliferation and resulted in upregulation of VEGFA, an important regulator of angiogenesis which has been implicated in the resistance to bevacizumab treatment. In fact, in several patients, we observed the emergence of this 13q12.2 amplicon under bevacizumab treatment, which was invariably associated with therapy resistance.

Conclusions: Non-invasive analyses of cell-free DNA from patients undergoing treatment with bevacizumab enabled the tracking of evolving tumor genomes and helped identify a recurrent focal SCNA of clinical relevance. Here, we describe a novel resistance mechanism against a widely applied treatment in patients with mCRC which will impact the clinical management of patients.

Keywords: Bevacizumab; Cell-free DNA; POLR1D; Precision medicine; Therapy resistance; Whole-genome sequencing.


Conflict of interest statement

PU is employed by Freenome. The remaining authors declare that they have no competing interests.

Figures

Fig. 1
Fig. 1
Identification of the 13q amplicon and establishment as a late event in CRC. a Recurrent focal events from our patient cohort with a frequency higher than 5%. Potential driver genes were identified according to a machine learning-based method for driver gene prediction [46]. The difference in these 3 recurrent focal events between our cohort and the TCGA cohort was analyzed using the chi-squared test. b The TCGA cohort was separated into 2 groups, i.e., balanced and aberrant (including gain and amplification cases). Bar charts illustrate 4 clinical features, i.e., tumor stage, distant metastasis, lymph node metastasis, and tumor location, which showed significant differences between these 2 groups. p values were calculated using the chi-squared test. c, d Plots illustrating the log2 ratio changes on chromosome 13. In C240, C118, and C79, focal amplification of chr13q12.2 was not identified in the primary tumor (PT) but found in the plasma (ctDNA) at a later stage. In C216, chr13q12.2 amplification was detected when the patient status was categorized as progressive disease. Copy number gains are shown in red and balanced regions in green. Tumor fraction (TF) of every sample was calculated using ichorCNA [43]. (SD, stable disease; PD, progressive disease)
Fig. 2
Fig. 2
Exclusion of FLT3 as a driver gene. a Box plot showing no significant correlation between FLT3 gene copy number and FLT3 mRNA expression (log10 (normalized RSEM value + 1)) in the TCGA cohort. Control/matched normal tissue, n = 51; Balanced, n = 196; Gain, n = 129; Amplification, n = 46. b The scatter plot illustrates no correlation in FLT3 copy number and FLT3 mRNA expression (log2 (TPM + 1)) in 58 CRC cell lines (R = − 0.41, p = 0.0016; Pearson). The red line represents the noise threshold (TPM = 1). c Colony formation assay showing significant overexpression of FLT3 in OXCO-2 cells (p = 0.03433; t test) but no significant changes in proliferation (p = 0.1866; t test)
Fig. 3
Fig. 3
Expression analyses for identification of the potential driver gene in the 13q12.2 amplicon. a Box plots showing significant positive correlation between gene copy number and mRNA expression (log10 (normalized RSEM value + 1)) in 5 genes (i.e., LNX2, POLR1D, CDX2, PDX1, and PAN3) in the TCGA cohort. Control/matched normal tissue, n = 51; Balanced, n = 196; Gain, n = 129; Amplification, n = 46. b Scatter plots illustrating positive correlation in gene copy number and mRNA expression (log2 (TPM + 1)) in 5 genes (i.e., LNX2, POLR1D, CDX2, PDX1, and PAN3) in 58 CRC cell lines. R values and p values were calculated using Pearson’s correlation test. The red line represents the noise threshold (TPM = 1). c The bar chart illustrates cell viability changes after knockdown of 5 genes (i.e., CDX2, LNX2, PAN3, PDX1, and POLR1D) in 2 CRC cell lines (i.e., HT29 and SW480). Silencing of POLR1D in both cell lines showed reduction in cell viability over 15%. p values calculated by t test are shown above the bar. d Silencing of POLR1D with 3 different siRNA constructs. RT-PCR showing that silencing provided sufficient knockdown of POLR1D expression in both cell lines. e Cell viability time curve illustrating significant reduction of cell viability after knockdown of POLR1D expression in HT29 and SW480 cells (*p < 0.1; **p < 0.05; ***p < 0.01; t test). f Box plot illustrating the different expression (normalized DESeq2 read count) of VEGFA and EREG between negative control (SCR, a scrambled siRNA) and POLR1D knockdown in SW480 (SCR, n = 6; siPOLR1D2, n = 3; siPOLR1D3, n = 3) and HT29 (SCR, n = 4; siPOLR1D2, n = 2; siPOLR1D3, n = 2) cell lines. VEGFA and EREG expression was suppressed after POLR1D silencing. Adjusted p values were calculated by DESeq2, an R package. g Violin plots of VEGFA and EREG expression (normalized RSEM value) of TCGA cases. Samples with chr13q12.2 gain (n = 129) or amplification (n = 46) showed a significant upregulation compared to balanced cases (n = 196). h Schematic presentation how nucleosome organization around promoters of repressed and active genes differ in their promoter regions. Promoters of active genes have a nucleosome-depleted region (NDR, dark blue line), whereas the nucleosome organization of promoters of repressed genes is not well-defined, resulting in different nucleosome footprints at transcription start sites. We leveraged these differences by employing our previously published nucleosome positioning [38] to determine the expression status of genes within the 13q12.2 amplicon. In addition to the genes discussed in the text, we added the gene GSX1 (light blue) as an example for a repressed gene (part of the figure adapted from [49])
Fig. 4
Fig. 4
Emergence of the 13q12 amplicon under bevacizumab treatment in patient C216. a Genome-wide log2 ratio plots of plasma samples from C216 obtained before bevacizumab treatment (upper), after 227 days of bevacizumab treatment (middle), and after 285 days of bevacizumab treatment (bottom). The insets illustrate the respective tumor fraction (TF) for each analysis and enlarged log2 ratio plots of chromosome 13, the bottom 2 samples show gain of chromosome 13, with the highest copy number gain on chr13q12.2, the region that harbors the POLR1D gene. Copy number gains are shown in red, balanced regions in green, and copy number losses in blue. b Plot illustrating all time points of blood collection and relative marker changes. Red line: POLR1D copy number changes identified by digital PCR, showing minimum changes until day 227. Blue line: blood CEA level changes. Black line: blood CA19-9 level changes. Gray bar: tumor content identified in every sample using ichorCNA. c Four CT images obtained in 4 different time points, i.e., day 10, day 152, day 222, and day 276 after bevacizumab treatment. Compared to the first image, no significant changes were identified on day 152, during which the patient had been evaluated to have stable disease in accordance with the RECIST criteria. On day 222, the pre-present liver metastasis lesions enlarged with occurrence of new micrometastasis lesions. On day 276, all livers metastasis lesions had become larger
Fig. 5
Fig. 5
Alternating POLR1D and ERBB2 amplifications in serial plasma analyses of patient C129. a Genome-wide log2 ratio plots of plasma samples from C129 obtained before treatment with cetuximab (first), 160 days (second) after cetuximab, before bevacizumab (third), and 138 days (fourth) after bevacizumab. The insets illustrate the respective tumor fraction (TF) for each analysis and enlarged log2 ratio plots of chromosome 13 and 17, the first and the last sample showing gain of chromosome 13, with the highest copy number on chr13q12.2, the region harboring POLR1D. The middle 2 samples show a gain of chromosome 17 with the highest copy number on chr17q12, harboring ERBB2. The copy number color code is as in Fig. 4. b Plot illustrating blood collection time points. Red line: POLR1D copy number changes measured by dPCR. A decrease in POLR1D copy number was detected until day 274 during cetuximab treatment. After switching to bevacizumab, POLR1D copy number increased back within 138 days. Green line: ERBB2 copy number changes (dPCR). ERBB2 copy number increased until day 274 (during cetuximab treatment). After switching to bevacizumab, ERBB2 copy number decreased back within 138 days. Blue line: CEA levels decreased in the first 3 samples and slightly increased in the fourth sample. After a slight decrease in the fifth sample, CEA continuously increased up until the last sample. Black line: CA 19-9 remained at low levels across all samples. Gray bar: tumor fraction estimated with ichorCNA. c Four CT images obtained on day 6 and day 212 of cetuximab treatment, before bevacizumab treatment (day 268), and 160 days after bevacizumab treatment (day 434). No significant changes were identified on day 212, consistent with stable disease. On day 268, the pre-present lung metastasis lesion became larger in the right lung and pleural effusion appeared in the left lung, indicating progressive disease. On day 434, this pre-present lesion became larger and new metastasis lesions appeared. Pleural effusion increased, and progressive disease was designated

References

    1. Siegel RL, Miller KD, Jemal A. Cancer statistics, 2019. CA Cancer J Clin. 2019;69:7–34. doi: 10.3322/caac.21551. - DOI - PubMed
    1. Ferlay J, Steliarova-Foucher E, Lortet-Tieulent J, Rosso S, Coebergh JW, Comber H, et al. Cancer incidence and mortality patterns in Europe: estimates for 40 countries in 2012. Eur J Cancer. 2013;49:1374–1403. doi: 10.1016/j.ejca.2012.12.027. - DOI - PubMed
    1. DeSantis CE, Lin CC, Mariotto AB, Siegel RL, Stein KD, Kramer JL, et al. Cancer treatment and survivorship statistics, 2014. CA Cancer J Clin. 2014;64:252–271. doi: 10.3322/caac.21235. - DOI - PubMed
    1. Saltz LB, Meropol NJ, Loehrer PJS, Needle MN, Kopit J, Mayer RJ. Phase II trial of cetuximab in patients with refractory colorectal cancer that expresses the epidermal growth factor receptor. J Clin Oncol. 2004;22:1201–1208. doi: 10.1200/JCO.2004.10.182. - DOI - PubMed
    1. Reissfelder C, Timke C, Schmitz-Winnenthal H, Rahbari NN, Koch M, Klug F, et al. A randomized controlled trial to investigate the influence of low dose radiotherapy on immune stimulatory effects in liver metastases of colorectal cancer. BMC Cancer. 2011;11:419–2407. doi: 10.1186/1471-2407-11-419. - DOI - PMC - PubMed

Publication types

MeSH terms

Substances