. 2020 Jun:139:104819.
doi: 10.1016/j.nbd.2020.104819. Epub 2020 Feb 20.

Directional deep brain stimulation leads reveal spatially distinct oscillatory activity in the globus pallidus internus of Parkinson's disease patients

Affiliations

Directional deep brain stimulation leads reveal spatially distinct oscillatory activity in the globus pallidus internus of Parkinson's disease patients

Joshua E Aman et al. Neurobiol Dis. 2020 Jun.

Abstract

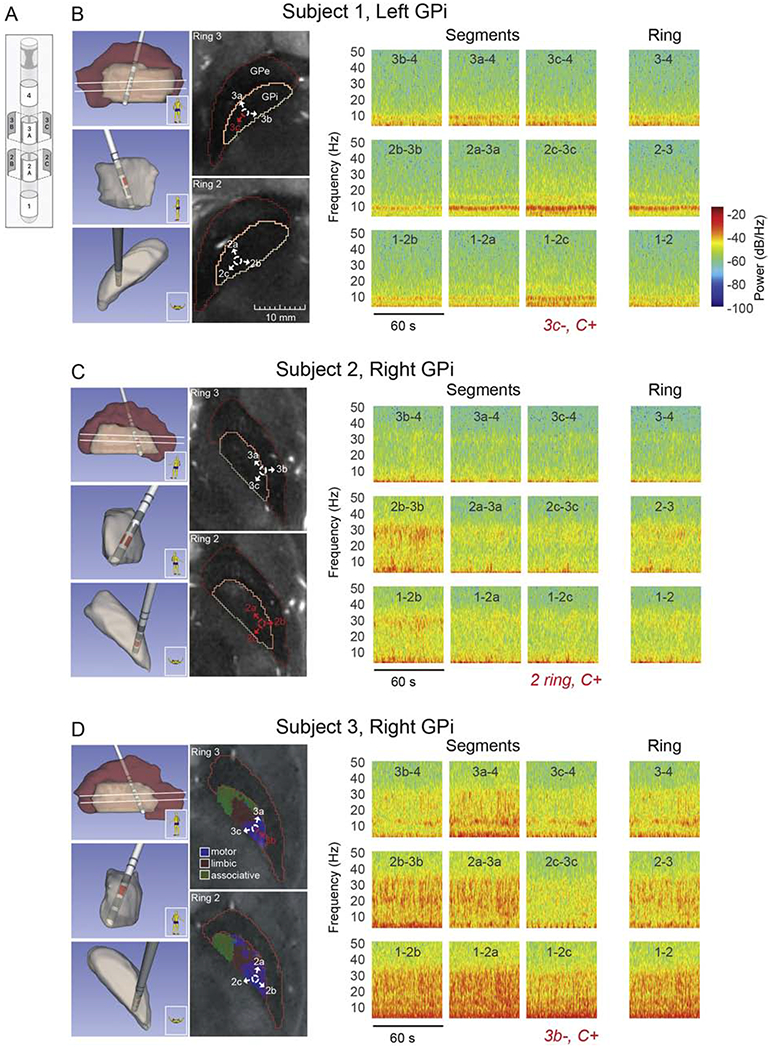
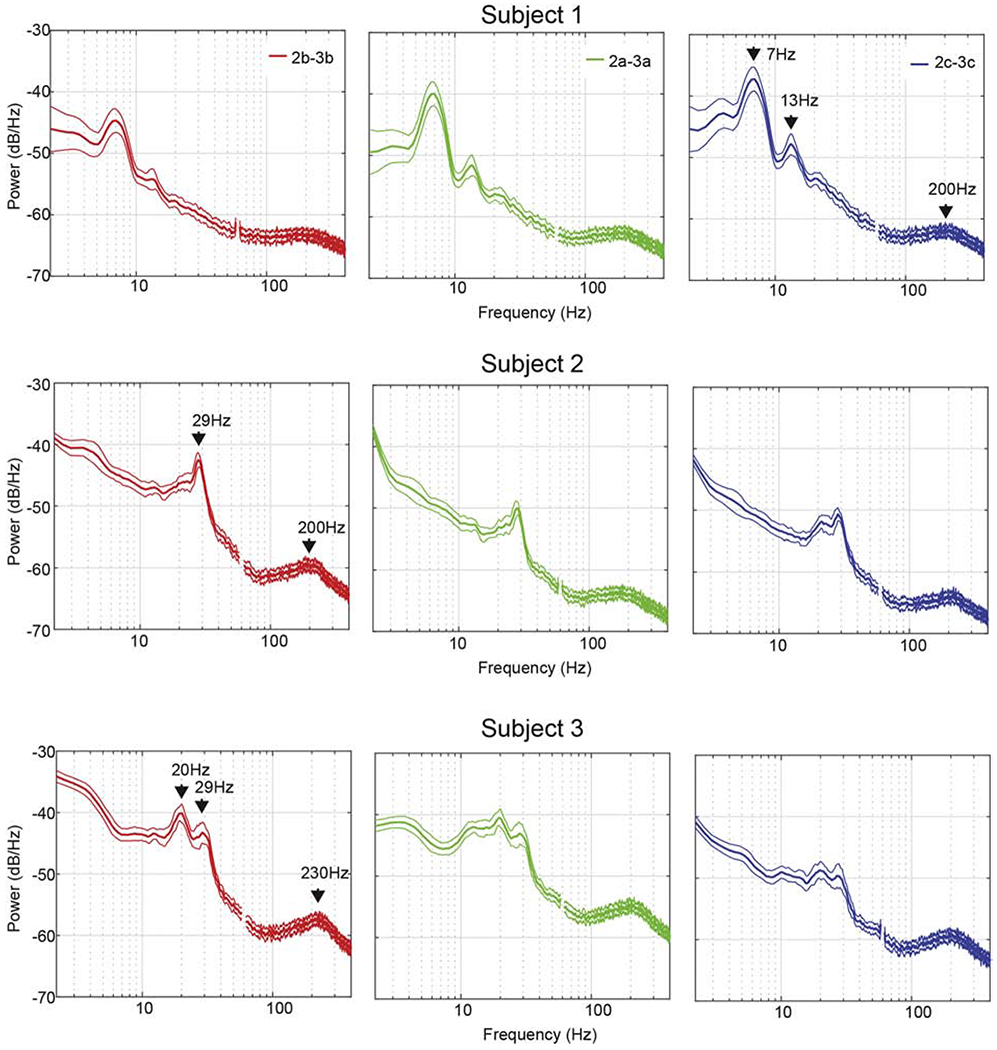
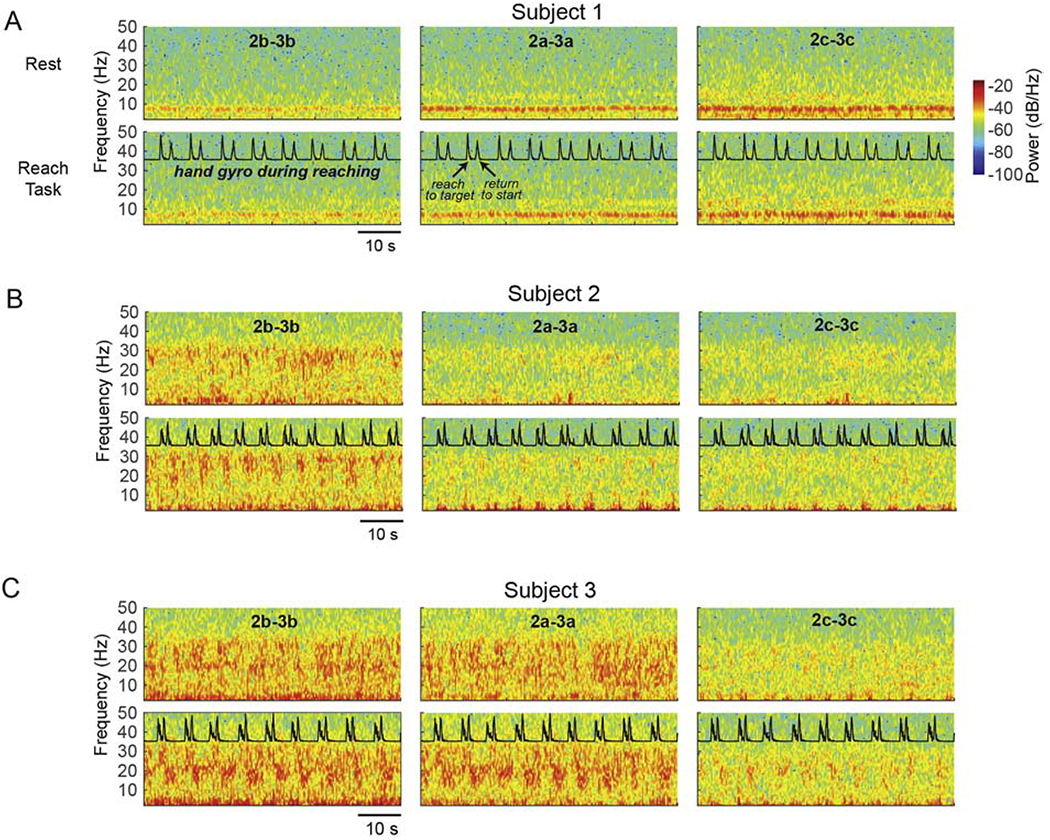
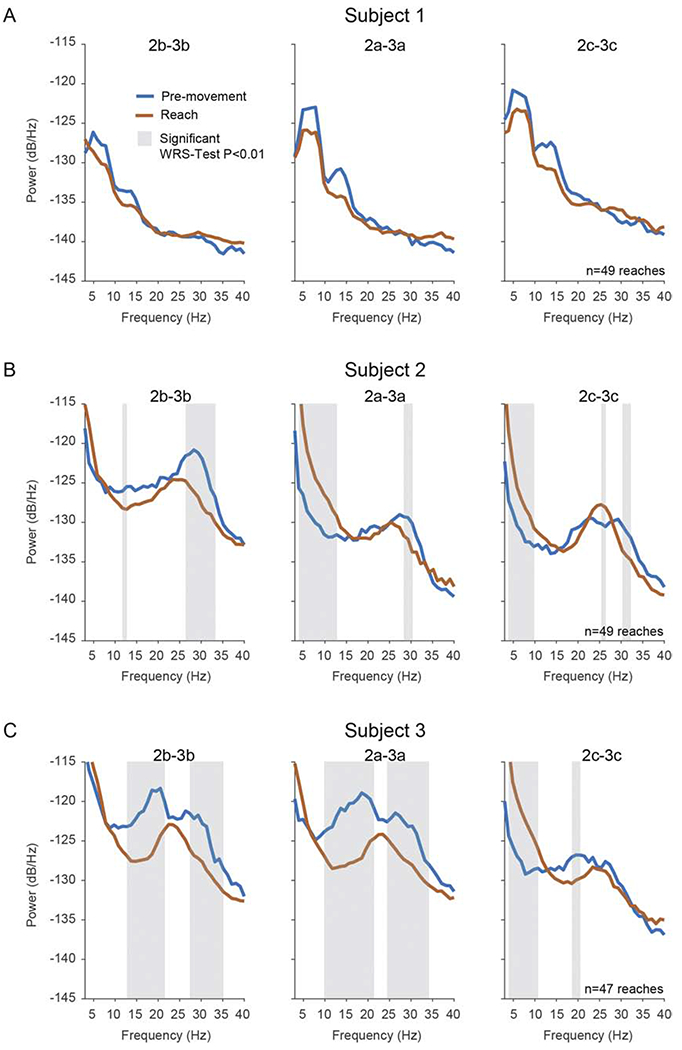
The goal of this study was to characterize the spectral characteristics and spatial topography of local field potential (LFP) activity in the internal segment of the globus pallidus (GPi) in patients with Parkinson's disease utilizing directional (segmented) deep brain stimulation (dDBS) leads. Data were collected from externalized dDBS leads of three patients with idiopathic Parkinson's disease after overnight withdrawal of parkinsonian medication at rest and during a cued reach-to-target task. Oscillatory activity across lead contacts/segments was examined in the context of lead locations and contact orientations determined using co-registered preoperative 7 Tesla (T) MRI and postoperative CT scans. Each of the three patients displayed a unique frequency spectrum of oscillatory activity in the pallidum, with prominent peaks ranging from 5 to 35 Hz, that modulated variably across subjects during volitional movement. Despite subject-specific spectral profiles, a consistent finding across patients was that oscillatory power was strongest and had the largest magnitude of modulation during movement in LFPs recorded from segments facing the postero-lateral "sensorimotor" region of GPi, whereas antero-medially-directed segmented contacts facing the internal capsule and/or anterior GPi, had relatively weaker LFP power and less modulation in the 5 to 35 Hz. In each subject, contact configurations chosen for clinically therapeutic stimulation (following data collection and blinded to physiology recordings), were in concordance with the contact pairs showing the largest amplitude of LFP oscillations in the 5-35 Hz range. Although limited to three subjects, these findings provide support for the hypothesis that the sensorimotor territory of the GPi corresponds to the site of maximal power of oscillatory activity in the 5 to 35 Hz and provides the greatest benefit in motor signs during stimulation in the GPi. Variability in oscillatory activity across patients is likely related to Parkinson's disease phenotype as well as small differences in recording location (i.e. lead location), highlighting the importance of lead location for optimizing stimulation efficacy. These data also provide compelling evidence for the use of LFP activity for the development of predictive stimulation models that may optimize patient benefits while reducing clinic time needed for programming.

Keywords: DBS; GPi; Local field potential; Parkinson's disease; Segmented.


Figures

Figure 1.
Figure 1.. DBS Lead locations and Local Field Potential Topography. [Color; 2-column fitting]
Local field potential recordings in the pallidum of three DBS patients using directional DBS leads. (A) Schematic of Abbott Infinity DBS segmented lead (image courtesy Abbott). (B) (left panel) Lead and pallidal reconstruction based on pre-operative 7T MRI and post-operative CT scans for subject 1. Sagittal, coronal, and axial views of 3-D reconstructions are shown (top to bottom, respectively). Two axial MRI slices at the levels of segmented contacts (rings 2 and 3, white lines in sagittal 3-D reconstruction) are also shown along with identification of GPi and GPe borders. Labeled arrows corresponding to contact segments have been added to aid visualization of lead orientation. All axial MRI images in panels (B-D) are presented at the same size scale, (right panel) Spectrograms over 60 seconds of spontaneous, resting state LFP activity, comparing directional sensing using segments and ring recordings. The DBS montage selected in clinic during the patient’s initial programming visit is shown in red italics. For example ‘3c−, C+’ is monopolar stimulation configuration with segment 3c as the cathode and the battery case as the anode. These settings were chosen by the movement disorder clinician per their standard of care and were blinded to the physiological recordings presented here. Active segments are also indicated in red in lead location reconstructions and axial MR images. (C,D) Same as in panel B, for subjects 2 and 3, respectively. The axial MRI slices in panel D also include parcellations of motor (blue), associative (green), and limbic (red) territories estimated based on 7T diffusion MRI scans collected in this subject.
Figure 2.
Figure 2.. Resting State Power Spectral Density Plots. [1.5 column-fitting]
Power spectral density (PSD) plots of local field potential recorded from the pallidum of three DBS patients. PSD plots were generated from spectrograms calculated over 5 minutes of continuously recorded data collected at rest. Spectrograms were divided into 15-second segments, averaged over time, and the resulting 20 PSD traces were averaged. Mean +/− 2SD are shown. Data presented here are from vertically adjacent segment pairs from rings 2 and 3 (e.g. 2a-3a). For visualization purposes, data points between 58 and 62 Hz (corrupted by line noise) were excluded. For each subject, salient peaks in the PSD were identified and labeled on the plots identified as having the highest peak in oscillatory power in the 5-35 Hz range.
Figure 3.
Figure 3.. Resting State and Reach Task Spectrogram Plots. [color; 2 column-fitting]
Reach task-related changes in oscillatory activity in the GPi. (A) Spectrograms over 60 seconds in two conditions in subject 1: rest (top row), touchscreen reaching task (second row; normalized gyroscope trace collected from a Delsys IMU sensor is overlaid). Each column represents a bipolar configuration using the vertically adjacent segments of rings 2 and 3 (e.g. 2a-3a), with the same behavioral data overlaid in each column for visualization. (B,C) Same as in (A) for subjects 2 and 3, respectively. All plots have the same color scale as in panel (A).
Figure 4.
Figure 4.. Power Spectral Density Plots of Resting State Compared to Reach Task. [color; 1.5 column-fitting]
The effects of movement on spectral power in the 3-40Hz range in the GPi (A) Median PSDs in pre-movement and reach conditions in subject 1. Reach PSDs were calculated during a time period centered at maximal reach velocity (see Methods); pre-movement PSDs were calculated from a time period prior to reaching while the patient maintained a resting position on the startpad. Each column represents a bipolar configuration using the vertically adjacent segments of ring 2 and 3 (e.g. 2a-3a). Shaded regions indicate significant differences between PSDs based on the Wilcoxon rank-sum (WRS) test (p=0.01) corrected for multiple comparisons. Two consecutive bins had to pass the WRS-test for a difference to be considered significant.

References

    1. AuYong N, Malekmohammadi M, Ricks-Oddie J, Pouratian N, 2018. Movement-Modulation of Local Power and Phase Amplitude Coupling in Bilateral Globus Pallidus Interna in Parkinson Disease. Front. Hum. Neurosci 12 10.3389/fnhum.2018.00270 - DOI - PMC - PubMed
    1. Baker KB, Lee JYK, Mavinkurve G, Russo GS, Walter B, DeLong MR, Bakay RAE, Vitek JL, 2010. Somatotopic organization in the internal segment of the globus pallidus in Parkinson’s disease. Exp. Neurol 222, 219–225. 10.1016/j.expneurol.2009.12.030 - DOI - PMC - PubMed
    1. Bokil H, Andrews P, Kulkarni JE, Mehta S, Mitra PP, 2010. Chronux: A platform for analyzing neural signals. J. Neurosci. Methods 192, 146–151. 10.1016/j.jneumeth.2010.06.020 - DOI - PMC - PubMed
    1. Brown P, 2003. Oscillatory nature of human basal ganglia activity: relationship to the pathophysiology of Parkinson’s disease. Mov. Disord. Off. J. Mov. Disord. Soc 18, 357–363. 10.1002/mds.10358 - DOI - PubMed
    1. Duchin Y, Abosch A, Yacoub E, Sapiro G, Harel N, 2012. Feasibility of Using Ultra-High Field (7 T) MRI for Clinical Surgical Targeting. PLOS ONE 7, e37328 10.1371/journal.pone.0037328 - DOI - PMC - PubMed

Publication types