. 2020 Apr;75(4):1063-1071.
doi: 10.1161/HYPERTENSIONAHA.119.14294. Epub 2020 Feb 24.

Altered Gut Microbiome Profile in Patients With Pulmonary Arterial Hypertension

Affiliations

Altered Gut Microbiome Profile in Patients With Pulmonary Arterial Hypertension

Seungbum Kim et al. Hypertension. 2020 Apr.

Abstract

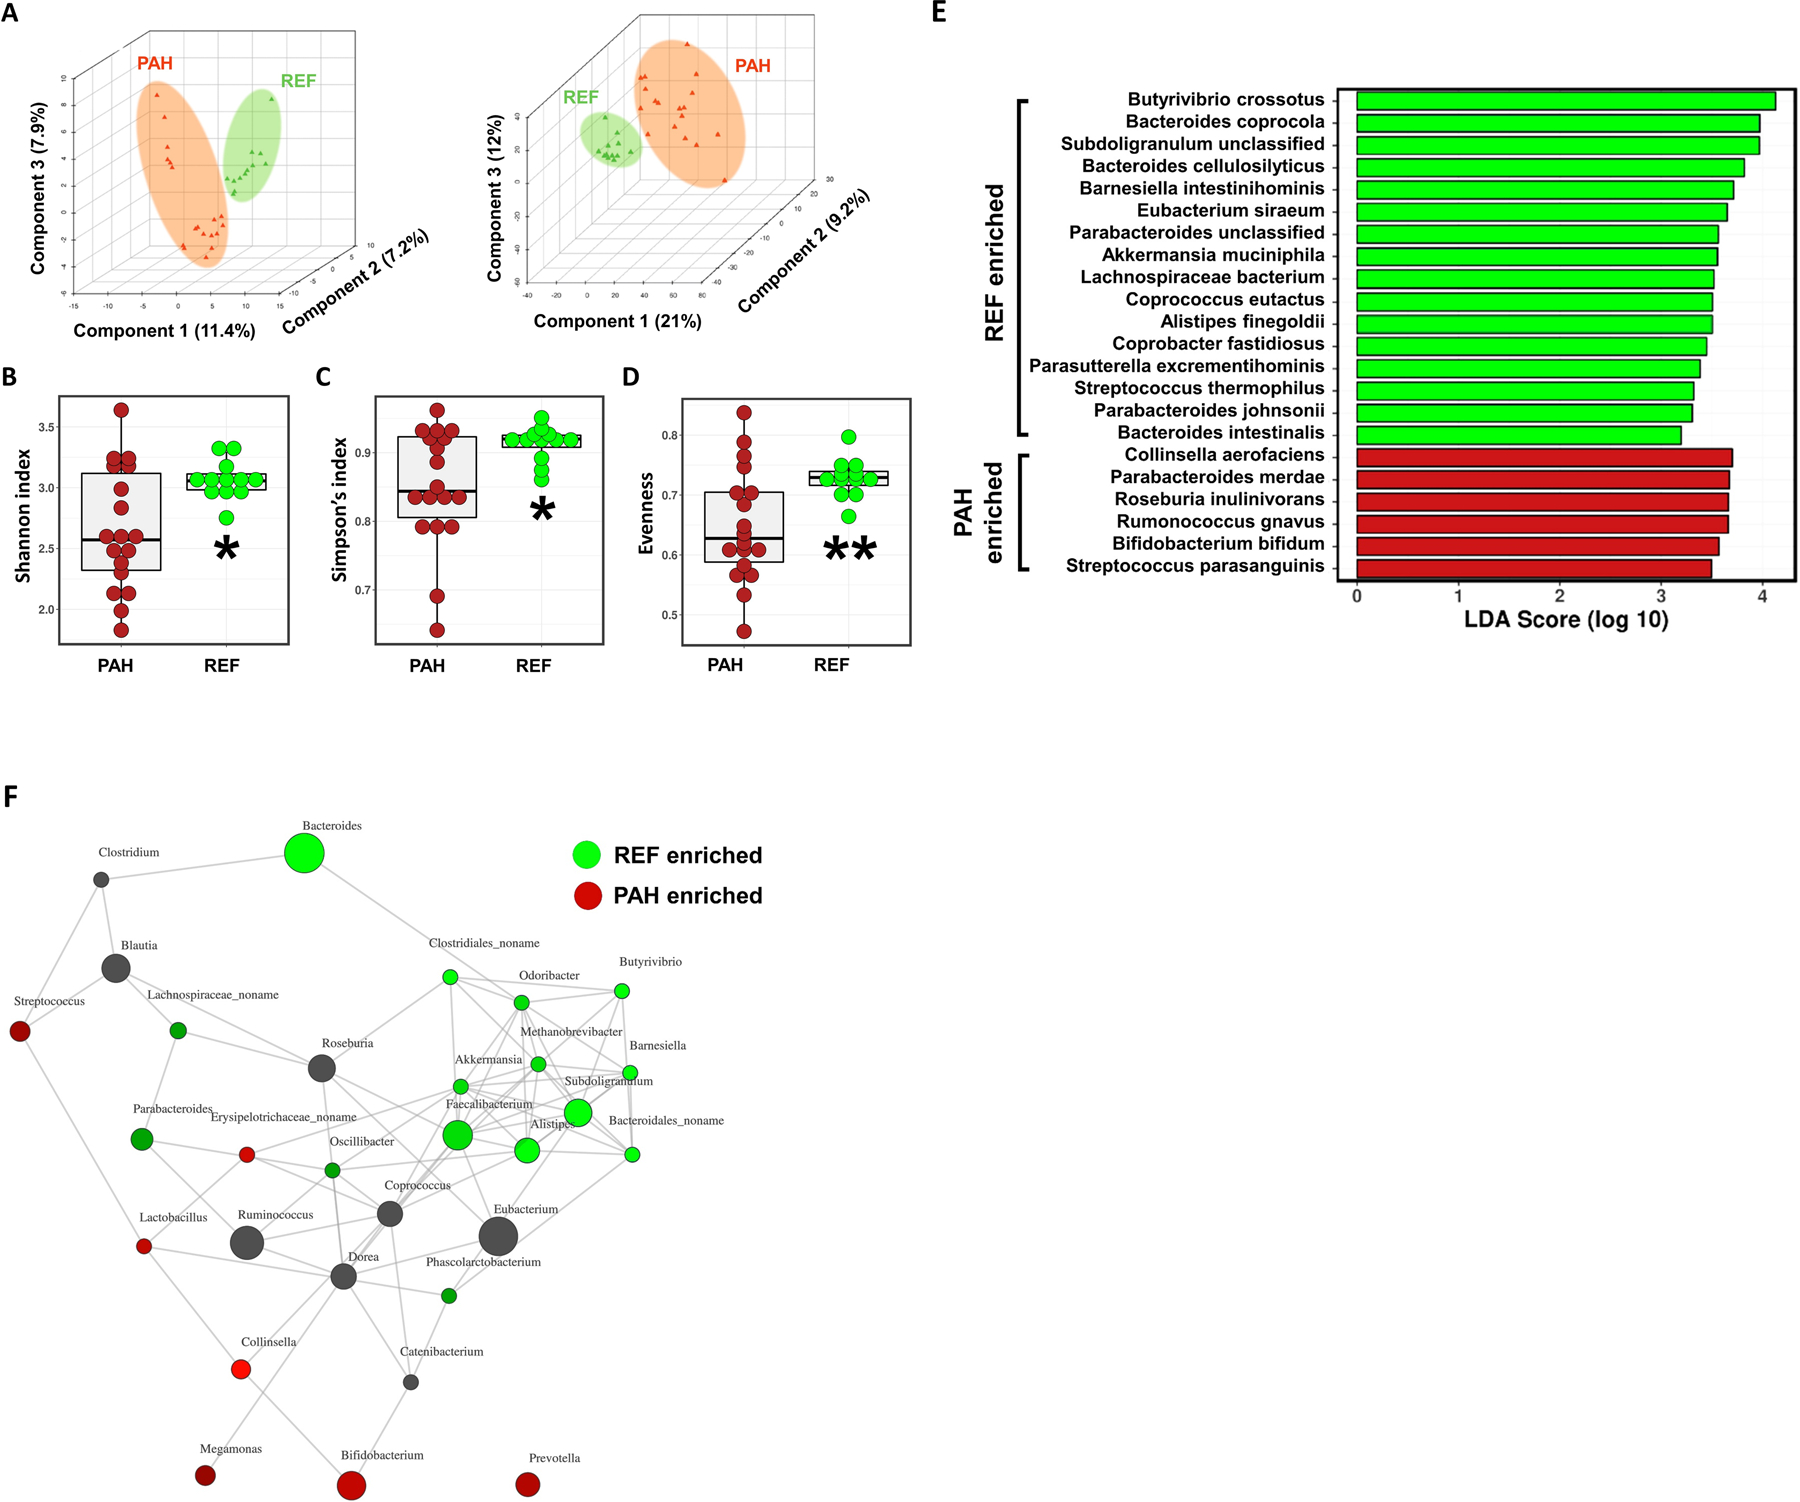
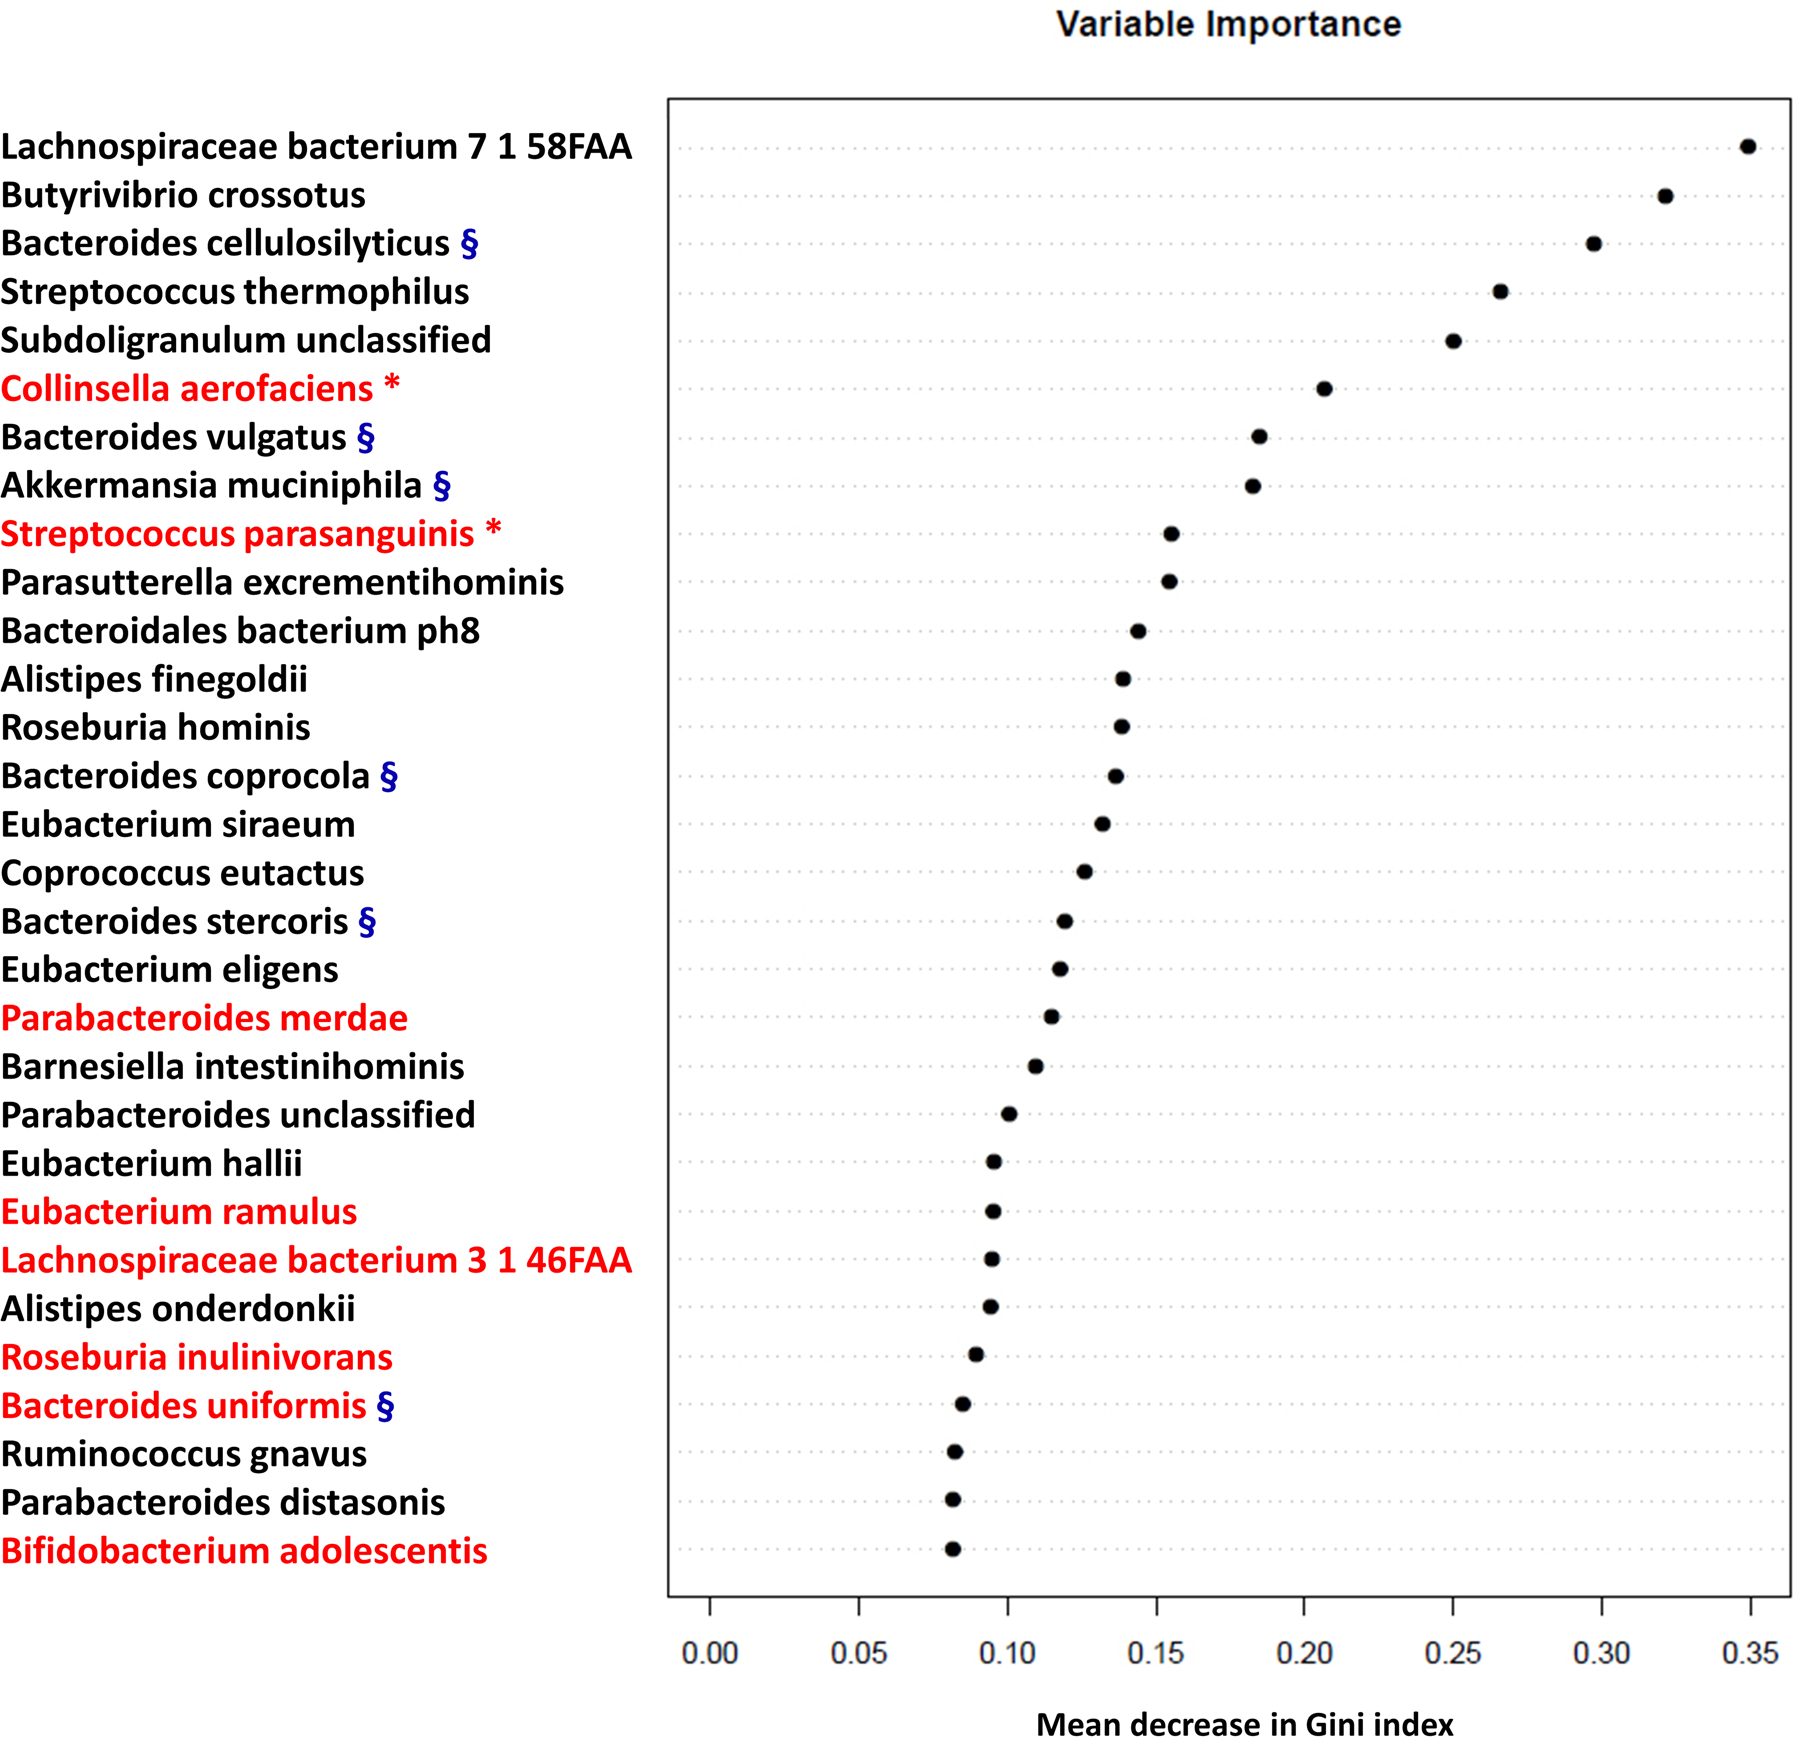
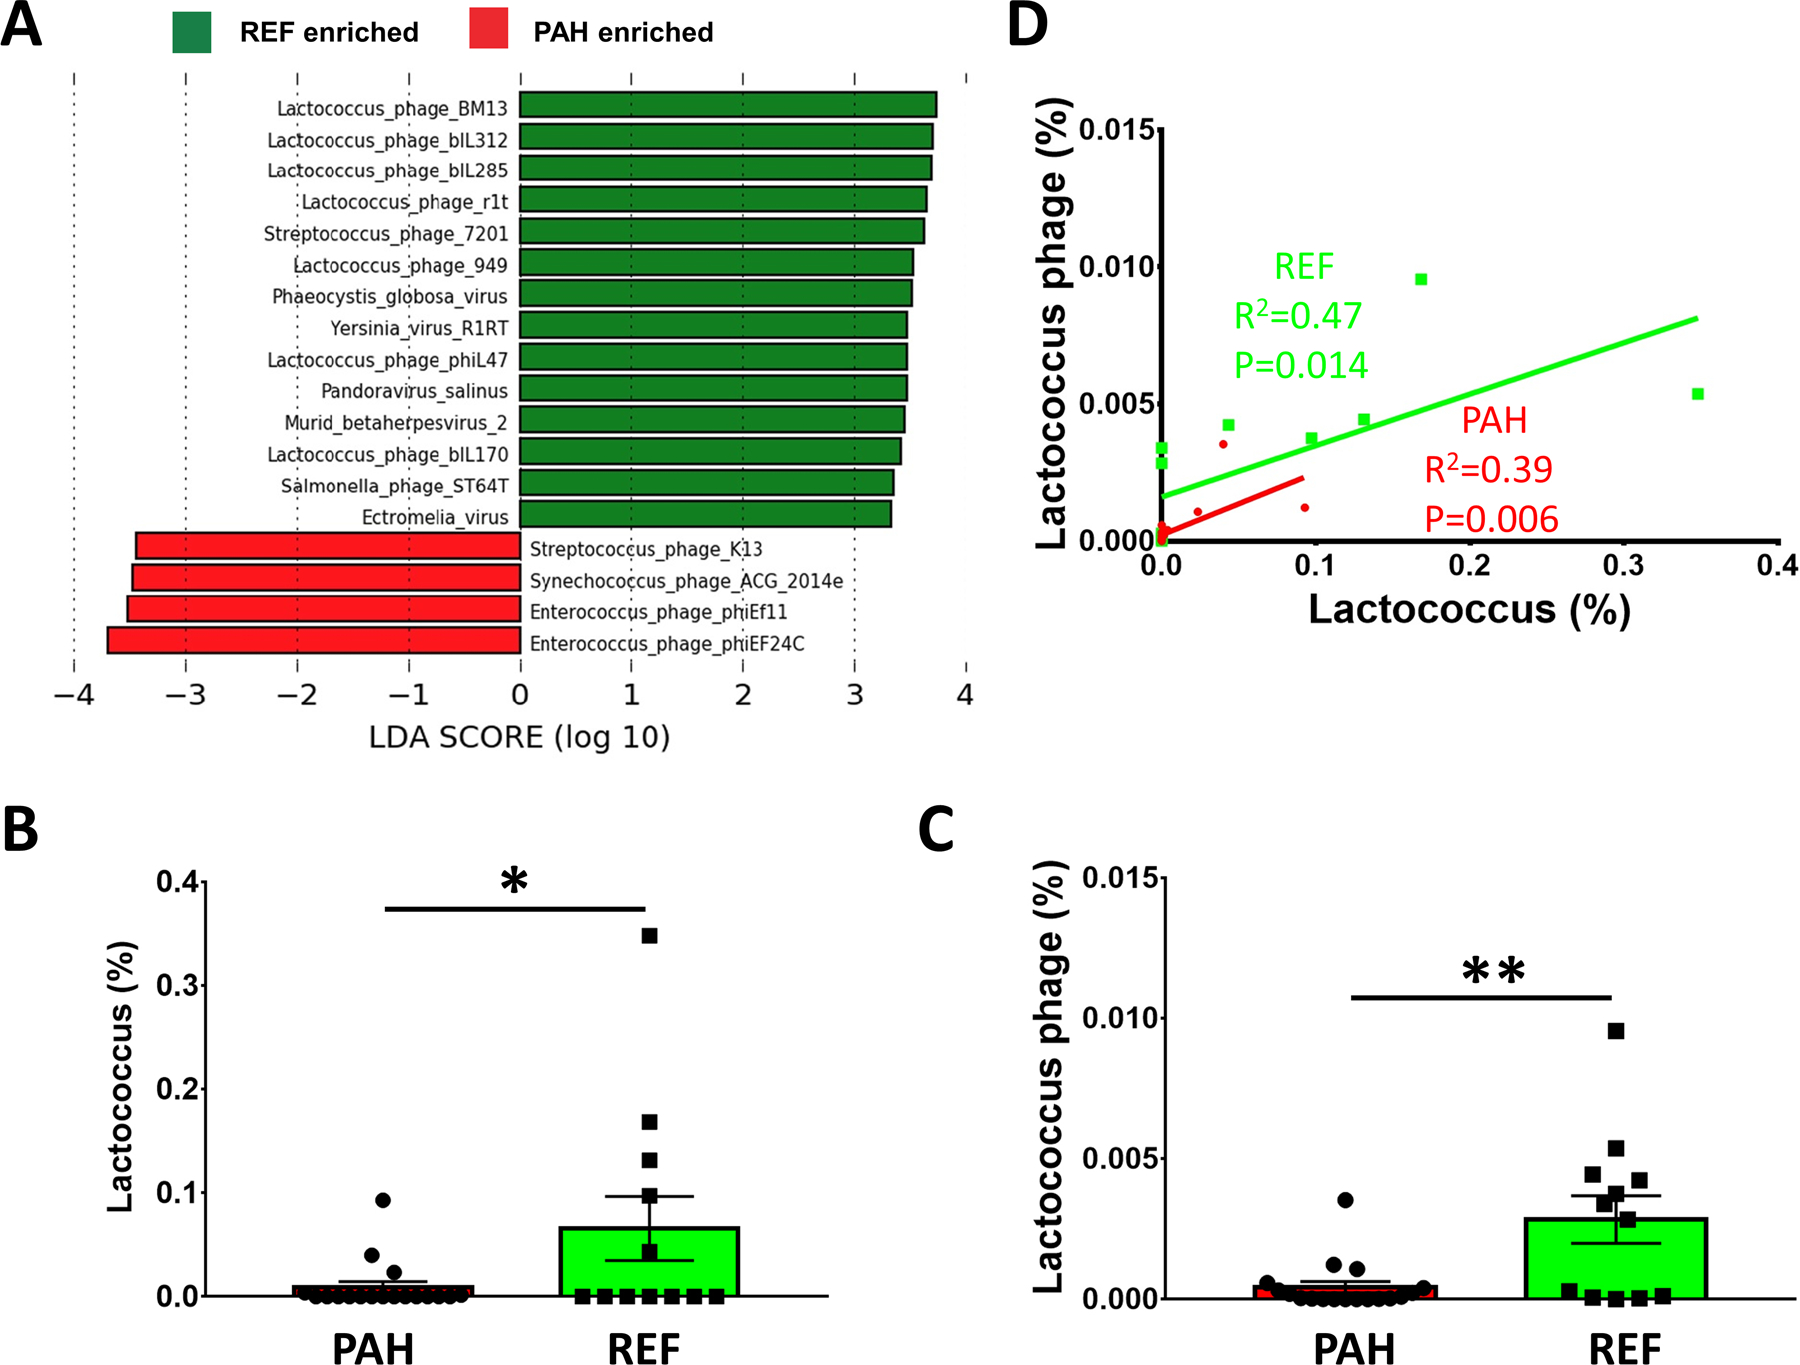
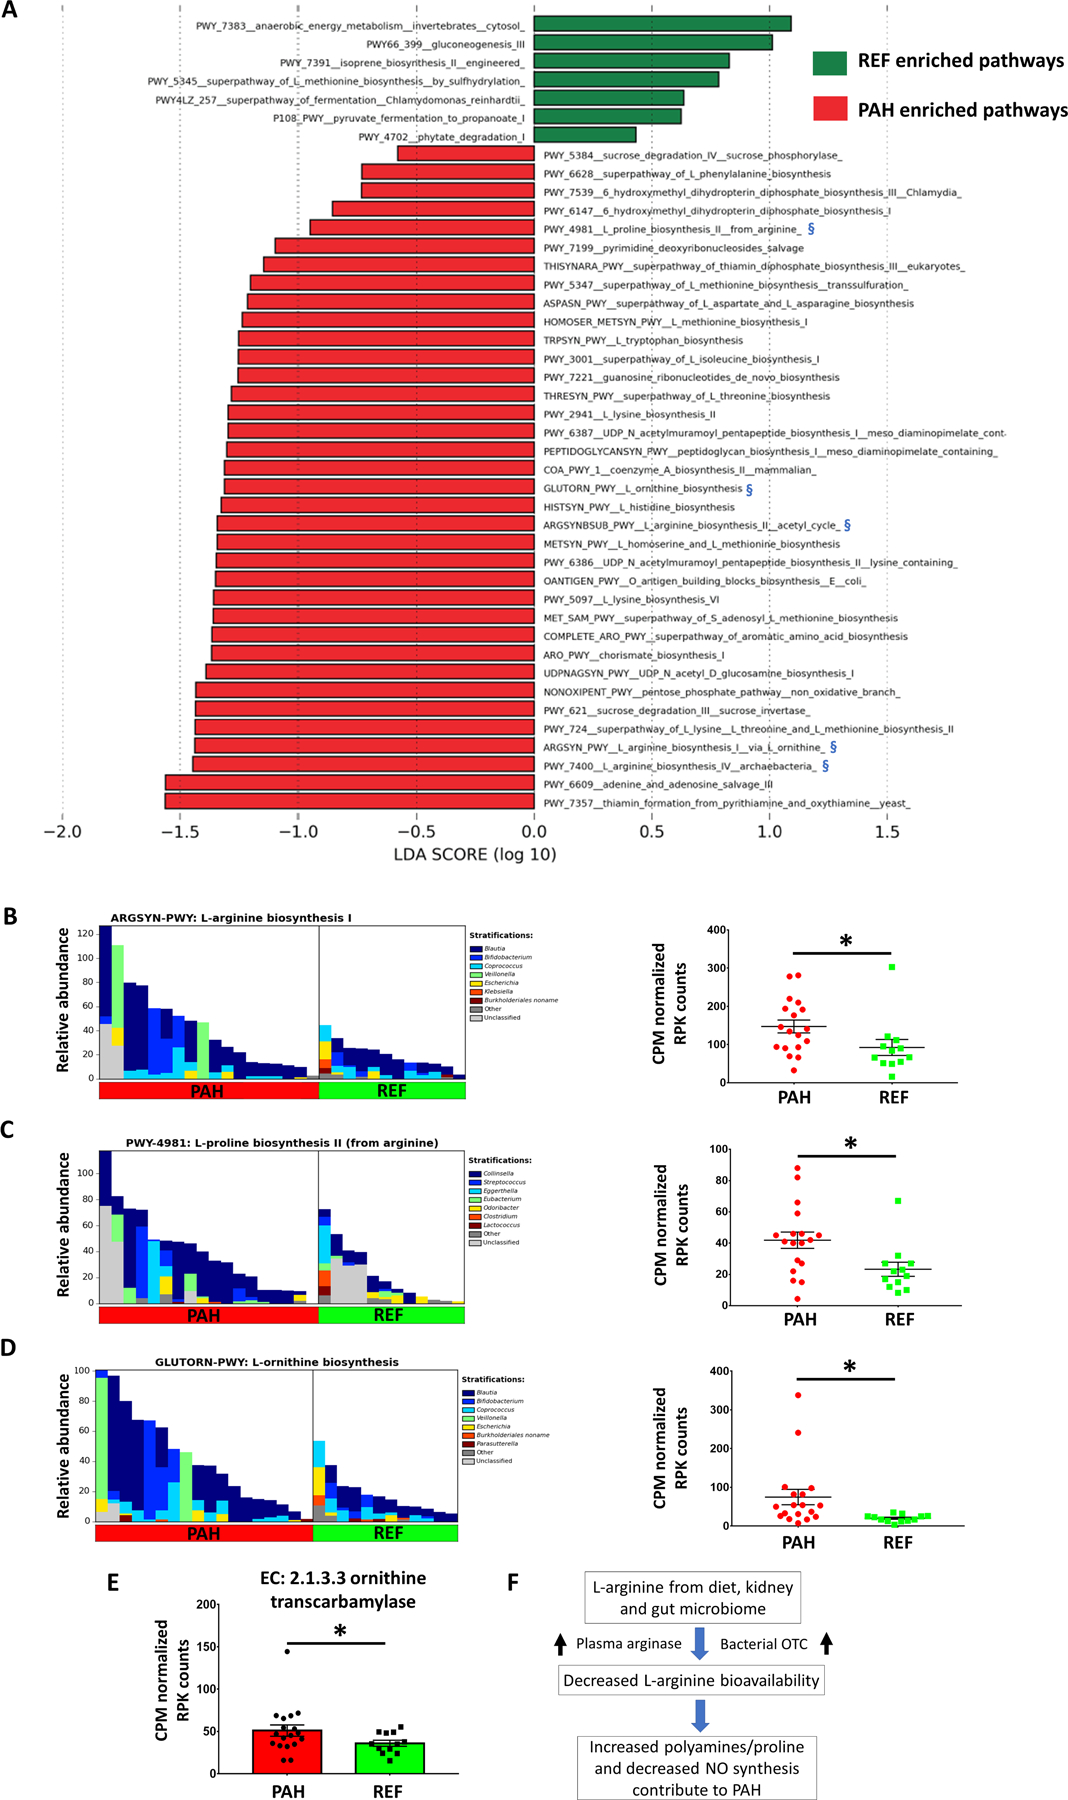
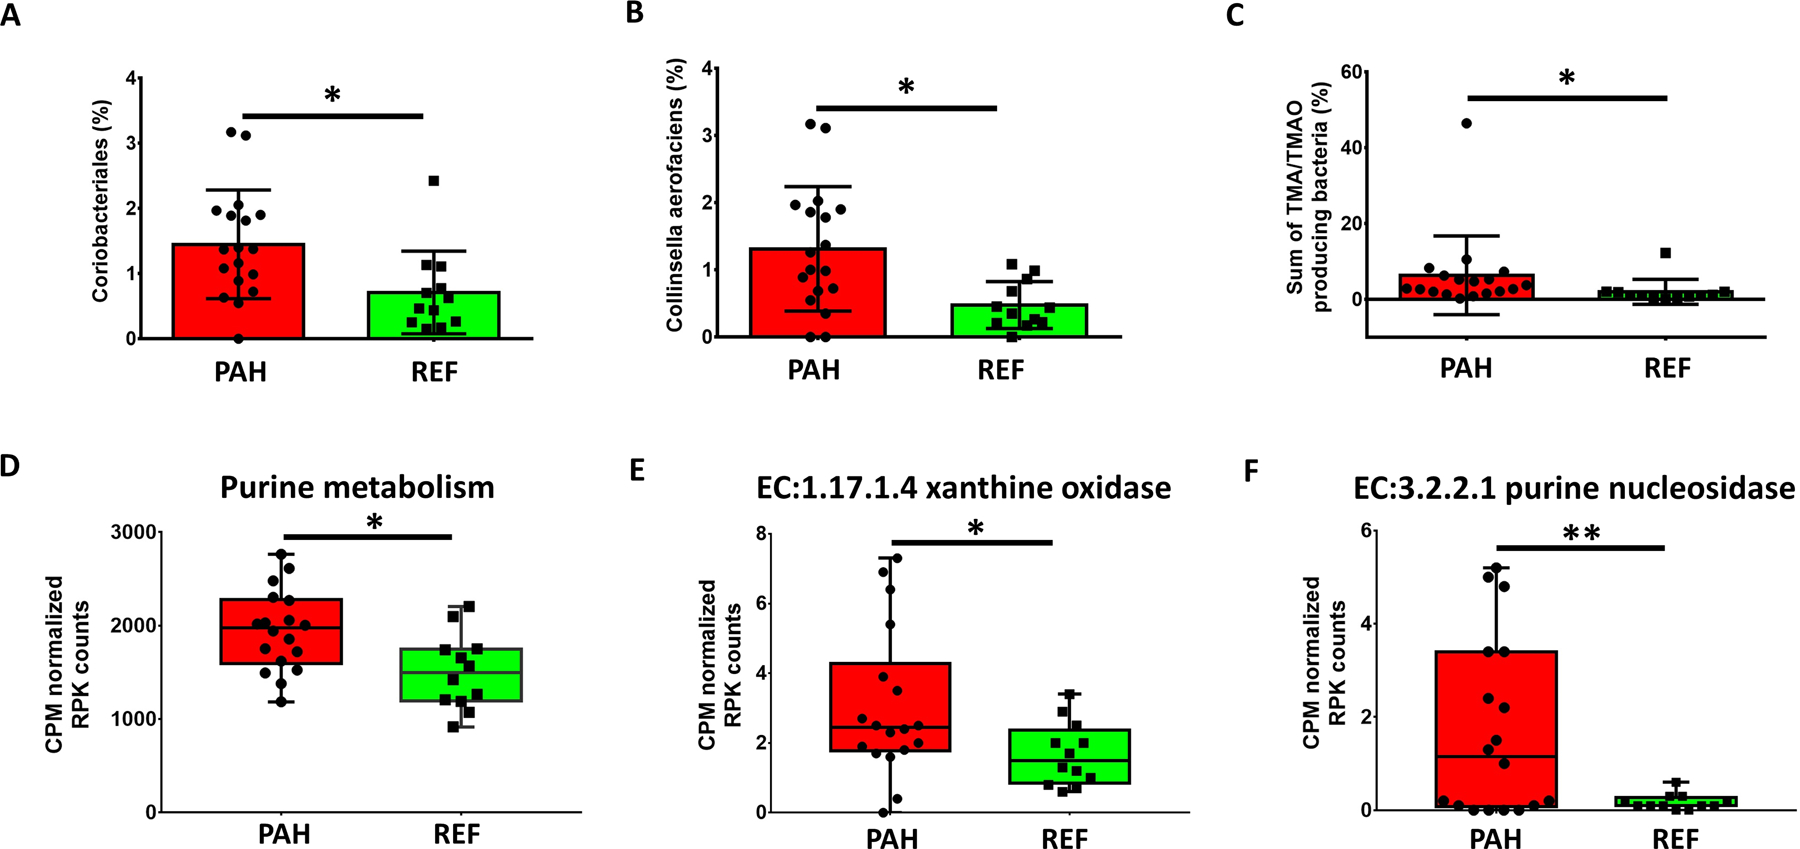
Pulmonary arterial hypertension (PAH) is considered a disease of the pulmonary vasculature. Limited progress has been made in preventing or arresting progression of PAH despite extensive efforts. Our previous studies indicated that PAH could be considered a systemic disease since its pathology involves interplay of multiple organs. This, coupled with increasing implication of the gut and its microbiome in chronic diseases, led us to hypothesize that patients with PAH exhibit a distinct gut microbiome that contributes to, and predicts, the disease. Fecal microbiome of 18 type 1 PAH patients (mean pulmonary arterial pressure, 57.4, SD 16.7 mm Hg) and 13 reference subjects were compared by shotgun metagenomics to evaluate this hypothesis. Significant taxonomic and functional changes in microbial communities in the PAH cohort were observed. Pathways for the synthesis of arginine, proline, and ornithine were increased in PAH cohort compared with reference cohort. Additionally, groups of bacterial communities associated with trimethylamine/ trimethylamine N-oxide and purine metabolism were increased in PAH cohort. In contrast, butyrate-and propionate-producing bacteria such as Coprococcus, Butyrivibrio, Lachnospiraceae, Eubacterium, Akkermansia, and Bacteroides were increased in reference cohort. A random forest model predicted PAH from the composition of the gut microbiome with 83% accuracy. Finally, virome analysis showed enrichment of Enterococcal and relative depletion of Lactococcal phages in the PAH cohort. In conclusion, patients with PAH exhibit a unique microbiome profile that has the high predictive potential for PAH. This highlights previously unknown roles of gut bacteria in this disease and could lead to new therapeutic, diagnostic, or management paradigms for PAH.

Keywords: bacteroides; eubacterium; metagenomics; pulmonary arterial hypertension; trimethylamine.


Figures

Figure 1:
Figure 1:. Altered gut microbiota composition in type 1 pulmonary arterial hypertensive patients.
(A) Partial least squares discriminant analyses (PLS-DA) were conducted to compare the overall differences in taxonomy (left) and functional gene (KEGG Orthology) profiles (right) between the reference (REF) and pulmonary arterial hypertension (PAH) cohorts. (B-D) Alpha diversity measures showed significantly reduced Shannon and Simpson indices and evenness of fecal bacterial populations of PAH patients compared to age- and gender-matched healthy REF subjects. Student’s t-test was used to compare the means of the two groups. (E) Linear discriminant analysis effect size (LEfSe) of each cohort to visualize differences in bacterial species. (F) A network plot showing positive interactions (connected lines, distance determined from the Bray-Curtis method) between genera. Genera associated with the REF cohort were marked in green, genera enriched in PAH cohort in red and neutral genera in black in the nodes.
Figure 2:
Figure 2:. Random forest modeling identified a subset of taxa predictive of distinguishing REF (black) and PAH (red) cohorts.
The 30 most important predictors of PAH vs. REF were ranked by Gini index determined from the random forest algorithm trained to distinguish the two cohorts. The taxa are ranked from top to bottom by decreasing Gini index scores. Since Gini index scores quantify the strength of each respective predictor, the best predictors of PAH are at the top of the plot. Bacteria with the red asterisk are positively correlated with TMA/TMAO production. Bacteria with the blue § are negatively correlated with TMA/TMAO production, .
Figure 3:
Figure 3:. Significantly increased viral species and specific viruses in PAH (red) or REF (green) cohorts.
(A) LEfSe determined differential virus species in the gut microbiome. (B) Relative abundance of Lactococcus lactis in PAH and REF cohorts. (C) Relative abundance of Lactococcus phage. (D) A graph of Lactococcus phage and its bacterial host (Lactococcus) indicates interactions tend to occur among distinct groups of phages and bacteria. Out of 18 PAH samples, neither Lactococcus nor Lactococcus phage was detected in 4 samples (22% of total samples). Pearson correlation coefficient excluding those samples was comparable and it was statistically significant (R=0.59, P=0.033). Data are expressed as mean ± standard error of the mean (*p < 0.05; **p < 0.01).
Figure 4:
Figure 4:. Functional changes of the gut microbiome and altered arginine metabolism in the PAH cohort.
(A) LEfSe of altered functional pathways of the microbiomes in PAH and REF cohorts. Biosynthesis of several amino acids was increased in PAH such as arginine, lysine, homoserine, methionine, ornithine and tryptophan. Arginine/proline/ornithine biosynthesis was increased in PAH microbiome and marked with blue symbols (§). (B) Genera contributing to L-arginine biosynthesis (left) and CPM normalized RPK counts for the respective pathway by MetaCyc analysis (right). (C) Genera contributing to L-proline biosynthesis (left) and CPM normalized RPK counts for the respective pathway (right). (D) Genera contributing to L-ornithine biosynthesis (left) and CPM normalized RPK counts for the respective pathway (right). (E) Ornithine transcarbamylase (OTC), which converts L-ornithine to L-citrulline, was significantly increased in PAH microbiome. (F) Schematic diagram of potential bacterial contribution to PAH pathogenesis. Along with increased plasma arginase, bacterial OTC may contribute to decreased arginine bioavailability in PAH.
Figure 5:
Figure 5:. Increase in TMA/TMAO-associated bacteria and purine metabolism- related enzymes in PAH microbiome.
(A, B) Relative abundance of Coriobacteriales and Collinsella aerofaciens, major TMATMAO producers, were significantly increased in PAH microbiota. (C) Sum of TMA/TMAO producing bacteria in each cohort. (D) Comparison of enzymes of purine metabolism in gut microbiome of PAH and REF cohorts. Summed CPM normalized RPK counts of KEGG Orthology in the purine metabolism pathway were analyzed using Pathview in R studio (E, F). Xanthine oxidase/dehydrogenase and purine nucleosidase were significantly increased in the PAH microbiome. A full heatmap of purine metabolism (KEGG) comparing REF and PAH enzyme abundances can be found in Figure S5. Bar graph data are expressed as mean ± standard deviation with p values (*p<0.05; **p<0.01). The boxes of the box-whisker plots extend from the 25th to 75th percentiles, medians are shown in the boxes as a line. Whiskers encompass the maximum and minimum values and individual values are superimposed on the graph.

References

    1. Fallah F. Recent strategies in treatment of pulmonary arterial hypertension, a review. Glob J Health Sci. 2015;7(4):307–322. - PMC - PubMed
    1. Gurtu V, Michelakis ED. A Paradigm Shift Is Needed in the Field of Pulmonary Arterial Hypertension for Its Entrance Into the Precision Medicine Era. Circ Res.119(12):1276–1279. - PubMed
    1. West J. Pulmonary arterial hypertension as a systemic disease. Advances in Pulmonary Hypertension. 2012;11(3):130–131.
    1. Tang WH, Hazen SL. The Gut Microbiome and Its Role in Cardiovascular Diseases. Circulation. 2017;135(11):1008–1010. - PMC - PubMed
    1. Marsland BJ, Trompette A, Gollwitzer ES. The Gut-Lung Axis in Respiratory Disease. Ann Am Thorac Soc. 2015;12 Suppl 2:S150–156. - PubMed

Publication types