. 2020 Apr;103(4):3577-3598.
doi: 10.3168/jds.2019-17708. Epub 2020 Feb 20.

Effects of colostrum instead of formula feeding for the first 2 days postnatum on whole-body energy metabolism and its endocrine control in neonatal calves

Affiliations

Effects of colostrum instead of formula feeding for the first 2 days postnatum on whole-body energy metabolism and its endocrine control in neonatal calves

W Liermann et al. J Dairy Sci. 2020 Apr.

Abstract

Colostrum provides high amounts of nutritive and non-nutritive substrates, which are essential for calf nutrition and passive immunization. Colostral growth factors and hormones have beneficial effects on postnatal maturation and may affect substrate utilization and energy expenditure in neonatal calves. We tested the hypothesis that energy metabolism and its endocrine regulation differ during the first 10 d of life in calves fed either colostrum or a milk-based formula with a similar nutrient composition to colostrum, but largely depleted of bioactive substances, for the first 2 d postnatum. Male Holstein calves (n = 18) were fed either pooled colostrum (COL; n = 9) or a milk-based formula (FOR; n = 9) for the first 2 d of life. From d 3 on, all calves received same milk replacer. On d 2 and 7 of life, calves were placed in a respiration chamber for indirect calorimetric measurements to calculate heat production, fat (FOX) and carbohydrate oxidation (COX), as well as respiratory quotient. Blood was sampled on d 1 before first colostrum intake and on d 2, 3, 7, 8, 9, and 10 before morning feeding, to measure plasma concentrations of immunoglobulins, metabolites, and hormones. Additional postprandial blood samples were taken on d 1 and 9 at 30, 60, 120, 240, and 420 min after milk feeding. Liver samples were collected on d 10 of life to determine gene expression related to energy metabolism. Formula-fed calves showed lower plasma concentrations of total protein, immunoglobulins, haptoglobin, leptin, adiponectin, and insulin-like growth factor (IGF) binding protein (IGFBP)-4 during the whole study but temporarily higher plasma concentrations of urea, insulin, glucagon, triglyceride, and cholesterol on the first day after feeding, compared with concentrations in COL. The temporary increase in glucagon, triglyceride, and cholesterol on d 1 reversed on d 2 or 3, showing higher concentrations in COL than in FOR calves. In FOR, IGF-I, IGFBP-2, and IGFBP-3 were lower on d 3 than in COL. Interestingly, FOR calves had higher heat production during respiratory measurements on d 2 and higher body temperature on d 2, 3, and 5 than those of COL. The hepatic mRNA abundance of cytosolic phosphoenolpyruvate carboxykinase was higher in FOR than in COL. Our results indicate that first milk feeding after birth influenced whole-body energy expenditure but not FOX and COX in neonatal calves, and the absorption of colostral leptin and adiponectin might affect insulin sensitivity on d 1 of life.

Keywords: biologically active substances; calf; colostrum; energy expenditure; energy metabolism.


Figures

Figure 1
Figure 1
Average daily rectal body temperature during the first 10 d of life in calves fed colostrum (COL, ○) or formula (FOR, △) for the first 2 d of life. Data are presented as least squares means ± SE (n = 9 per group); *designates significant differences between feeding groups (P < 0.05).
Figure 2
Figure 2
Pre- and postprandial plasma concentrations of total protein (A), IgG1 (B), IgG2 (C), IgM (D), haptoglobin (E), and urea (F) during the first 10 d of life in calves fed colostrum (COL, ○) or formula (FOR, △) for the first 2 d of life. Data are presented as least squares means ± SE (n = 9 per group); *designates significant differences between feeding groups (P < 0.05).
Figure 2
Figure 2
Pre- and postprandial plasma concentrations of total protein (A), IgG1 (B), IgG2 (C), IgM (D), haptoglobin (E), and urea (F) during the first 10 d of life in calves fed colostrum (COL, ○) or formula (FOR, △) for the first 2 d of life. Data are presented as least squares means ± SE (n = 9 per group); *designates significant differences between feeding groups (P < 0.05).
Figure 3
Figure 3
Pre- and postprandial plasma concentrations of glucose (A), insulin (B), glucagon (C), and the glucagon:insulin ratio (D) in blood plasma and plasma concentrations of cortisol (E) during the first 10 d of life in calves fed colostrum (COL, ○) or formula (FOR, △) for the first 2 d of life. Data are presented as least squares means ± SE (n = 9 per group); *designates significant differences between feeding groups (P < 0.05).
Figure 3
Figure 3
Pre- and postprandial plasma concentrations of glucose (A), insulin (B), glucagon (C), and the glucagon:insulin ratio (D) in blood plasma and plasma concentrations of cortisol (E) during the first 10 d of life in calves fed colostrum (COL, ○) or formula (FOR, △) for the first 2 d of life. Data are presented as least squares means ± SE (n = 9 per group); *designates significant differences between feeding groups (P < 0.05).
Figure 4
Figure 4
Pre- and postprandial plasma concentrations of nonesterified fatty acids (NEFA; A), triglycerides (B), and cholesterol (C) during the first 10 d of life in calves fed colostrum (COL, ○) or formula (FOR, △) for the first 2 d of life. Data are presented as least squares means ± SE (n = 9 per group); *designates significant differences between feeding groups (P < 0.05).
Figure 5
Figure 5
Pre- and postprandial plasma concentrations of IGF-I (A), leptin (B), and adiponectin (C) during the first 10 d of life in calves fed colostrum (COL, ○) or formula (FOR, △) for the first 2 d of life. Data are presented as the least squares means ± SE (n = 9 per group); *designates significant differences between feeding groups (P < 0.05).
Figure 6
Figure 6
Preprandial plasma concentrations of IGF binding protein (IGFBP)-2 (A), IGFBP-3 (B), and IGFBP-4 (C) during the first 10 d of life in calves fed colostrum (COL, ○) or formula (FOR, △) for the first 2 d of life. Data are presented as least squares means ± SE (n = 9 per group); *designates significant differences between feeding groups (P < 0.05).
Figure 7
Figure 7
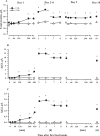
Pre- and postprandial plasma concentrations of noradrenaline (A) and adrenaline (B) on d 1 and 9 in calves fed colostrum (COL, ○) or formula (FOR, △) for the first 2 d of life. Data are presented as least squares means ± SE (n = 9 per group); *designates significant differences between feeding groups (P < 0.001).
Figure 8
Figure 8
Preprandial plasma concentrations of total triiodothyronine (T3, A) and thyroxine (T4, B) during the first 10 d of life in calves fed colostrum (COL, ○) or formula (FOR, △) for the first 2 d of life; data are presented as least squares means ± SE (n = 9 per group); *designates significant differences between feeding groups (P < 0.05).
Figure 9
Figure 9
Physical activity on d 2 and 3 and on d 7 and 8 of life of calves fed colostrum (COL, ○) or formula (FOR, Δ) for the first 2 d of life. Activity was measured in respiration chambers during respiratory measurements. Shaded areas indicate the dark periods. Arrows indicate times of feeding. Data are presented as least squares means ± SE (n = 9 per group).
Figure 10
Figure 10
Heat production (A), carbohydrate oxidation (B), fat oxidation (C), and respiratory quotient (D) on d 2 to 3 and 7 to 8 in calves fed colostrum (COL, ○) or formula (FOR, Δ) for the first 2 d of life. Shaded areas indicate the dark periods. Arrows indicate feeding times. Data are presented as least squares means ± SE (n = 9 per group); *designates significant differences between feeding groups (P < 0.05).

References

    1. Bagnell C.A., Bartol F.F. Review: Maternal programming of development in the pig and the lactocrine hypothesis. Animal. 2019;13:2978–2985. doi: 10.1017/S1751731119001654. - DOI - PubMed
    1. Barrington G.M., Parish S.M. Bovine neonatal immunology. Vet. Clin. North Am. Food Anim. Pract. 2001;17:463–476. doi: 10.1016/S0749-0720(15)30001-3. 11692503. - DOI - PMC - PubMed
    1. Blum J.W. Nutritional physiology of neonatal calves. J. Anim. Physiol. Anim. Nutr. (Berl) 2006;90:1–11. doi: 10.1111/j.1439-0396.2005.00614.x. 16422763. - DOI - PubMed
    1. Blum J.W., Baumrucker C.R. Insulin-like growth factors (IGFs), IGF binding proteins, and other endocrine factors in milk: Role in the newborn. Adv. Exp. Med. Biol. 2008;606:397–422. doi: 10.1007/978-0-387-74087-4_16. 18183939. - DOI - PubMed
    1. Blum J.W., Hammon H. Colostrum effects on the gastrointestinal tract, and on nutritional, endocrine and metabolic parameters in neonatal calves. Livest. Prod. Sci. 2000;66:151–159. doi: 10.1016/S0301-6226(00)00222-0. - DOI

Publication types

LinkOut - more resources