Review
. 2020 Jan 12;10(5):2067-2094.
doi: 10.7150/thno.39968. eCollection 2020.

Gap-enhanced Raman tags: fabrication, optical properties, and theranostic applications

Affiliations
Review

Gap-enhanced Raman tags: fabrication, optical properties, and theranostic applications

Nikolai G Khlebtsov et al. Theranostics. .

Abstract

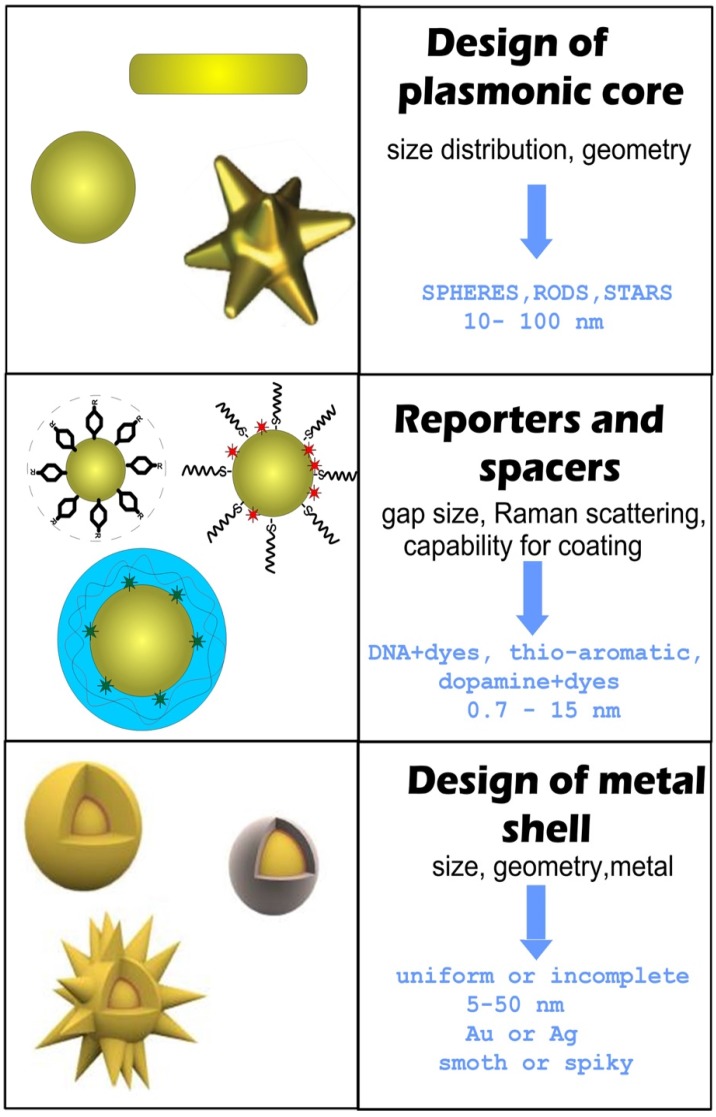
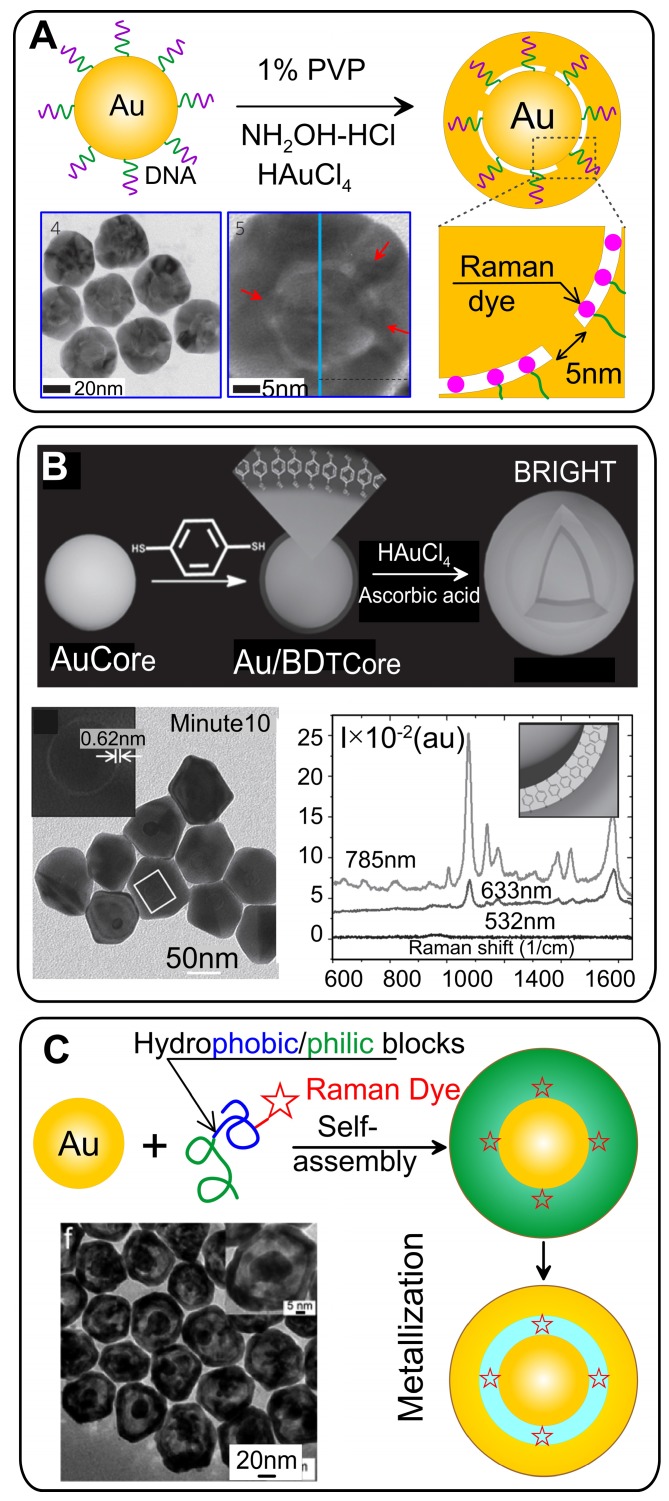
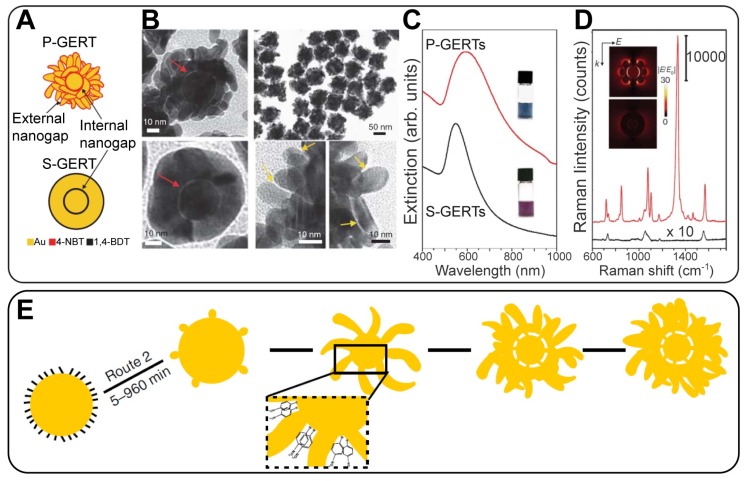
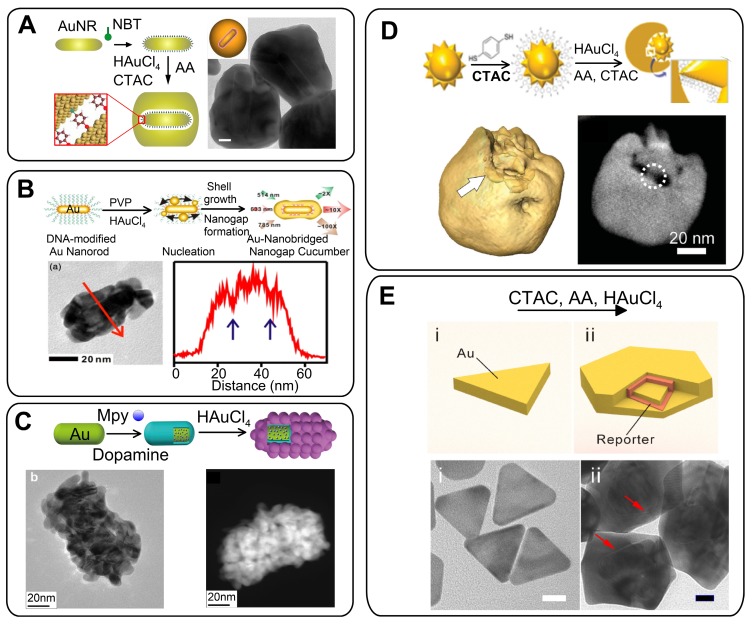
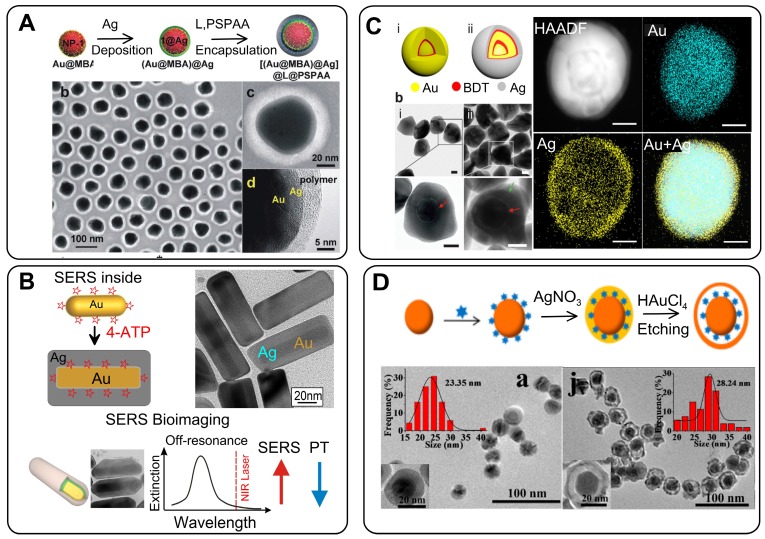
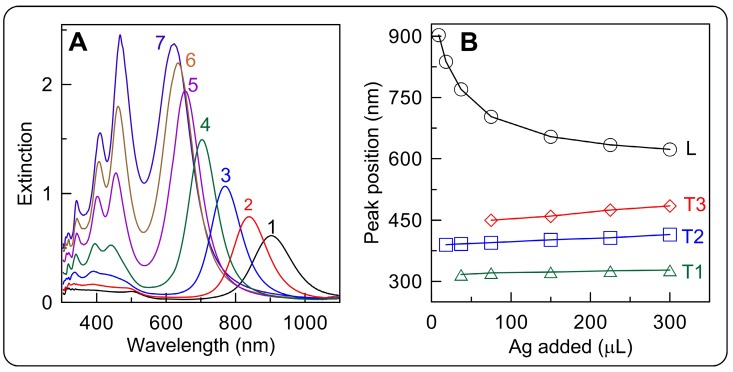
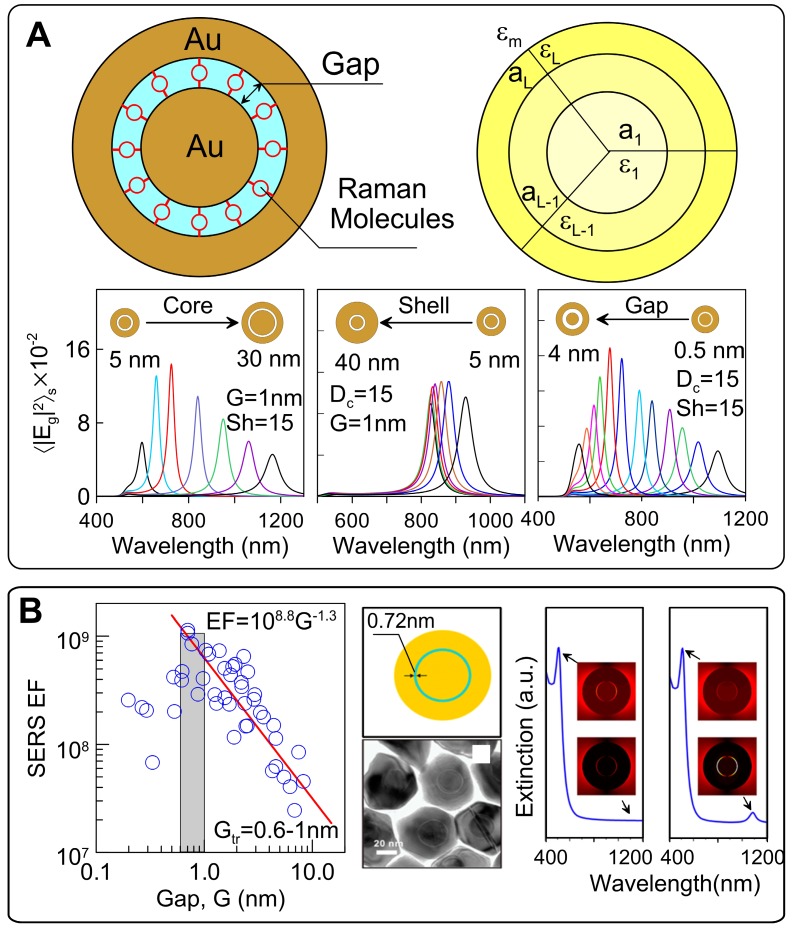
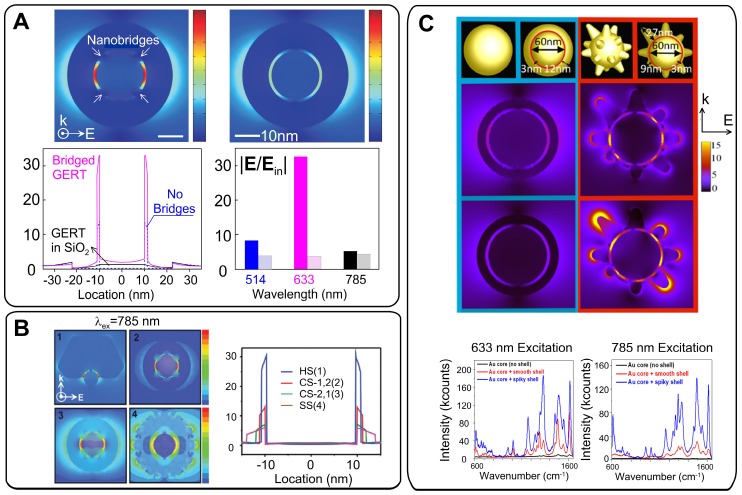
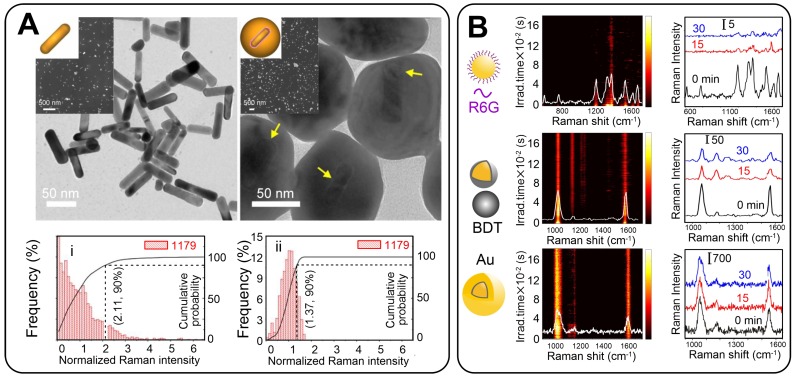
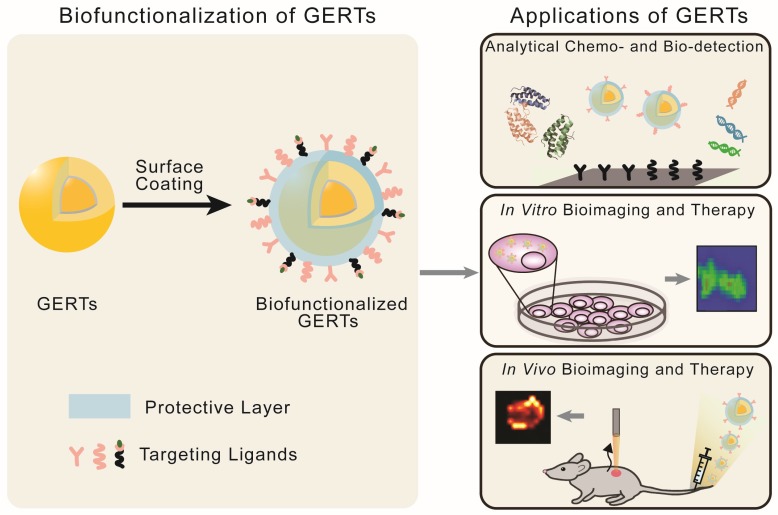
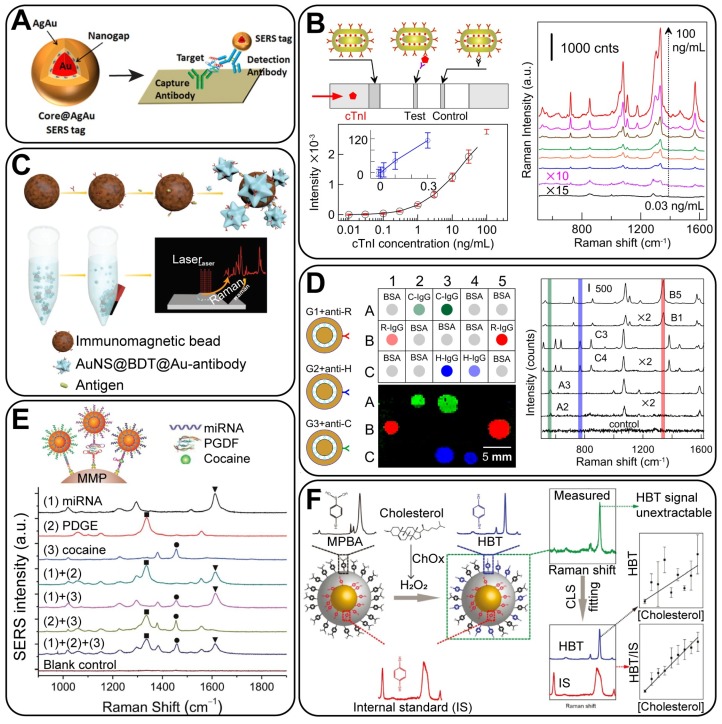
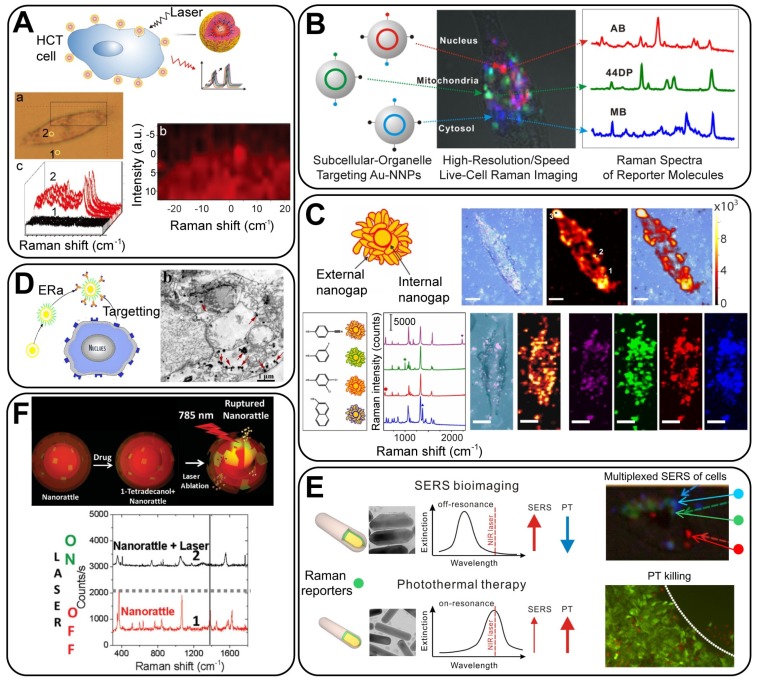
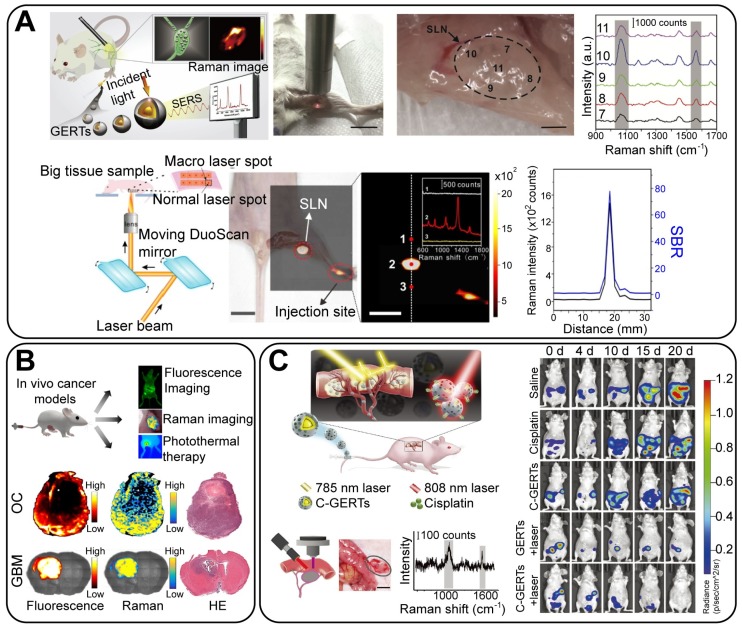
Gap-enhanced Raman tags (GERTs) are emerging probes of surface-enhanced Raman scattering (SERS) spectroscopy that have found promising analytical, bioimaging, and theranostic applications. Because of their internal location, Raman reporter molecules are protected from unwanted external environments and particle aggregation and demonstrate superior SERS responses owing to the strongly enhanced electromagnetic fields in the gaps between metal core-shell structures. In this review, we discuss recent progress in the synthesis, simulation, and experimental studies of the optical properties and biomedical applications of novel spherically symmetrical and anisotropic GERTs fabricated with common plasmonic metals-gold (Au) and silver (Ag). Our discussion is focused on the design and synthetic strategies that ensure the optimal parameters and highest enhancement factors of GERTs for sensing and theranostics. In particular, we consider various core-shell structures with build-in nanogaps to explain why they would benefit the plasmonic GERTs as a superior SERS tag and how this would help future research in clinical analytics and therapeutics.

Keywords: bioimaging; gap-enhanced Raman tags (GERTS); plasmonic core-shell nanoparticles; plasmonic photothermal therapy; surface-enhanced Raman scattering (SERS); theranostics.


Conflict of interest statement

Competing Interests: The authors have declared that no competing interest exists.

Figures

Figure 1
Figure 1
General steps and design criteria in engineering of reporter-embedded gap-enhanced Raman tags (GERTs).
Figure 2
Figure 2
(A) Synthetic scheme for the spherical Au@Au GERTs by using DNA-modified Au NPs as templates. Adapted from Ref. . (B) Design and synthesis of Au@Au GERTs by using thiolated aromatic molecules as reporters and spacers. Adapted with permission from Ref. . (C) Schematic illustration of the synthesis of nanogapped AuNPs on the basis of self-assembly of amphiphilic block copolymers on the Au core surface. Transmission electron microscopy (TEM) image illustrates the GERT structure with an interior nanogap of 1.5 nm. Adapted with permission from Ref. .
Figure 3
Figure 3
Schematic structures and the corresponding representative TEM images of P-GERTs (A, B) and S-GERTs (C, D); Red and yellow arrows indicate the internal and external nanogaps, respectively. The panels (F) and (G) represent sample photos and extinction spectra, FDTD simulations, and SERS spectra. The bottom panel (H) illustrates the synthetic scheme of P-GERTs. Reproduced with permission from Ref. .
Figure 4
Figure 4
(A) Three steps in GERT synthesis. TEM image of GERTs with a 1-nm gap between AuNR core and shell. Adapted with permission from Refs. , . (B) Synthetic strategy and TEM image of Au nanocucumbers. Element line mapping analysis of the region is shown by red arrows. The gap cavity regions are indicated by blue arrows. Adapted with permission from Ref. (https://pubs.acs.org/doi/10.1021/acsomega.8b01153, further permissions related to the material excerpted should be directed to the ACS). (C) Schematic synthesis of GERTs based on polydopamine-coated AuNRs. HRTEM and STEM images of GERTs with interior gaps. Adapted from Ref. (D) Schematic illustration of the expected Au-nanostar-seeded growth of GERTs. 3D rendering of an electron tomography reconstruction for a semishell covered Au nanostar. A slice through the reconstruction reveals the connections and gaps between seed and shell. Adapted with permission from Ref. . (E) Schematic illustration and TEM images of Au nanotriangles (i) and nanotriangle-based gap-enhanced Raman tags (ii). Adapted with permission from Ref. .
Figure 5
Figure 5
(A) Synthesis of Au@rRM@Ag NPs. Shown also are TEM and HRTEM images of polymer-coated Au@MBA@Ag NPs. Adapted with permission from Ref. . (B) Synthesis of AuNR@RM@Ag nanocuboids. HRTEM image of nanocuboids with embedded ATP molecules. Schematic representation of the rational design of SERS and PTT for Ag coated AuNRs. Adapted with permission from Refs. , . (C) Schematic diagrams and TEM images of single-shell GERTs (Au@BDT@Au) and (ii) bimetallic double-shell GERTs (Au@BDT@Au@BDT@Ag). Shown also is the EDS element mapping of a double-shell GERT for Au, Ag, and the overlaid image. Adapted with permission from Ref. . (D) Synthesis of Au@gap@Ag-Au NPs. Representative TEM images of Au@RM@Ag and Au@gap@Ag-Au NPs. Adapted with permission from Ref. .
Figure 6
Figure 6
(A) Extinction spectra of the Au@ATP@Ag GERTs with outer Ag shell thicknesses of 0.6 (1), 1.8 (2), 7 (3), 12.5 (4), 15,5 (5), 17 (6), and 19.1 (7) nm. The length and thickness of the initial AuNRs are 72 and 12 nm, respectively. Dependence of the major extinction peak positions for the longitudinal (L) and transversal (T1, T2, T3) modes of Au@Ag cuboids on the added volume of 0.1M AgNO3. Adapted with permission from Ref. .
Figure 7
Figure 7
(A) Schematic model of a multilayered Au GERT with embedded RMs. The bottom row shows the spectra of the enhancement factor E2, calculated for core diameters of 5-30 nm at a constant gap G = 1 nm and shell thickness S = 15 nm (left), for shell thicknesses of 5-40 nm at a constant gap G = 1 nm and a core diameter of 15 nm (center), for different gap thickness G = 0.5-8 nm at a constant core diameter of 15 nm and a shell thickness of 15 nm (right). Adapted with permission from Ref. . (B) Quantum tunneling effect revealed by measurements of the experimental maximum SERS EFs for 45 Au nanodimers (left). Quantum tunneling effect on the extinction spectra of Au nanomatryoshkas with 0.7-nm interlayers (right). Note the different NIR parts of the classical and quantum-corrected spectra (indicated by arrows). Adapted with permission from Ref. .
Figure 8
Figure 8
(A) Calculated near-field EM field distribution of bridged and non-bridged GERTs. Comparison of the EM field distribution profiles along the center-horizontal line at an incident wavelength of 633 nm between nanobridged and nonbridged GERTs. The right part shows the wavelength dependence of the field enhancement inside the nanobridged and nonbridged GERTs. Adapted from Ref. . (B) EM simulations and the EM field distributions along the center-horizontal line at an incident wavelength of 785 nm for the half-shell NP [HS (1), blue], closed-shell NP with a 1.2 nm intra-nanogap [CS-1.2 (2), red], closed-shell NP with a 2.1 nm intra-nanogap [CS-2.1 (3), green], and star-shaped NP [SS (4), magenta] with an irregular nanogap. Adapted with permission from Ref. . (C) Simulated EM field distribution for GERTs with a smooth and spiky surface at an excitation wavelength of 633 nm (top) and 785 nm (bottom). Experimental SERS spectra for the core containing a polymer-conjugated dye (black), a smooth core-shell structure (red), and a spiky core-shell structure (blue), at both 633 and 785-nm excitation wavelengths. Adapted with permission from Ref. .
Figure 9
Figure 9
(A) TEM and SEM images of AuNRs and AuNR-based GERTs. Normalized Raman intensity distribution of the Raman band at 1179 cm-1 for AuNRs and AuNR-based GERTs. Adapted with permission from Ref. . (B) Schematic diagrams, photostability measurements of time-resolved SERS spectra of solid NPs on a silicon wafer during continuous irradiation for 30 min, and three representative SERS spectra at selected irradiation times for AuNS-R6G, AuNS-BDT, and Au@BDT@Au GERTs. Adapted with permission from Ref. .
Figure 10
Figure 10
Biofunctionalization and biomedical applications of GERTs.
Figure 11
Figure 11
(A) Typical sandwich assay for the detection of an antigen on a 96-well planar substrate by using GERTs. Adapted with permission from Ref. . (B) GERT-based LFIA for cTnI, the average SERS spectra in the test zones, and the standard curve of different cTnI concentrations. Adapted with permission from Ref. . (C) Schematic illustration of GERT-based immunoassay for biomarker recognition in liquid phase. Adapted with permission from Ref. . (D) Multiplex dot immunoassay of GERTs to detect different types of IgG. Adapted with permission from Ref. . (E) A multiplex analytical strategy based on GERTs for detecting three types of biomarkers, including microRNA-141, platelet-derived growth factor (PDGF), and cocaine. Adapted with permission from Ref. . (F) GERTs with internal standards for the quantitative detection of cholesterol. Adapted with permission from Ref. .
Figure 12
Figure 12
(A) Raman spectra and mappings of GERTs distributed on a single cell surface. Adapted with permission from Ref. . (B) GERTs for the high-resolution and high-speed multiplex imaging on a live cell. Adapted with permission from Ref . (C) Mesoporous-silica-coated first- and second- generation GERTs for high photostable and high-speed imaging. Adapted with permission from Ref. . (D) SERS detection and PTT of cancer cells by using targeted GERTs. Adapted with permission from Ref. . (E) The design of GERTs for bioimaging and PTT: off-resonant tags with a thick shell have a high SERS signal and a reduced PT effect, and on-resonant tags with a thin Ag shell show moderate SERS performance and an enhanced PT effect. Adapted with permission from Ref. . (F) Raman-guided locoregional therapy using double-shell GERTs. Reprinted with permission from Ref. .
Figure 13
Figure 13
(A) (top) Detection of a sentinel lymph node with a portable Raman spectroscopy scanner by using the first-generation GERTs (S-GERTs). Adapted with permission from Ref. . (bottom) High-contrast and wide-area lymph node imaging in vivo by using P-GERTs. Adapted with permission from Ref. . (B) The SERS-fluorescent NPs for dual-mode cancer imaging and photothermal therapy. Adapted with permission from Ref. . (C) SERS-guided detection and chemo-photothermal therapy of abdominal disseminated microtumors in mice by using GERTs loaded with cisplatin. Adapted with permission from Ref. .

Similar articles

Cited by

References

    1. Le Ru EC, Etchegoin PG. Single-molecule surface-enhanced Raman spectroscopy. Annu Rev Phys Chem. 2012;63:65–87. - PubMed
    1. Fleischmann M, Hendra PJ, MsQuillan AJ. Raman spectra of pyridine absorbed at a silver electrode. Chem Phys Lett. 1974;26:163–66.
    1. Jeanmarie DL, Van Duyne RP. Surface Raman spectroelectrochemistry. Part 1: Heterocyclic, aromatic, and aliphatic amines adsorbed on the anodized silver electrode. J Electroanal Chem. 1977;84:1–20.
    1. Albrecht MG, Creighton JA. Anomalously intense Raman spectra of pyridine at a silver electrode. J Am Chem Soc. 1977;99:5215–17.
    1. Lim D-K, Jeon K-S, Hwang J-H, Kim H, Kwon S, Shu YD. et al. Highly uniform and reproducible surface-enhanced Raman scattering from DNA-tailorable nanoparticles with 1-nm interior gap. Nat Nano. 2011;6:452–60. - PubMed

Publication types

MeSH terms