. 2020 Feb 8:2020:9107140.
doi: 10.1155/2020/9107140. eCollection 2020.

Increased Temperature Facilitates Adeno-Associated Virus Vector Transduction of Colorectal Cancer Cell Lines in a Manner Dependent on Heat Shock Protein Signature

Affiliations

Increased Temperature Facilitates Adeno-Associated Virus Vector Transduction of Colorectal Cancer Cell Lines in a Manner Dependent on Heat Shock Protein Signature

Alicja Bieńkowska et al. Biomed Res Int. .

Abstract

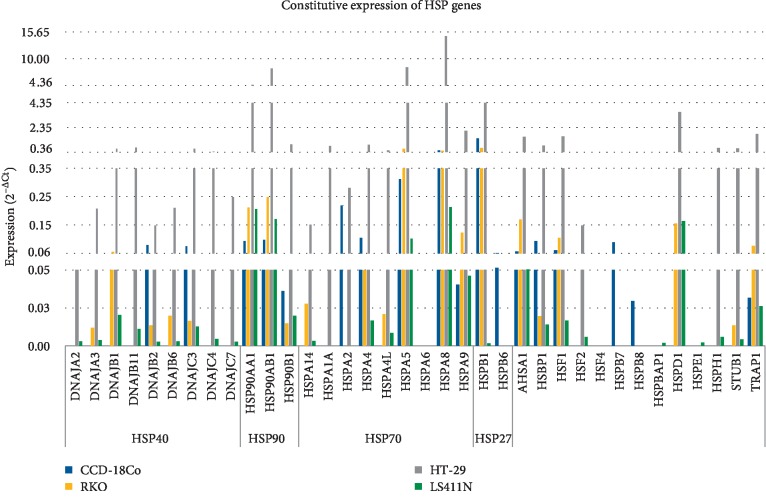
Colorectal cancer (CRC) is one of the most common cancers in human population. A great achievement in the treatment of CRC was the introduction of targeted biological drugs and solutions of chemotherapy, combined with hyperthermia. Cytoreductive surgery and HIPEC (hyperthermic intraperitoneal chemotherapy) extends the patients' survival with CRC. Recently, gene therapy approaches are also postulated. The studies indicate the possibility of enhancing the gene transfer to cells by recombinant adeno-associated vectors (rAAV) at hyperthermia. The rAAV vectors arouse a lot of attention in the field of cancer treatment due to many advantages. In this study, the effect of elevated temperature on the transduction efficiency of rAAV vectors on CRC cells with different origin and gene profile was examined. The effect of heat shock on the penetration of rAAV vectors into CRC cells in relation with the expression of HSP and AAV receptor genes was tested. It was found that the examined cells under hyperthermia (43°C, 1 h) are transduced at a higher level than in normal conditions (37°C). The results also indicate that studied RKO, HT-29, and LS411N cell lines express HSP genes at different levels under both 37°C and 43°C. Moreover, the results showed that the expression of AAV receptors increases in response to elevated temperature. The study suggests that increased rAAV transfer to CRC can be achieved under elevated temperature conditions. The obtained results provide information relevant to the design of new solutions in CRC therapy based on the combination of hyperthermia, chemotherapy, and gene therapy.


Conflict of interest statement

The authors declare that there are no conflicts of interest regarding the publication.

Figures

Figure 1
Figure 1
Schematic methodology of rAAV transduction at hyperthermia. The key points of the experiment were marked and described on the timeline. The rAAV vector in the dose of 4 × 104 gc was added on the second day of the experiment. The CRC cells and colon fibroblasts were transduced for 48 h, then the media were replaced. The transduction efficiency was performed on seventh day of the experiment by GFP+ cells counting and qPCR method.
Figure 2
Figure 2
Transduction efficiency of RKO cells. The studied cells were transduced with the rAAV/DJ vector at hyperthermia conditions (as described at M&M panel). The GFP (Green Fluorescent Protein) positive (+) cells were measured by the Countess II FL Automated Cell Counter and the qPCR method (panel (a)), flow cytometry (panel (b)), and visualized with an inverted fluorescence microscope (panel (c)). For panel (b) the Q1 and Q2 quadrants represents death cells (7-AAD positive staining). The Q3 and Q4 quadrants represents live cells (7-AAD negative staining). The GFP+ cells are located in Q2 and Q4 quadrants. Images of non transduced (BF) cells and transduced cells (FITC) were performed at 10x magnification (panel (c)). Statistically significant differences were analyzed between cells transduced at 37°C and cells transduced at hyperthermia conditions. Statistical significance for results of GFP+ cells were marked as asterisks (∗∗p < 0.01; ∗∗∗∗p < 0.0001) and for results of rAAV genome copies (gc) were marked as carets (^^p < 0.01; ^^^p < 0.001).
Figure 3
Figure 3
Transduction efficiency of HT-29 cells. The studied cells were transduced with the rAAV/DJ vector at hyperthermia conditions (as described at M&M panel). The GFP (Green Fluorescent Protein) positive (+) cells were measured by the Countess II FL Automated Cell Counter and the qPCR method (panel (a)), flow cytometry (panel (b)), and visualized with an inverted fluorescence microscope (panel (c)). For panel (b) the Q1 and Q2 quadrants represents death cells (7-AAD positive staining). The Q3 and Q4 quadrants represents live cells (7-AAD negative staining). The GFP+ cells are located in Q2 and Q4 quadrants. Images of non transduced (BF) cells and transduced cells (FITC) were performed at 10x magnification (panel (c)). Statistically significant differences were analyzed between cells transduced at 37°C and cells transduced at hyperthermia conditions. Statistical significance for results of GFP+ cells were marked as asterisks (∗∗p < 0.01; ∗∗∗p < 0.001) and for results of rAAV genome copies (gc) were marked as carets (^^p < 0.01).
Figure 4
Figure 4
Transduction efficiency of LS411N cells. The studied cells were transduced with the rAAV/DJ vector at hyperthermia conditions (as described at M&M panel). The GFP (Green Fluorescent Protein) positive (+) cells were measured by the Countess II FL Automated Cell Counter and the qPCR method (panel (a)), flow cytometry (panel (b)), and visualized with an inverted fluorescence microscope (panel (c)). For panel (b) the Q1 and Q2 quadrants represents death cells (7-AAD positive staining). The Q3 and Q4 quadrants represents live cells (7-AAD negative staining). The GFP+ cells are located in Q2 and Q4 quadrants. Images of non transduced (BF) cells and transduced cells (FITC) were performed at 10x magnification (panel (c)). Statistically significant differences were analyzed between cells transduced at 37°C and cells transduced at hyperthermia conditions. Statistical significance for results of GFP+ cells were marked as asterisks (∗∗∗∗p < 0.0001).
Figure 5
Figure 5
Transduction efficiency of CCD-18Co cells. The studied cells were transduced with the rAAV/DJ vector at hyperthermia conditions (as described at M&M panel). The GFP (Green Fluorescent Protein) positive (+) cells were measured by the Countess II FL Automated Cell Counter and the qPCR method (panel (a)), flow cytometry (panel (b)), and visualized with an inverted fluorescence microscope (panel (c)). For panel (b) the Q1 and Q2 quadrants represents death cells (7-AAD positive staining). The Q3 and Q4 quadrants represents live cells (7-AAD negative staining). The GFP+ cells are located in Q2 and Q4 quadrants. Images of non transduced (BF) cells and transduced cells (FITC) were performed at 10x magnification (panel (c)). Statistically significant differences were analyzed between cells transduced at 37°C and cells transduced at hyperthermia conditions. Statistical significance for results of GFP+ cells were marked as asterisks (∗∗p < 0.01) and for results of rAAV genome copies (gc) were marked as carets (^p < 0.05).
Figure 6
Figure 6
AAVR, HSPG1, HSPG2 expression at normal temperature (37°C) in RKO, HT-29, LS411N, and CCD-18Co fibroblast. The figure shows relevant differences between constitutive expression of tested genes (2−ΔCt).
Figure 7
Figure 7
AAVR, HSPG1 and HSPG2 expression in CRC lines. The influence of heat shock on the expression of genes in tested cells as well normal cells was estimated by the reverse transcription and the qPCR method. The cells not exposure to hyperemia were used as reference to calculate fold range (2−ΔΔCt). Statistically significant differences were analyzed between cells incubated at 37°C and cells exposed to hyperthermia conditions (∗∗p < 0.01; ∗∗∗p < 0.0001).
Figure 8
Figure 8
Heat shock protein (HSP) expression profiles of CRC cell lines (RKO, HT-29, LS411N) and CCD-18Co at normal temperature (37°C). The figure shows relevant differences between constitutive expression of HSP (2−ΔCt).
Figure 9
Figure 9
Temperature-related heat shock proteins (HSP) expression profiles of CRC and fibroblast of colon. The cells were exposed to hyperthermia (43°C, 1 h). The heat shock conditions reveal the differences between the sensitivity of CRC cells to increased temperature. Expression values (2−ΔΔCt) illustrate the specific HSP signature for CRC of different origin. Samples at 37°C were not exposed to hyperthermia conditions and were used as reference to calculated fold change (2−ΔΔCt). Expression in 37°C was marked as 1.0 for each gene, regardless of whether it was determined in all examined cells (exact results of HSP expression at 37°C were showed in Figure 10).
Figure 10
Figure 10
Networks of upregulated genes after hyperthermia was applied to CRC cell lines and colon fibroblast (based on data from Table 1). The interactions were visualized as nodes and colored edges (according to String database [38]).

References

    1. Bray F., Ferlay J., Soerjomataram I., Siegel R. L., Torre L. A., Jemal A. Global cancer statistics 2018: GLOBOCAN estimates of incidence and mortality worldwide for 36 cancers in 185 countries. CA: A Cancer Journal for Clinicians. 2018;68(6):394–424. doi: 10.3322/caac.21492. - DOI - PubMed
    1. Wright M., Beaty J. S., Ternent C. A. Molecular markers for colorectal cancer. Surgical Clinics of North America. 2017;97(3):683–701. doi: 10.1016/j.suc.2017.01.014. - DOI - PubMed
    1. Stintzing S. Recent advances in understanding colorectal cancer. F1000Research. 2018;7 doi: 10.12688/f1000research.14604.1. Faculty Rev-1528. - DOI - PMC - PubMed
    1. Matlawska K., Kalinowska U., Erxleben A., Osiecka R., Ochocki J. Novel analogues of 5-fluorouracil–synthesis, x-ray crystallography, and cytotoxic effects in normal human peripheral blood lymphocytes and colon adenocarcinoma HT 29. European Journal of Inorganic Chemistry. 2005;2005(15):3109–3117. doi: 10.1002/ejic.200500015. - DOI
    1. Ochocki J., Andrea Erxleben A., Lippert B. Synthesis and spectroscopy of phosphonate derivatives of uracil and thymine. X-ray crystal structure of diethyl 6-uracilmethylphosphonate. Journal of Heterocyclic Chemistry. 1997;34:1179–1184. doi: 10.1002/jhet.5570340414. - DOI

Substances