. 2020 Feb 5:12:100250.
doi: 10.1016/j.bonr.2020.100250. eCollection 2020 Jun.

Characterization of a reproducible model of fracture healing in mice using an open femoral osteotomy

Affiliations

Characterization of a reproducible model of fracture healing in mice using an open femoral osteotomy

C D Collier et al. Bone Rep. .

Erratum in

Abstract

Purpose: The classic fracture model, described by Bonnarens and Einhorn in 1984, enlists a blunt guillotine to generate a closed fracture in a pre-stabilized rodent femur. However, in less experienced hands, this technique yields considerable variability in fracture pattern and requires highly-specialized equipment. This study describes a reproducible and low-cost model of mouse fracture healing using an open femoral osteotomy.

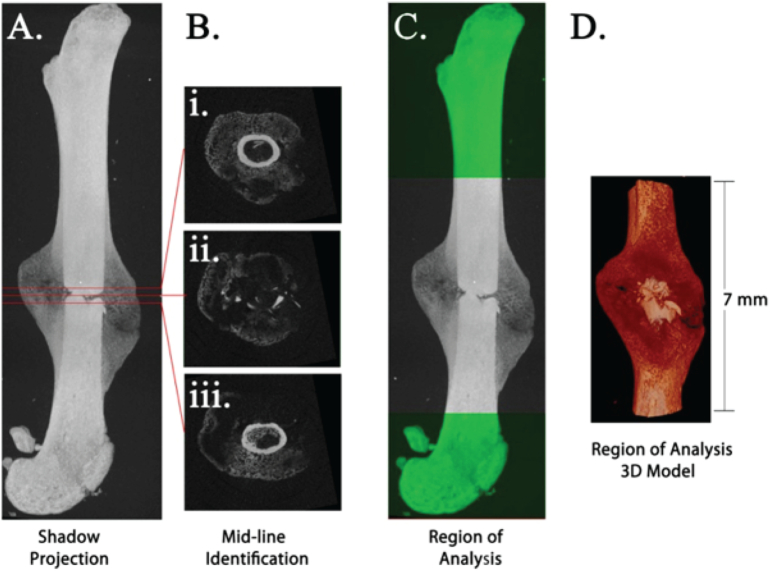
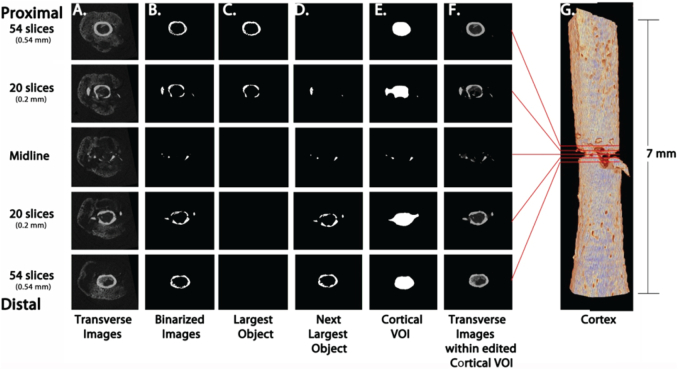
Methods: Femur fractures were produced in skeletally mature male and female mice using an open femoral osteotomy after intramedullary stabilization. Mice were recovered for up to 28 days prior to analysis with microradiographs, histomorphometry, a novel μCT methodology, and biomechanical torsion testing at weekly intervals.

Results: Eight mice were excluded due to complications (8/193, 4.1%), including unacceptable fracture pattern (2/193, 1.0%). Microradiographs showed progression of the fracture site to mineralized callus by 14 days and remodelling 28 days after surgery. Histomorphometry from 14 to 28 days revealed decreased cartilage area and maintained bone area. μCT analysis demonstrated a reduction in mineral surface from 14 to 28 days, stable mineral volume, decreased strut number, and increased strut thickness. Torsion testing at 21 days showed that fractured femurs had 61% of the ultimate torque, 63% of the stiffness, and similar twist to failure when compared to unfractured contralateral femurs.

Conclusions: The fracture model described herein, an open femoral osteotomy, demonstrated healing comparable to that reported using closed techniques. This simple model could be used in future research with improved reliability and reduced costs compared to the current options.

Keywords: Bone repair; Fracture healing; Micro-CT fracture analysis; Mouse fracture model; Osteotomy.


Figures

Fig. 1
Fig. 1
Photographs illustrate the surgical technique for the mouse fracture model. (A) Depicts the tools used during surgery; the magnified inset shows a hypodermic needle (left) and a stainless-steel pin (right). (BF) Are described in the methods section.
Fig. 2
Fig. 2
Representative microradiographs 0 to 28 days after fracture.
Fig. 3
Fig. 3
Definition of 7 mm Region of Analysis centered on the fracture midline. Shadow projection image of fractured femur (A). Fracture midline (B ii.) was determined by calculating the midpoint between the first intact cortical ring, proximally (B i.) and distally (B iii.), from the fracture. Region of Analysis was defined as 3.5 mm proximal and distal to midline (C–D).
Fig. 4
Fig. 4
Identification of cortical bone to exclude from callus analysis. Examples of transverse slices (A–F) at the fracture midline (center), then proximally and distally 0.2 mm (within the fracture) and 0.54 mm (within intact cortical bone). Original μCT images (A) were binarized with cortical thresholding (B). The two largest objects (proximal and distal pieces of cortical bone) were selected (C,D), combined, and shrinkwrapped (E). The cortical VOI (E) was manually edited to define the cortex-callus boundary and to incorporate any bone fragments, yielding the final cortical model (F–G) for exclusion from the analysis of calluses. Comparison of transverse images within the Cortical VOI (F) and original transverse images (A) illustrates the fidelity of our cortical isolation strategy. The Cortical VOI CTAn Custom Processing Task list is detailed in Supplemental Table 1.
Fig. 5
Fig. 5
Create Callus VOI for analysis. Examples of transverse slices (A–B) at the fracture midline (center), then proximally and distally 0.2 mm (within the fracture) and 0.54 mm (within intact cortical bone). Original μCT images (Fig. 4A) were binarized with callus threshold (A) and the Cortical VOI (Fig. 4E) was subtracted to obtain callus VOI which is binarized with an Adaptive Threshold (B), yielding the final mineralized callus model (C–D) for morphometric 3D analysis. The Callus Mineral VOI CTAn Custom Processing Task list is detailed in Supplemental Table 2.
Fig. 6
Fig. 6
Histomorphometry at 14 and 28 days after fracture. Representative histologic sections stained with picrosirius red (bone) and alcian blue (cartilage) are shown in (A). The black arrowhead notes fibrous tissue in (A). Quantitative analysis describes differences in callus area (B), cartilage area (C), fibrous tissue area (D), and bone area (E) over time. All datapoints represent individual male/female mice at 14 (N = 5/6) and 28 (N = 5/6) days. p < .05 significant (*).
Fig. 7
Fig. 7
μCT at 14–28 days after fracture. Representative three-dimensional μCT renderings are shown (A). Quantitative analysis describes differences in mineral volume (B), mineral surface (C), strut number (D), strut thickness (E), strut separation (F), connectivity (G), structure model index (H), and polar moment of inertia (I) over time. All datapoints represent individual male/female mice at 14 (N = 4/5), 21 (N = 11/12) and 28 (N = 5/4) days. p < .05 significant (*).
Fig. 8
Fig. 8
Biomechanical torsion testing 21 days after fracture. The alignment guide for potting femora is shown in (A). Quantitative analysis describes differences in ultimate torque (B), stiffness (C), and twist to failure (D) between unfractured contralateral femurs and fractured femurs at 21 days. All datapoints represent individual male/female mice at 21 days (N = 12/11). p < .05 significant (*).

References

    1. Alkhiary Y.M., Gerstenfeld L.C., Krall E., Westmore M., Sato M., Mitlak B.H., Einhorn T.A. Enhancement of experimental fracture-healing by systemic administration of recombinant human parathyroid hormone (PTH 1-34) J. Bone Joint Surg. 2005;87(4):731–741. American volume. - PubMed
    1. Auregan J.C., Coyle R.M., Danoff J.R., Burky R.E., Akelina Y., Rosenwasser M.P. The rat model of femur fracture for bone and mineral research: an improved description of expected comminution, quantity of soft callus and incidence of complications. Bone Joint Res. 2013;2(8):149–154. - PMC - PubMed
    1. Baldik Y., Diwan A.D., Appleyard R.C., Fang Z.M., Wang Y., Murrell G.A. Deletion of iNOS gene impairs mouse fracture healing. Bone. 2005;37(1):32–36. - PubMed
    1. Bonnarens F., Einhorn T.A. Production of a standard closed fracture in laboratory animal bone. J. Orthop. Res. 1984;2(1):97–101. - PubMed
    1. Bouxsein M.L., Boyd S.K., Christiansen B.A., Guldberg R.E., Jepsen K.J., Muller R. Guidelines for assessment of bone microstructure in rodents using micro-computed tomography. J. Bone Miner. Res. Off. J. Am. Soc. Bone Miner. Res. 2010;25(7):1468–1486. - PubMed

LinkOut - more resources