

Metabolic switch and epithelial-mesenchymal transition cooperate to regulate pluripotency
- PMID: 32090361
- PMCID: PMC7156961
- DOI: 10.15252/embj.2019102961
Metabolic switch and epithelial-mesenchymal transition cooperate to regulate pluripotency
Abstract
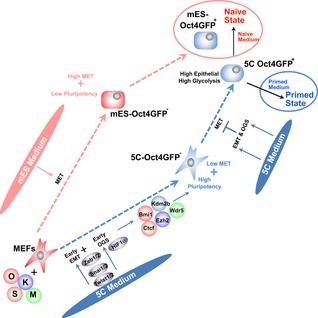
Both metabolic switch from oxidative phosphorylation to glycolysis (OGS) and epithelial-mesenchymal transition (EMT) promote cellular reprogramming at early stages. However, their connections have not been elucidated. Here, when a chemically defined medium was used to induce early EMT during mouse reprogramming, a facilitated OGS was also observed at the same time. Additional investigations suggested that the two events formed a positive feedback loop via transcriptional activation, cooperated to upregulate epigenetic factors such as Bmi1, Ctcf, Ezh2, Kdm2b, and Wdr5, and accelerated pluripotency induction at the early stage. However, at late stages, by over-inducing glycolysis and preventing the necessary mesenchymal-epithelial transition, the two events trapped the cells at a new pluripotency state between naïve and primed states and inhibited further reprogramming toward the naïve state. In addition, the pluripotent stem cells at the new state have high similarity to epiblasts from E4.5 and E5.5 embryos, and have distinct characteristics from the previously reported epiblast-like or formative states. Therefore, the time-dependent cooperation between OGS and EMT in regulating pluripotency should extend our understanding of related fields.
Keywords: mesenchymal-epithelial transition; metabolic switch; pluripotent state; reprogramming.
© 2020 The Authors. Published under the terms of the CC BY 4.0 license.
Conflict of interest statement
The authors declare that they have no conflict of interest.
Figures
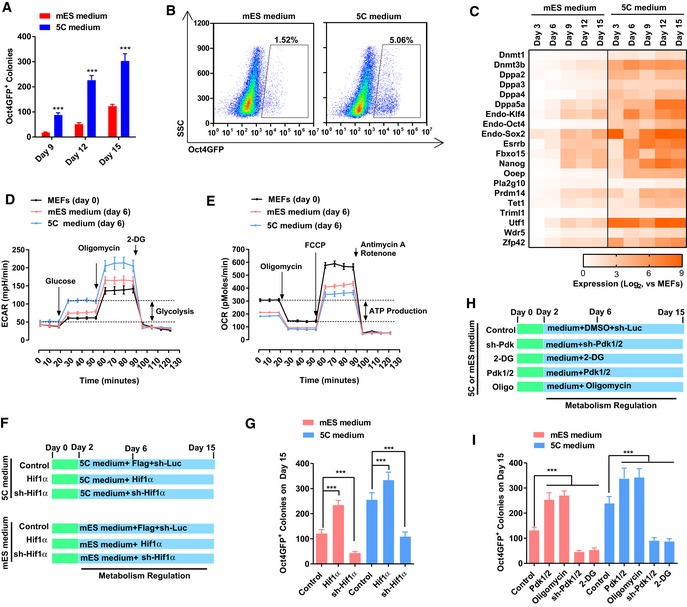
- A, B
5C or mES medium was used during reprogramming. On day 15, Oct4GFP+ colonies were counted (A). The percentages of Oct4GFP+ cells were also determined with FACS (B).
- C
The expression of several core pluripotency markers was determined with qPCR at different time points during reprogramming and normalized against those in MEFs.
- D, E
Energy metabolism was analyzed on day 6 during reprogramming with the Seahorse instrument. Increase in extracellular acidification rate (ECAR) after adding glucose was considered as glycolysis ability of the cells (D), while the decrease in oxygen consumption rate (OCR) was considered as the ATP production ability of the cells (E).
- F, G
Expression of Hif1α was modulated with overexpression or sh‐RNA‐mediated knockdown via a retrovirus system during reprogramming (F). The numbers of Oct4GFP+ colonies were determined on day 15 (G).
- H, I
Expression of Pdk1/2 was modulated with a retrovirus system, and oligomycin (1 μM) and 2‐DG (5 mM) were used during reprogramming (H). The numbers of Oct4GFP+ colonies were determined on day 15 (I).
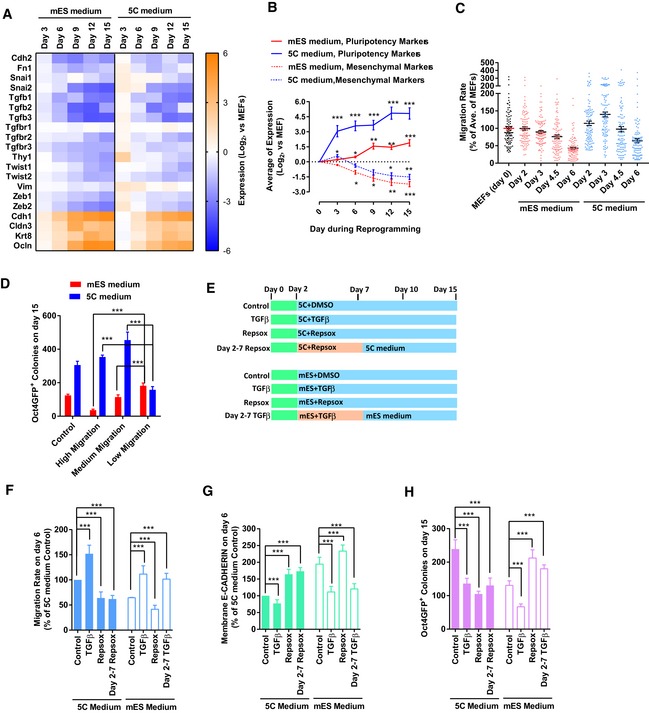
- A
Expression of several epithelial and mesenchymal markers was determined with qPCR at different time points during reprogramming with 5C or mES medium.
- B
The average expression of pluripotency markers and mesenchymal markers was calculated and plotted at different time points during reprogramming based on Figs 1C and EV1A.
- C
Cell migration was determined at the early stage (days 0–6) during reprogramming with live‐cell imaging. Live‐cell imaging recorded the actual distance traveled by each individual cell within 1 h.
- D
Cells were separated into three groups (high, one‐third of cells with the highest migration; low, one‐third of cells with the lowest migration; and medium, the other one‐third of cells) based on their migration abilities on day 3 during reprogramming. Reprogramming of these cells was traced via live‐cell imaging. The number of Oct4GFP+ colonies on day 15 converted from different groups of cells was summarized. “Control” was the average of Oct4GFP+ colonies generated from these three groups of cells.
- E–H
TGFβ (TGFβ1/2/3, 1 ng/ml each) and RepSox (1 μM) were used during reprogramming from days 2–7 or during the whole process (E). The cell migration (F) and E‐CADHERIN expression (G) were determined on day 6 with live‐cell imaging and FACS, respectively. The number of Oct4GFP+ colonies (H) was determined on day 15.
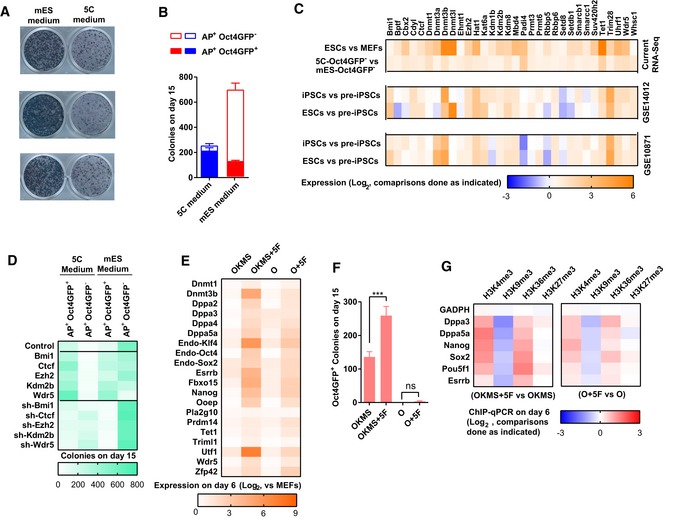
- A, B
5C and mES medium were used during reprogramming. Representative alkaline phosphatase (AP) staining on day 15 was provided in (A). AP+Oct4GFP− and AP+Oct4GFP+ colonies were counted on day 15 (B).
- C
Thirty‐two epigenetic factors were selected because they had higher expression in 5C‐Oct4GFP− than in mES‐Oct4GFP−. Their expression in ESCs, iPSCs, and pre‐iPSCs in two previous reported assays (GSE14012 and GSE10871) was also listed.
- D
The expression of Bmi1, Ctcf, Ezh2, Kdm2b, or Wdr5 was modulated with overexpression or sh‐RNA‐mediated knockdown via a retrovirus system during reprogramming. AP+Oct4GFP− and AP+Oct4GFP+ colonies were counted on day 15.
- E–G
During reprogramming with mES medium, Bmi1, Ctcf, Ezh2, Kdm2b, and Wdr5 were overexpressed simultaneously with the four Yamanaka factors (OKMS + 5F) or Oct4 (O + 5F). All factors were delivered simultaneously via a retrovirus system on days 0 and 1. Reprogramming with only Yamanaka factors (OKMS) or Oct4 (O) served as control. The expression of pluripotency markers was determined with qPCR on day 6 during reprogramming (E). The numbers of Oct4GFP+ colonies were determined on day 15 (F). The histone methylation on core pluripotency loci was determined on day 6 with ChIP‐qPCR (G).
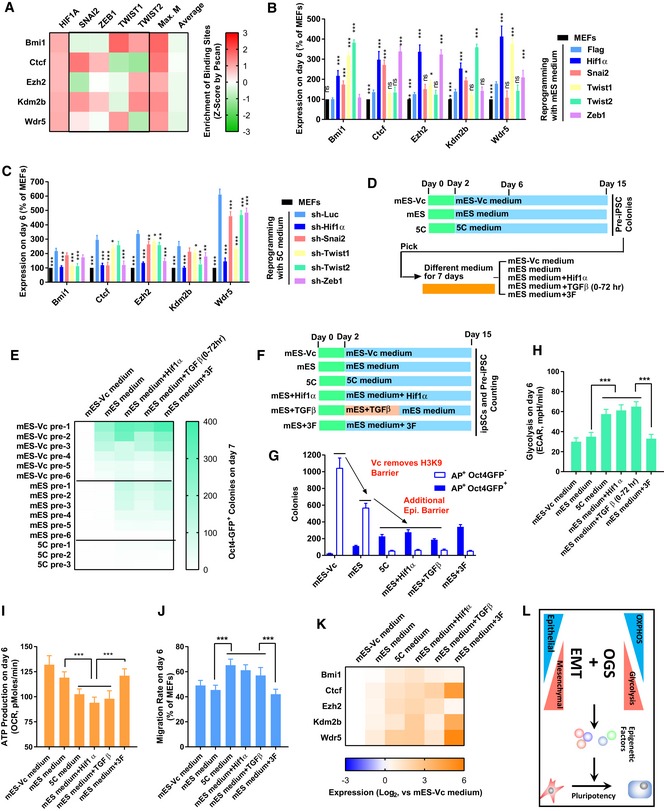
- A
The enrichment of HIF1α, SNAI2, TWIST1/2, and ZEB1 binding sites on the promoters of Bmi1, Ctcf, Ezh2, Kdm2b, and Wdr5 was determined by Pscan (Zambelli et al, 2009). The resulted Z‐scores were listed. “Max. M” suggested the maximum Z‐score generated with SNAI2, TWIST1/2, and ZEB1 binding sites on one indicated promoter. “Average” suggested the average Z‐score of all transcriptional factors tested in the Pscan software on one indicated promoter.
- B, C
The expression of H1f1α, Snai2, Twist1/2, and Zeb1 was modulated with overexpression or sh‐RNA‐mediated knockdown via a retrovirus system during reprogramming with mES (B) or 5C medium (C). The expression of Bmi1, Ctcf, Ezh2, Kdm2b, and Wdr5 was determined on day 6 with qPCR and normalized against those in MEFs. The comparisons were performed between all groups and corresponding Flag groups.
- D, E
pre‐iPSCs were isolated during reprogramming with mES‐Vc, mES, or 5C medium. These pre‐iPSCs were further cultured with a different medium (mES‐Vc and mES medium) for 7 days. Additional factors (Hif1α, Hif1α overexpression; TGFβ, TGFβ1/2/3 1 ng/ml each; 3F, Ctcf, Kdm2b, and Wdr5 overexpression) were used simultaneously with mES medium. The numbers of Oct4GFP+ colonies were determined on day 7 (E).
- F–K
Reprogramming was also performed with mES‐Vc or mES medium. Additional factors (Hif1α, Hif1α overexpression; TGFβ, TGFβ1/2/3 1 ng/ml each; 3F, Ctcf, Kdm2b, and Wdr5 overexpression) were used simultaneously with mES medium. AP+Oct4GFP− and AP+Oct4GFP+ colonies were counted on day 15 (G). In addition, energy metabolism was determined on day 6 with Seahorse instrument (H and I). Cell migration was determined by measuring the migration rate with live‐cell imaging on day 6 (J). The expression of Bmi1, Ctcf, Ezh2, Kdm2b, or Wdr5 was determined on day 6 with qPCR (K).
- L
Early EMT and facilitated OGS cooperate to induce pluripotency by removing the additional epigenetic barrier.
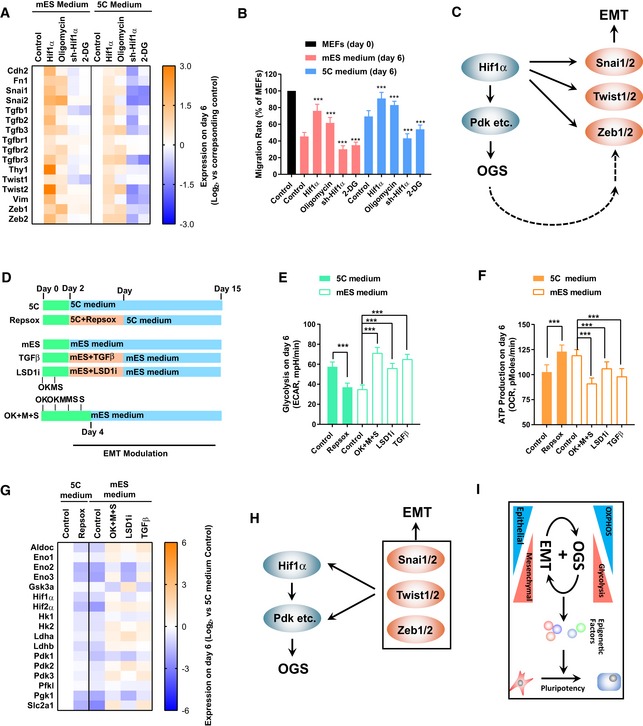
- A, B
Expression of Hif1α was modulated via a retrovirus system or small‐molecule compounds, oligomycin (1 μM) and 2‐DG (5 mM), during reprogramming. The expression of mesenchymal markers (A) and cell migration (B) was determined with qPCR and live‐cell imaging, respectively, on day 6.
- C
HIF1α induces EMT by transcriptionally activating key mesenchymal transcriptional factors, including Snai1/2, Twist1/2, and Zeb1/2. Although to a less extent, inducing OGS directly with Pdk1/2 or small molecules also activate these factors.
- D–G
RepSox (1 μM) was used on days 2–7 to inhibit early EMT during reprogramming with 5C medium. TGFβ (TGFβ1/2/3, 1 ng/ml each) on days 2–7, LSD1i (SP2509, 10 nM), and sequential introduction of Yamanaka factors (OK + M + S) were used to induce early EMT during reprogramming with mES medium (D). Except for OK + M + S group, the four Yamanaka factors were delivered simultaneously. Energy metabolism was determined on day 6 with Seahorse instrument (E and F). The expression of glycolysis markers was determined on day 6 with qPCR (G).
- H
Key mesenchymal transcriptional factors, including Snai1/2, Twist1/2, and Zeb1/2, induce OGS by transcriptionally activating Hif1α and glycolysis genes.
- I
Early EMT and facilitated OGS form a positive feedback loop to induce pluripotency.
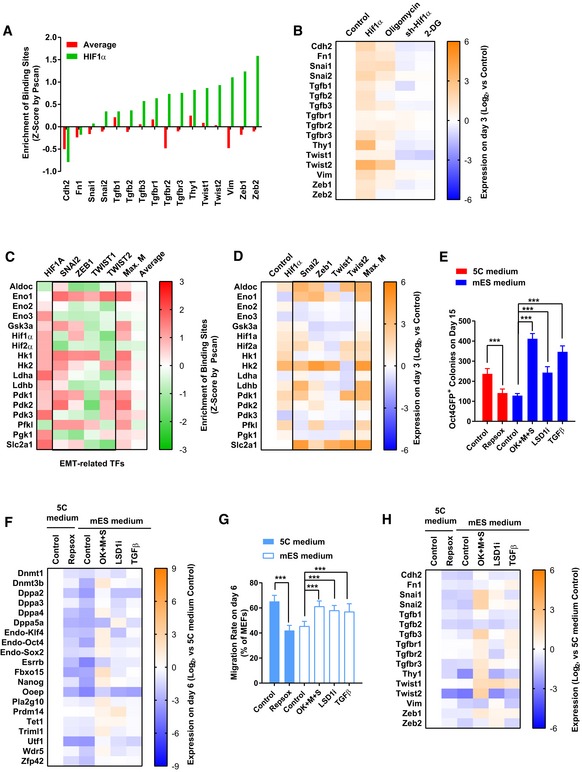
- A
The enrichment of binding sites of HIF1α was determined on the promoters of several key mesenchymal markers with Pscan software. “Average” represented the average Z‐score of all transcriptional factors tested in with Pscan software (Dataset EV2).
- B
Expression of Hif1α was modulated with overexpression or sh‐RNA‐mediated knockdown via a retrovirus system in MEFs. Oligomycin (1 μM) or 2‐DG (5 mM) was used to treat MEFs. The expression of mesenchymal markers was determined with qPCR on day 3.
- C
The enrichment of binding sites of indicated transcriptional factors was determined on the promoters of several key glycolysis markers. “Max. M” suggested the maximum Z‐score generated with SNAI2, TWIST1/2, and ZEB1 binding sites on one indicated promoter. “Average” suggested the average Z‐score of all transcriptional factors tested in the Pscan software on one indicated promoter.
- D
Expression of Hif1α and key mesenchymal transcriptional factors, including Snai1/2, Twist1/2, and Zeb1/2, was modulated in MEFs. The expression of several key glycolysis markers was determined with qPCR on day 3. “Max. M” indicated the largest upregulation induced by Snai1/2, Twist1/2, and Zeb1/2 on one particular gene.
- E–H
RepSox (1 μM) was used on days 2–7 to inhibit early EMT during reprogramming with 5C medium. TGFβ (TGFβ1/2/3, 1 ng/ml each) on days 2–7, LSD1i (SP2509, 10 nM), and sequential introduction of Yamanaka factors (OK + M + S) were used to induce early EMT during reprogramming with mES medium. Except for OK + M + S group, the four Yamanaka factors were delivered simultaneously. The number of Oct4GFP+ colonies was determined on day 15 (E). The expression of pluripotency markers was determined on day 6 with qPCR (F). Cell migration was determined with live‐cell imaging on day 6 (G). The expression of mesenchymal markers was determined on day 6 with qPCR (H).
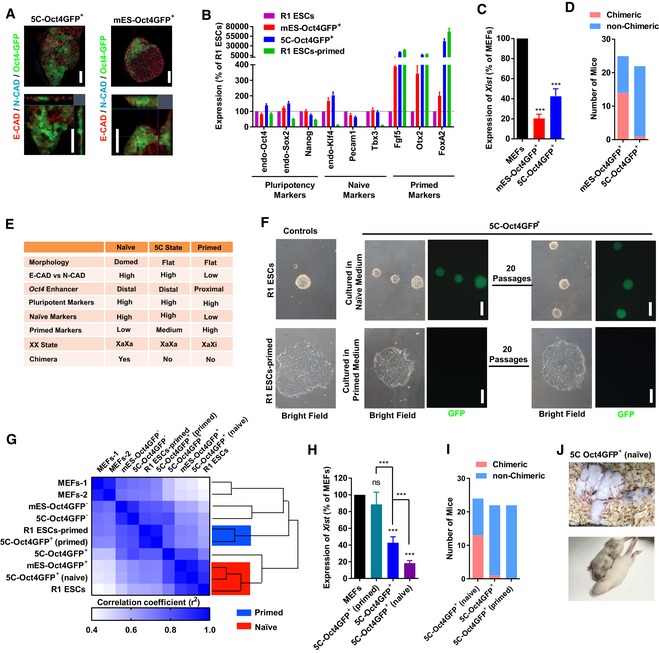
- A–E
On day 15 during reprogramming, the expression of E‐cadherin (E‐CAD) and N‐cadherin (N‐CAD) was determined with immunofluorescence together with the morphology in Oct4GFP+ colonies (A, Scale bar, 25 μM). After sorting Oct4GFP+ cells out (5C‐Oct4GFP+ and mES‐Oct4GFP+ cells), the expression of markers of different pluripotent states (B) and Xist (C), and their abilities to form chimeras (D) were determined. The characteristics of 5C‐Oct4GFP+ cells were summarized and compared to naïve and primed PSCs in (E).
- F
The isolated 5C‐Oct4GFP+ cells were cultured in naïve or primed medium for 3 days, and the morphology changed toward R1 ESCs (naïve PSCs) and R1 ESCs‐primed (primed PSCs), respectively. The obtained cells were maintained for additional 20 passages. The 5C‐Oct4GFP+ cells cultured in primed medium lost GFP fluorescence. R1 ESCs‐primed were primed PSCs generated from R1 ESCs. Scale bar, 100 μM.
- G
PSCs mentioned in (F) were used for RNA‐Seq analysis. Similarity among gene expression profiles was determined.
- H–J
The isolated 5C‐Oct4GFP+ cells were cultured in naïve or primed medium for 3 days to generate 5C‐Oct4GFP+ (naïve) and 5C‐Oct4GFP+ (primed) cells. The expression of Xist (H) and the abilities to form chimeras (I and J) were determined.
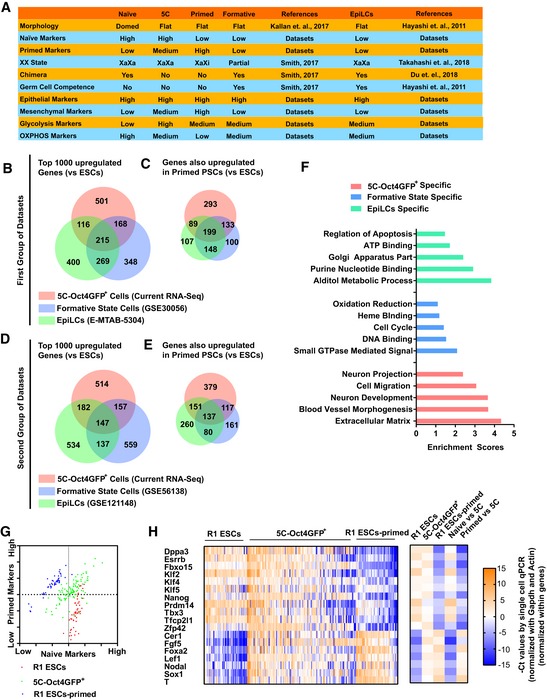
- A
Summary of characteristics of PSCs in 5C state, formative state, and EpiLCs state.
- B, C
Top 1,000 upregulated genes (compared to ESCs) were selected from the current RNA‐Seq and previously reported datasets (Data ref: Hayashi et al, 2011; Data ref: Bertone, 2014) for the three states. The overlapping was determined (B). In addition, the genes which were upregulated in primed PSCs (compared to ESCs, based on the current RNA‐Seq) were further selected and listed in (C).
- D, E
Two different datasets were used to repeat the studies in (B and C) (Data ref: Buecker, 2014; Data ref: Kalkan et al, 2019).
- F
The genes which were only upregulated in one of the three states were used for GO analysis.
- G, H
Single‐cell qPCR was performed with 5C‐Oct4GFP+ cells (120 cells), R1 ESCs (48 cells), and R1 ESCs‐primed (cells). Dppa3, Esrrb, Fbxo15, Klf2/4/5, Nanog, Prdm14, Tbx3, Tfcp2l1, and Zfp42 were used as naive markers, while Cer1, Fgf5, Foxa2, Lef1, Nodal, Sox1, and T were used as primed markers. The average expression of naïve and primed markers was calculated for each cell and was used to plot the cells in (G). Heatmap summarized results (H, left), and the average expression of each gene in 5C‐Oct4GFP+ cells (5C), R1 ESCs (naïve), and R1 ESCs‐primed (primed) was provided and compared (H, right).
- A
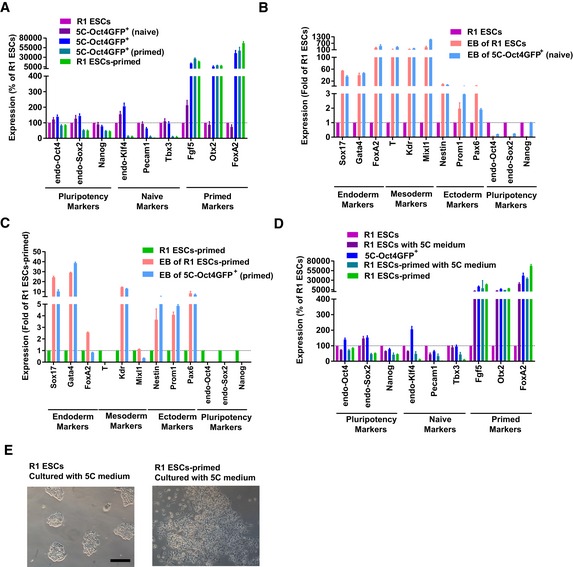
The isolated 5C‐Oct4GFP+ cells were cultured in naïve or primed medium for 3 days. The expression of markers of different pluripotent states was determined with qPCR. R1 ESCs and R1 ESCs‐primed were used as controls.
- B, C
The isolated 5C‐Oct4GFP+ cells were cultured in naïve and primed medium, and the obtained cells were used for EB differentiation. The expression of markers of endoderm, mesoderm, ectoderm, and pluripotency was determined together with R1 ESCs and R1 ESCs‐primed.
- D, E
R1 ESCs and R1 ESCs‐primed were cultured with 5C medium for 3 days, the expression of markers of different pluripotent states was provided in (D), and the morphologies were presented in (E, Scale bar, 100 μM).
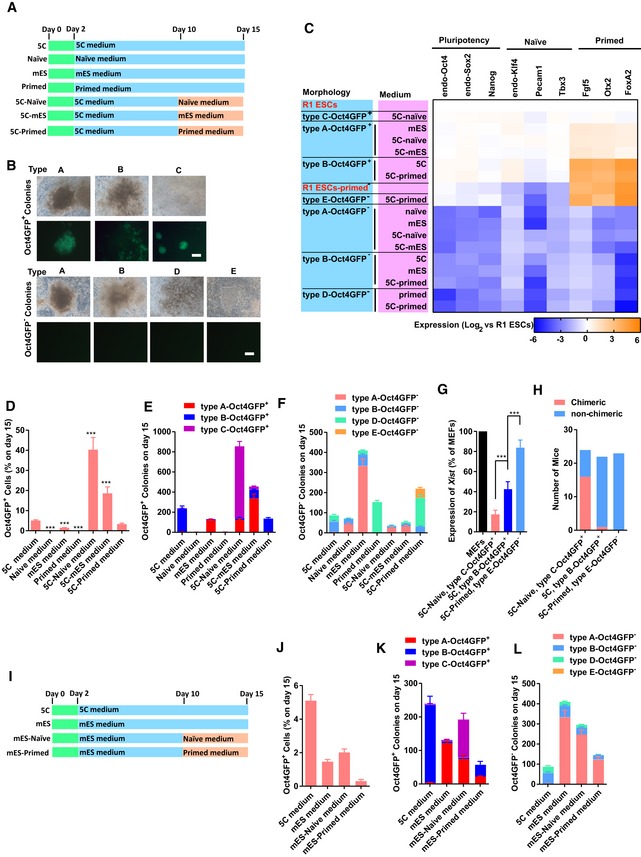
- A–C
MEFs were reprogrammed with 5C, mES, naïve, or primed medium. In three additional groups, mES, naïve, or primed medium was used to replace 5C medium from day 10 (A). The morphology and OCT4 fluorescence of seven types of colonies were provided in (B, Scale bar, 100 μM). These seven types of colonies were isolated on day 15 during reprogramming with different protocols. The expression of markers of different pluripotent states was determined with qPCR in these colonies (C).
- D–H
The percentages of Oct4GFP+ cells (D) and the numbers of seven types of colonies (E and F) were summarized on day 15. The expression of Xist (G) and the abilities to form chimeras (H) were determined in type C‐Oct4GFP+ colonies in 5C‐naïve group, type B‐Oct4GFP+ colonies in 5C group, and type E‐Oct4GFP− colonies in 5C‐primed group.
- I–L
MEFs were reprogrammed with mES medium. Naïve or primed medium was used to replace mES medium from day 10 (I). The percentages of Oct4GFP+ cells (J) and the numbers of seven types of colonies (K and L) were summarized on day 15.
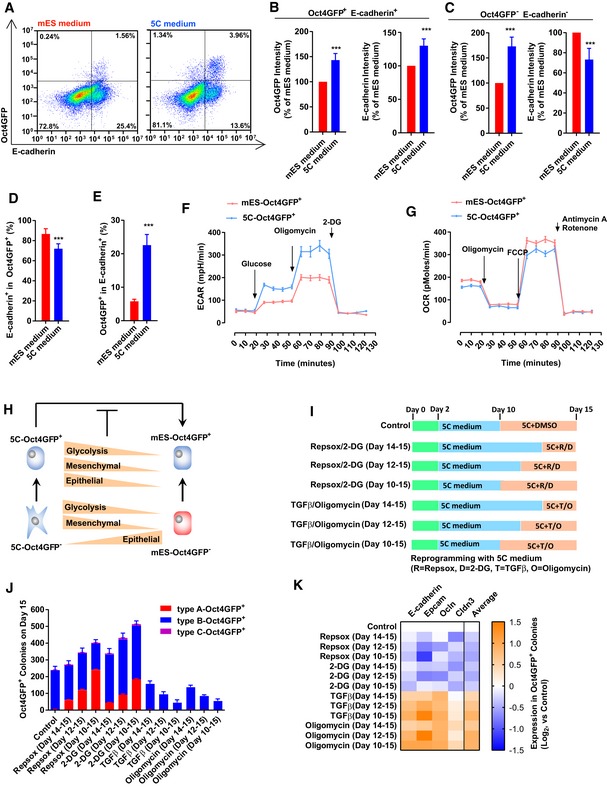
- A–E
The expression Oct4GFP and E‐cadherin was determined with FACS on day 15 during reprogramming (A). Based on the FACS results, the expression of Oct4GFP and E‐cadherin was summarized in Oct4GFP+E‐cadherin+ cells (B) and in Oct4GFP−E‐cadherin− cells (C). The percentage of E‐cadherin+ cells in Oct4GFP+ cells was listed in (D), while the percentage of Oct4GFP+ cells in E‐cadherin+ cells was listed in (E).
- F, G
Energy metabolism was analyzed in 5C‐Oct4GFP+ and mES‐Oct4GFP+ cells with Seahorse instrument.
- H
5C‐Oct4GFP− cells had higher expression of glycolysis and mesenchymal markers, but lower expression of epithelial markers than mES‐Oct4GFP− cells. 5C‐Oct4GFP+ cells had higher expression of all three groups of markers than mES‐Oct4GFP+ cells.
- I–K
EMT and OGS were modulated with TGFβ (TGFβ1/2/3, 1 ng/ml each), RepSox (1 μM), oligomycin (1 μM), and 2‐DG (5 mM) at the late stage during reprogramming with 5C medium (I). The numbers of three types of Oct4GFP+ colonies (J) and the expression of four epithelial markers in Oct4GFP+ cells (K) were determined on day 15. “Average” in (K) suggested the average expression of four epithelia markers.
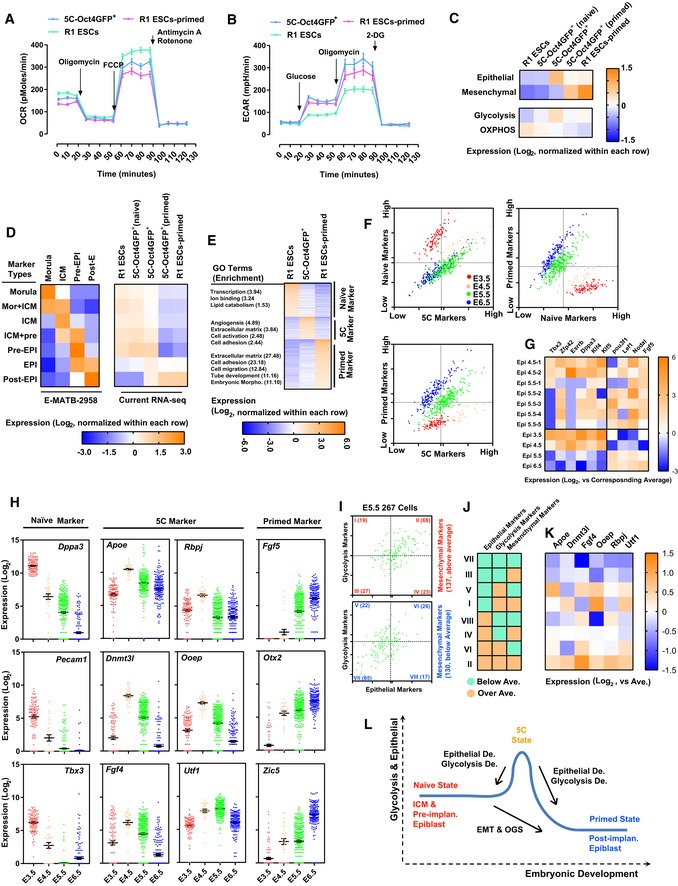
- A, B
Energy metabolism was analyzed with 5C‐Oct4GFP+, R1 ESCs (naïve PSCs), and R1 ESCs‐primed (primed PSCs) with Seahorse instrument.
- C
Expression of epithelial, mesenchymal, glycolysis, and oxidative phosphorylation (OXPHOS) markers (listed in Dataset EV4) was summarized in R1 ESCs, 5C‐Oct4GFP+ (naïve), 5C‐Oct4GFP+, 5C‐Oct4GFP+ (primed), and R1 ESCs‐primed, based on the current RNA‐Seq. For each marker, Log2 values of FKPM were normalized by subtracting the average of five groups. Log2 values of FKPM of each group of markers were then averaged and plotted. 5C‐Oct4GFP+ (naïve) and 5C‐Oct4GFP+ (primed) were 5C‐Oct4GFP+ cultured in naïve and primed medium, respectively, for 3 days.
- D
Genes with higher expression at different developmental stages were selected out from previously reported RNA‐Seq (Data ref: Bertone, 2015). “Mor”, “ICM”, “pre‐EPI”, and “post‐EPI” represented genes that have high expression only in morula, inner cell mass, pre‐implantation epiblast, and postimplantation epiblast, respectively. “Mor + ICM”, “ICM + pre”, and “EPI” indicated genes that have high expression in both morula and inner cell mass, in both inner cell mass and pre‐implantation epiblast, and in both pre‐implantation and postimplantation epiblast, respectively. The results of previously reported RNA‐Seq were summarized in the left panel, while the expression of these genes in current RNA‐Seq was summarized in the right panel. Log2 values of FKPM were presented similarly as in (C).
- E
Markers of 5C, naïve and primed states were selected based on the current RNA‐Seq (Dataset EV4). The expression of these markers in R1 ESCs, 5C‐Oct4GFP+, and R1 ESCs‐primed was listed together with the GO enrichment of each group of markers. Log2 values of FKPM were presented similarly as in (C).
- F
Markers of 5C, naïve, and primed states (Dataset EV4) were used to analyze expression profiles of epiblast during the early development of mouse embryos (Data ref: Mohammed et al, 2017). Single cell was plotted based on the average expression of each group of markers.
- G
The average expression of both naïve and primed markers was calculated based on GSE100597. The top two cells from E4.5 epiblast and top five cells from E5.5 epiblast were selected. The expression of several naïve markers (Dppa3, Esrrb, Klf4, Klf5, Tbx3, and Zfp42) and several mesenchymal markers (Fgf5, Lef1, Nodal, and Pou3f1) in these selected cells were listed (upper part). The average expression of these genes in E3.5, 4.5, 5.5, and 6.5 epiblast was also listed (lower part). These results were all normalized against the average expression of these genes in all tested cells.
- H
The expression of representative markers of 5C, naïve, and primed states was summarized in E3.5, 4.5, 5.5, and 6.5 epiblast.
- I–K
Cells from E5.5 epiblast were separated into eight groups (I–VIII) based on the average expression of epithelial, mesenchymal, and glycolysis markers (H). The average expression of three groups of markers was summarized in (J). The expression of six important markers of 5C state was summarized in these eight groups of cells (K)
- L
Schematic illustration of different pluripotent states and developmental stages.
References
-
- Behringer R, Gertsenstein M, Nagy K, Nagy A (2013) Manipulating the mouse embryo: a laboratory manual, 4th edn Cold Spring Harbor, NY: Cold Spring Harbor Laboratory Press;
-
- Bertone P (2014) ArrayExpress Archive of Functional Genomics Data E‐MTAB‐5304(https://www.ebi.ac.uk/arrayexpress/experiments/E-MTAB-5304/). [DATASET]
-
- Bertone P (2015) ArrayExpress Archive of Functional Genomics Data E‐MTAB‐2958 (https://www.ebi.ac.uk/arrayexpress/experiments/E-MTAB-2958/). [DATASET]
Publication types
MeSH terms
Associated data
- Actions
- Actions
- Actions
- Actions
- Actions
- Actions
- Actions
- Actions
- Actions
- Actions
Grants and funding
- XDA16010305/Chinese Academy of Sciences/International
- QYZDB-SSW-SMC031/Chinese Academy of Sciences/International
- U1601228/National Natural Science Foundation of China/International
- 31671475/National Natural Science Foundation of China/International
- 31421004/National Natural Science Foundation of China/International
- 31900699/National Natural Science Foundation of China/International
- 81702445/National Natural Science Foundation of China/International
- 2017B030314056/Guangdong Science and Technology Department/International
- 2018GZR110104008/Guangzhou Regenerative Medicine and Health Guangdong Laboratory/International
LinkOut - more resources
Full Text Sources
Molecular Biology Databases
