

Bile canaliculi remodeling activates YAP via the actin cytoskeleton during liver regeneration
- PMID: 32090478
- PMCID: PMC7036714
- DOI: 10.15252/msb.20198985
Bile canaliculi remodeling activates YAP via the actin cytoskeleton during liver regeneration
Abstract
The mechanisms of organ size control remain poorly understood. A key question is how cells collectively sense the overall status of a tissue. We addressed this problem focusing on mouse liver regeneration. Using digital tissue reconstruction and quantitative image analysis, we found that the apical surface of hepatocytes forming the bile canalicular network expands concomitant with an increase in F-actin and phospho-myosin, to compensate an overload of bile acids. These changes are sensed by the Hippo transcriptional co-activator YAP, which localizes to apical F-actin-rich regions and translocates to the nucleus in dependence of the integrity of the actin cytoskeleton. This mechanism tolerates moderate bile acid fluctuations under tissue homeostasis, but activates YAP in response to sustained bile acid overload. Using an integrated biophysical-biochemical model of bile pressure and Hippo signaling, we explained this behavior by the existence of a mechano-sensory mechanism that activates YAP in a switch-like manner. We propose that the apical surface of hepatocytes acts as a self-regulatory mechano-sensory system that responds to critical levels of bile acids as readout of tissue status.
Keywords: YAP; actin cytoskeleton; bile canaliculi; liver regeneration; mechano-sensing.
© 2020 The Authors. Published under the terms of the CC BY 4.0 license.
Conflict of interest statement
The authors declare that they have no conflict of interest.
Figures
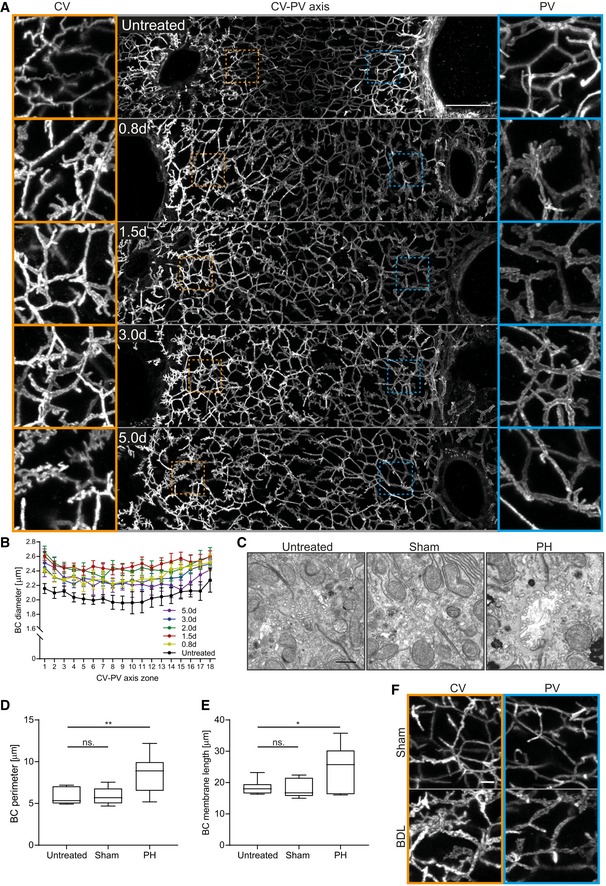
- A
Fluorescence staining for the apical marker CD13 on liver tissue sections from untreated mice or animals at indicated time points post‐PH. Shown are maximum projections of 50 μm z‐stacks covering an entire CV‐PV axis (CV, left; PV, right). Indicated regions of the CV (orange) and PV (blue) areas are shown as magnifications on the left and right, respectively.
- B
Quantification of BC diameter within 18 zones along the CV‐PV axis (zone 1, peri‐central; zone 18, peri‐portal) in livers from untreated animals or mice at indicated time points post‐PH. The diameter was measured from 3D BC network reconstructions of IF image stacks of CD13 as shown in (A). The zones directly adjacent to the CV and PV were excluded from the analysis (˜ 1 cell layer). Mean ± s.e.m, n = 3–6 mice per time point. BC diameter of untreated mice vs. 0.8 day, P = 1.62*10−11; untreated mice vs. 1.5 days, P = 1.18*10−12; untreated mice vs. 2.0 days, P = 5.69*10−11; untreated mice vs. 3.0 days, P = 6.92*10−12; and untreated mice vs. 5.0 days, P = 1.65*10−7.
- C
EM images of BC on liver tissue sections of untreated mice (left) and 1.8 days after sham OP (middle) or PH (right).
- D, E
Quantification of BC perimeter (D) and total BC membrane length (E) from EM images as representatively shown in (C). Box–whisker plot with median, 25–75 quartiles, and minimum/maximum error bars, n = 5–6 mice per condition. In (D), BC perimeter of untreated vs. sham condition, P = 0.94 (n.s.); untreated vs. PH condition, P = 0.01. In (E), BC membrane length of untreated vs. sham condition, P = 0.86 (n.s.); untreated vs. PH condition, P = 0.03.
- F
IF stainings of the apical marker CD13 on liver tissue sections from livers at 1 day after sham OP or BDL. Shown are maximum projections of 50 μm z‐stacks in the CV (left, orange) and PV (right, blue) region. Images in (A) and (F) are background‐subtracted.
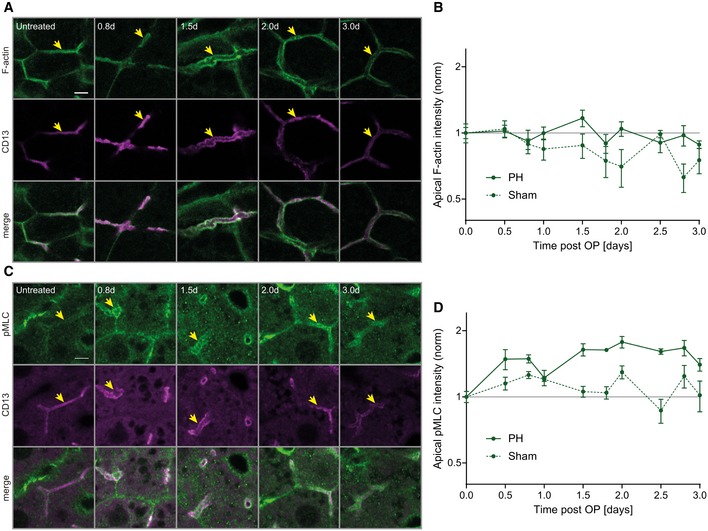
- A–D
Fluorescence stainings for F‐actin (A) or pMLC (C) and the apical marker CD13 in the PV area on liver tissue sections from untreated mice or animals at indicated time points post‐PH. Arrows indicate BC. Scale bar, 5 μm. Quantification of apical F‐actin (B) and pMLC (D) intensity from images as representatively shown in (A and C) as well as Appendix Fig S2A and B, at indicated time points after PH (solid line) or sham OP (dashed line). Data are normalized to untreated animals (time point 0). Mean ± s.e.m, n = 3–5 (B) and n = 2–5 (D) mice per time point. Apical F‐actin of sham vs. PH time course, P = 0.03; apical pMLC of sham vs. PH time course, P = 0.003.
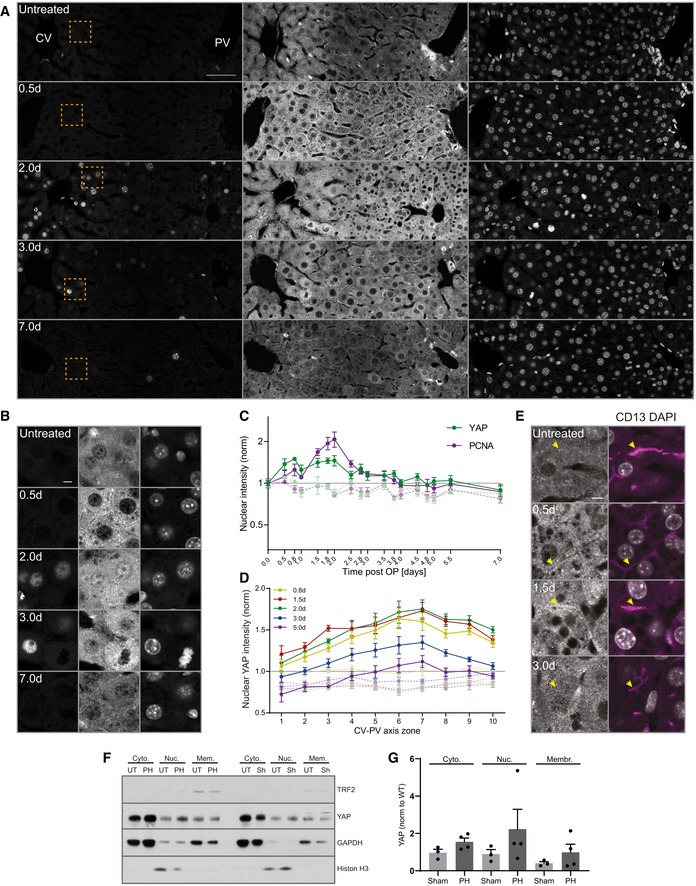
- A, B
Fluorescence stainings for YAP and PCNA and with the nuclear marker DAPI on liver tissue sections from untreated mice and animals at indicated time points post‐PH. Images show an entire CV‐PV axis (CV, left; PV, right). Indicated regions (orange squares) are shown as magnifications in (B). Note, the bright YAP fluorescence in the PV area stem from cholangiocytes of the bile duct.
- C
Quantification of the mean nuclear YAP (green) and PCNA (magenta) intensity from images of liver tissue sections at indicated time points after PH (solid line) and sham OP (dashed line) as representatively shown in (A) and Appendix Fig S4A. Data were normalized to untreated animals (time point 0). Mean ± s.e.m, n = 3–5 mice per time point. Nuclear YAP intensity of PH vs. sham time course, P = 2.97*10−5. Nuclear PCNA intensity of PH vs. sham time course, P = 7.51*10−6.
- D
Spatial analysis of the mean nuclear YAP intensity from images as representatively shown in (A) and Appendix Fig S4A, at indicated time points after PH (solid line) or sham OP (dashed line) in 10 zones within the CV‐PV axis (zone 1, CV area; zone 10, PV area). Data are normalized to untreated animals (not shown). Mean ± s.e.m, n = 3–5 mice per time point. Nuclear YAP intensity of sham vs. PH mice at 0.8 day, P = 5.35*10−5; 1.5 days, P = 3.95*10−5; 2 days, P = 5.99*10−5; 3 days, P = 2.16*10−5; and 5 days, P = 0.01.
- E
Fluorescence stainings for YAP and CD13 and with the nuclear marker DAPI on liver tissue sections from an untreated mouse or animals at indicated time points post‐PH. Arrows indicate BC. Note the enrichment of apical YAP at 0.5 and 1.5 days post‐PH.
- F
Fractionation of liver tissue at 2 days after PH or sham (Sh) OP and untreated (UT) mice for nuclear (Nuc), cytoplasmic (Cyto), and membrane (Mem) fraction. TRF2, transferrin receptor 2 (membrane marker); histone H3 (nuclear marker); GAPDH, glyceraldehyde 3‐phosphate dehydrogenase (cytoplasmic marker).
- G
Quantification of YAP in the nuclear, cytoplasmic, and membrane fraction from immunoblots as representatively shown in (f). YAP signal is normalized to the fraction marker (GAPDH, cytoplasm; histone H3, nuclei; and TRF2, membrane) and to the untreated condition (not shown). n = 3 (sham) or 4 (PH); data are shown as mean ± s.e.m. Differences between sham and PH conditions for cytoplasmic, nuclear, and membrane fractions are not significant.
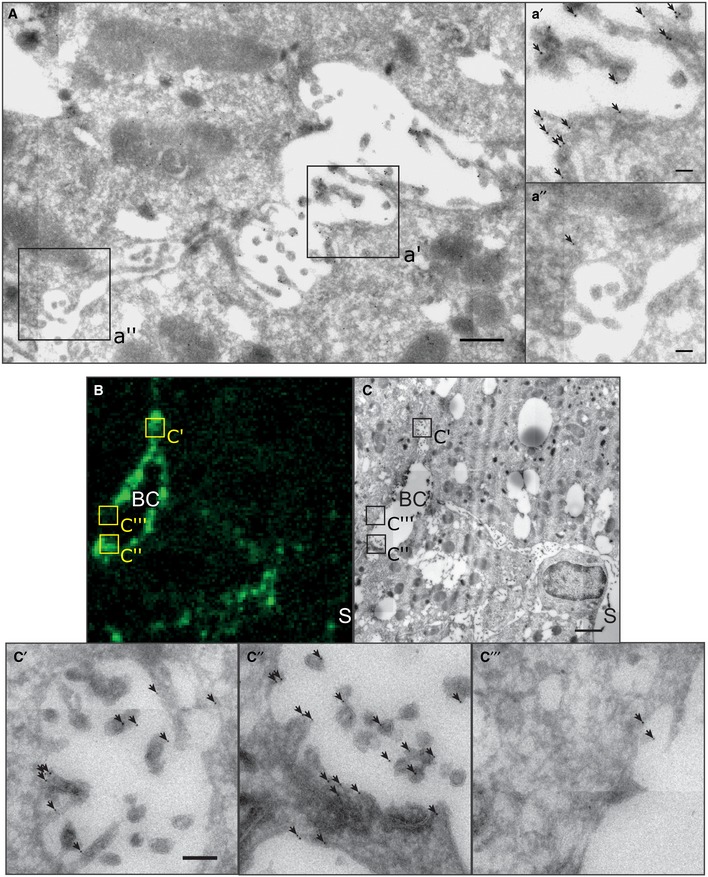
- A
EM image of immunogold‐labeled YAP on liver tissue sections at 1.8 days post‐PH. Image (A) shows a BC in between two hepatocytes. Indicated regions (black squares) of the apical (a′) and the basolateral (a″) membrane of the hepatocyte are shown as magnification. Arrows indicate gold particles.
- B, C
Correlative light and electron microcopy of F‐actin (B) and YAP (C) on a liver tissue section at 1.8 days post‐PH. YAP was detected by immunogold labeling and F‐actin by fluorescence staining with phalloidin. Indicated BC regions with high (c′, c″) or low (c‴) F‐actin levels are shown as magnifications. Arrows indicate gold particles.
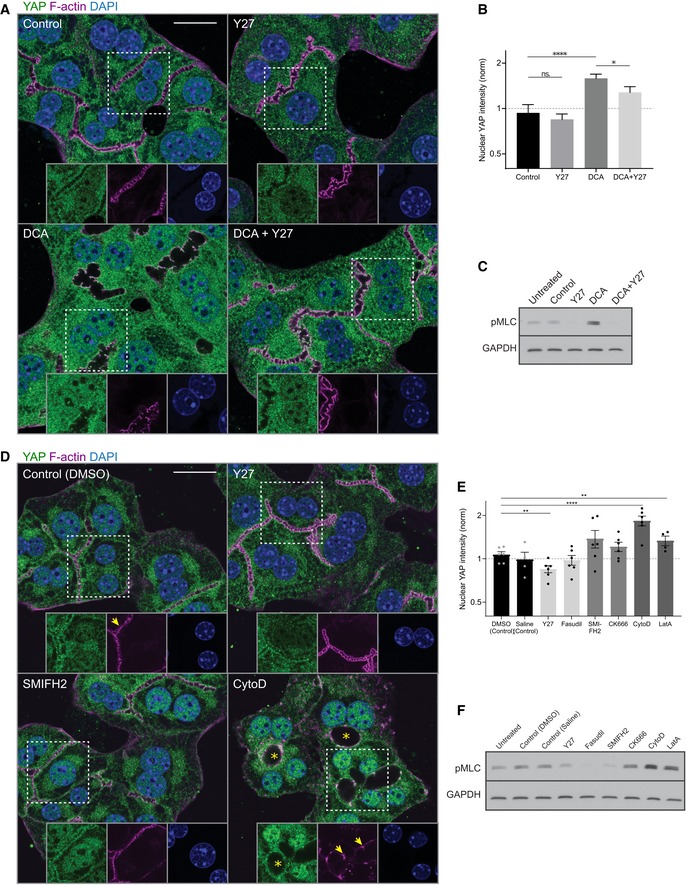
Fluorescence stainings for YAP (green) and F‐actin (magenta) and with the nuclear marker DAPI (blue) of primary hepatocyte cultures treated with DMSO (control), Y27, deoxycholic acid (DCA), or DCA + Y27 for ˜ 18 h. Indicated areas (dashed rectangle) are shown as magnifications in insets.
Quantification of the mean nuclear YAP intensity from fluorescence images of primary hepatocytes treated with DMSO (control), Y27, DCA, or DCA + Y27 for ˜ 18 h as representatively shown in (A). Data are normalized to untreated cells (not shown). Mean ± s.e.m., n = 7; DCA vs. DMSO, P = 8.98*10−5 (****); DCA + Y27 vs. DMSO, P = 0.05; Y27 vs. DMSO, P = 0.55 (n.s.); DCA + Y27 vs. DCA, P = 0.05 (*), t‐test.
Western blot of pMLC and GAPDH (loading control) of primary hepatocyte culture lysates. Cells were untreated or incubated for 18 h with the indicated compounds
Fluorescence stainings of primary hepatocytes for YAP (green) and F‐actin (magenta) and with the nuclear marker DAPI (blue). Cells were treated with DMSO (control), Y27, SMIFH2, or cytochalasin D (CytoD) for 6 h. Indicated areas (dashed rectangle) are shown as magnifications in insets. Note the dilation of canaliculi (asterisks) and fragmentation of F‐actin (arrows) upon CytoD treatment.
Quantification of the mean nuclear YAP intensity from images of primary hepatocytes treated with DMSO, saline, Y27, fasudil, SMIFH2, CK666, CytoD, or latrunculin A (LatA) for 6 h. Saline serves as control for fasudil, and DMSO serves as control for all other conditions. Inhibitors affecting similar actin processes are displayed in the same gray level. Saline, fasudil, CK666, and LatA conditions are not shown in (D). Data are normalized to untreated cells (not shown). Mean ± s.e.m., n = 3–5; DMSO vs. Y27, P = 0.002 (**); DMSO vs. CytoD, P = 5.11*10−7 (****); DMSO vs. LatA, P = 0.01 (**); DMSO vs. CK666, P = 0.15 (n.s.); DMSO vs. SMIFH2, P = 0.11 (n.s.); saline vs. fasudil, P = 0.92, t‐test.
Western blot of pMLC and GAPDH (loading control) in untreated or actin inhibitor‐treated primary hepatocyte culture lysates. Inhibitor treatments are the same as in (E).
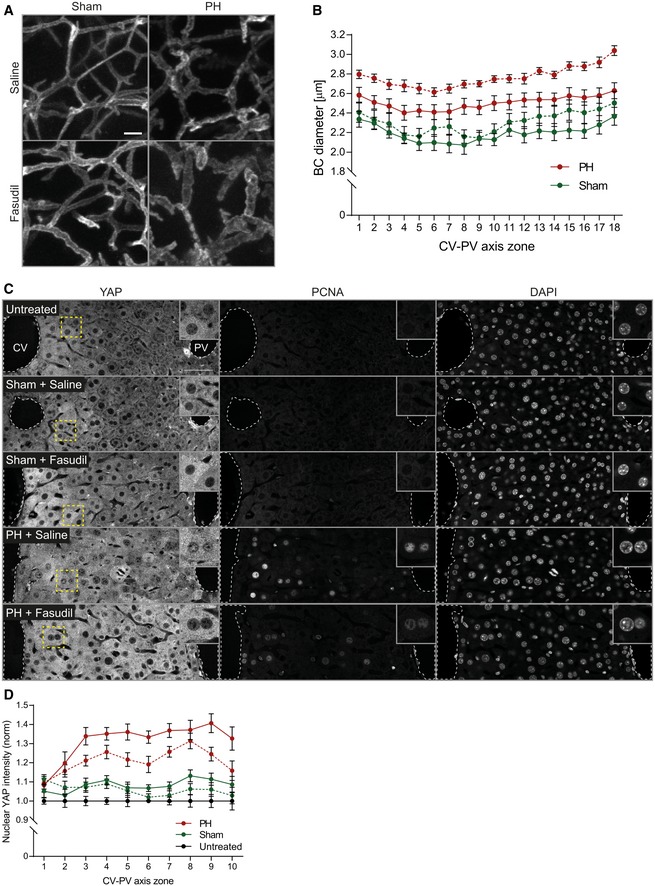
Fluorescence stainings for the apical marker CD13 on liver tissue sections from mice at 2 days after sham OP or PH, treated with saline (control) or the Rho kinase inhibitor fasudil for 1 h. Shown are maximum projections of 50‐μm stacks in the PV area.
Quantification of BC diameter within 18 zones along the CV‐PV axis (zone 1, peri‐central; zone 18, peri‐portal) from mice at 2 days after sham OP (green) or PH (red), treated with saline (control, solid line) or fasudil (dashed line). Diameter was measured from 3D BC network reconstructions of image stacks as representatively shown in (A). The zones directly adjacent to the CV and PV were excluded from the analysis (˜ 1 cell layer). Mean ± s.e.m, n = 7–8 mice per condition from three independent experiments. BC diameter of sham‐operated mice treated with saline vs. fasudil, P = 6.59*10−8; BC diameter of PH mice treated with saline vs. fasudil, P = 2.31*10−14.
Fluorescence stainings for YAP and PCNA and with the nuclear marker DAPI on liver tissue sections from untreated mice or animals at 2 days after sham OP or PH, treated with saline (control) or fasudil for 1 h. Indicated regions (dashed rectangle) are shown as magnifications in insets.
Quantification of the mean nuclear YAP intensity within 10 zones along the CV‐PV axis, (zone 1, peri‐central; zone 10, peri‐portal) from IF images as representatively shown in (C). Data were normalized to untreated animals. Mean ± s.e.m, n = 7–8 mice per condition from three independent experiments. Nuclear YAP intensity of sham‐operated mice treated with saline vs. fasudil, P = 0.13 (n.s.); nuclear YAP intensity of PH mice treated with saline vs. fasudil, P = 0.0004.

Model of YAP regulation by mechanical stimulation through expansion of the BC. Arrows denote reactions or transport steps. Blue numbers label individual processes and associated parameters as listed in Appendix Table S4. The pathway combines a signaling cascade with regulated cytoplasmic retention and is here illustrated based on inactivation by a mechano‐sensor, SENSOR; inactSENSOR, inactivated mechano‐sensor; inactYAP, inactivated YAP; SF, sequestration factor; but alternative molecular states are possible. See Supplementary Experimental Procedures for model equations and analysis.
Model prediction (solid black line) of cortical tension and strain and nuclear YAP levels reveals a sigmoidal stimulus‐response curve. Experimental data (symbols, shown as mean ± s.e.m.) of nuclear YAP are reproduced from Fig 3D and mapped to cortical tension and strain levels using experimental data from Figs 1B and 2D. For details see legend of Figs 1B, 2D, and 3D.
Schematic drawing of YAP regulation by BA through canalicular cortical tension and strain. Tissue resection by partial hepatectomy induces a BA overload which elevates osmotic pressure and cortical tension of bile canaliculi. Concomitant changes of apical acto‐myosin properties recruit YAP to the apical cortex where it is activated for nuclear translocation.
Similar articles
-
F-actin dynamics regulates mammalian organ growth and cell fate maintenance.J Hepatol. 2019 Jul;71(1):130-142. doi: 10.1016/j.jhep.2019.02.022. Epub 2019 Mar 14. J Hepatol. 2019. PMID: 30878582
-
YAP Nuclear Localization in the Absence of Cell-Cell Contact Is Mediated by a Filamentous Actin-dependent, Myosin II- and Phospho-YAP-independent Pathway during Extracellular Matrix Mechanosensing.J Biol Chem. 2016 Mar 18;291(12):6096-110. doi: 10.1074/jbc.M115.708313. Epub 2016 Jan 12. J Biol Chem. 2016. PMID: 26757814 Free PMC article.
-
Caveolin-1 Modulates Mechanotransduction Responses to Substrate Stiffness through Actin-Dependent Control of YAP.Cell Rep. 2018 Nov 6;25(6):1622-1635.e6. doi: 10.1016/j.celrep.2018.10.024. Cell Rep. 2018. PMID: 30404014 Free PMC article.
-
Regulation of Hippo signaling by actin remodeling.BMB Rep. 2018 Mar;51(3):151-156. doi: 10.5483/bmbrep.2018.51.3.012. BMB Rep. 2018. PMID: 29353600 Free PMC article. Review.
-
[Bile acids in the process of canalicular bile formation].Fiziol Zh (1994). 2003;49(6):80-93. Fiziol Zh (1994). 2003. PMID: 14965044 Review. Ukrainian.
Cited by
-
Hepatocyte differentiation requires anisotropic expansion of bile canaliculi.Development. 2024 Nov 15;151(22):dev202777. doi: 10.1242/dev.202777. Epub 2024 Nov 21. Development. 2024. PMID: 39373104 Free PMC article.
-
A wall-time minimizing parallelization strategy for approximate Bayesian computation.PLoS One. 2024 Feb 22;19(2):e0294015. doi: 10.1371/journal.pone.0294015. eCollection 2024. PLoS One. 2024. PMID: 38386671 Free PMC article.
-
Fibrillar Collagen Type I Participates in the Survival and Aggregation of Primary Hepatocytes Cultured on Soft Hydrogels.Biomimetics (Basel). 2020 Jun 25;5(2):30. doi: 10.3390/biomimetics5020030. Biomimetics (Basel). 2020. PMID: 32630500 Free PMC article.
-
Hepatic lipid overload triggers biliary epithelial cell activation via E2Fs.Elife. 2023 Mar 6;12:e81926. doi: 10.7554/eLife.81926. Elife. 2023. PMID: 36876915 Free PMC article.
-
Core Hippo pathway components act as a brake on Yap and Taz in the development and maintenance of the biliary network.Development. 2020 Jun 22;147(12):dev184242. doi: 10.1242/dev.184242. Development. 2020. PMID: 32439761 Free PMC article.
References
-
- Aragona M, Panciera T, Manfrin A, Giulitti S, Michielin F, Elvassore N, Dupont S, Piccolo S (2013) A mechanical checkpoint controls multicellular growth through YAP/TAZ regulation by actin‐processing factors. Cell 154: 1047–1059 - PubMed
-
- Boxenbaum H (1980) Interspecies variation in liver weight, hepatic blood flow, and antipyrine intrinsic clearance: Extrapolation of data to benzodiazepines and phenytoin. J Pharmacokinet Biopharm 8: 165–176 - PubMed
Publication types
MeSH terms
Substances
LinkOut - more resources
Full Text Sources
Molecular Biology Databases
