. 2020 Feb 24;9(1):439-456.
doi: 10.1080/22221751.2020.1722758. eCollection 2020.

Swine acute diarrhea syndrome coronavirus-induced apoptosis is caspase- and cyclophilin D- dependent

Affiliations

Swine acute diarrhea syndrome coronavirus-induced apoptosis is caspase- and cyclophilin D- dependent

Jiyu Zhang et al. Emerg Microbes Infect. .

Abstract

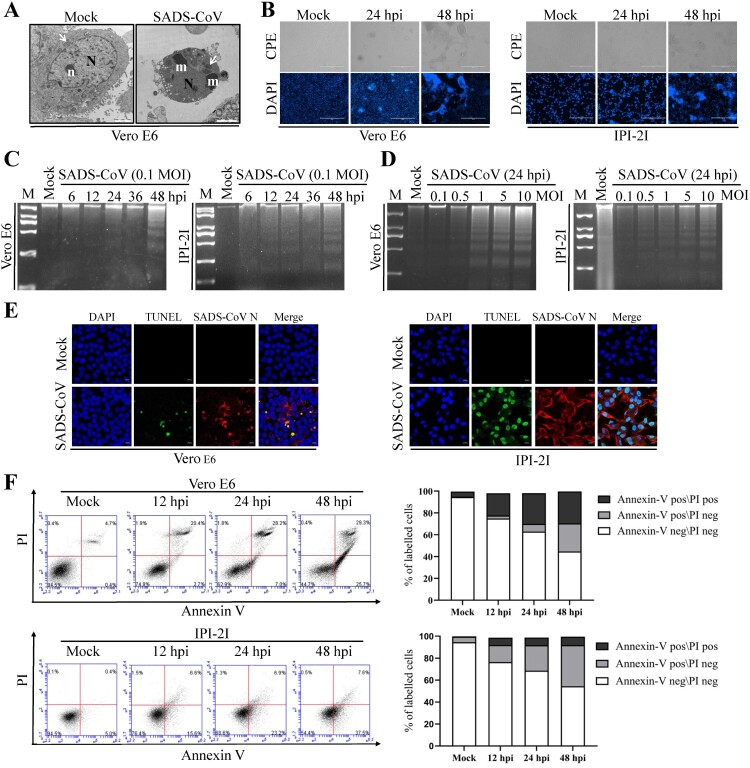
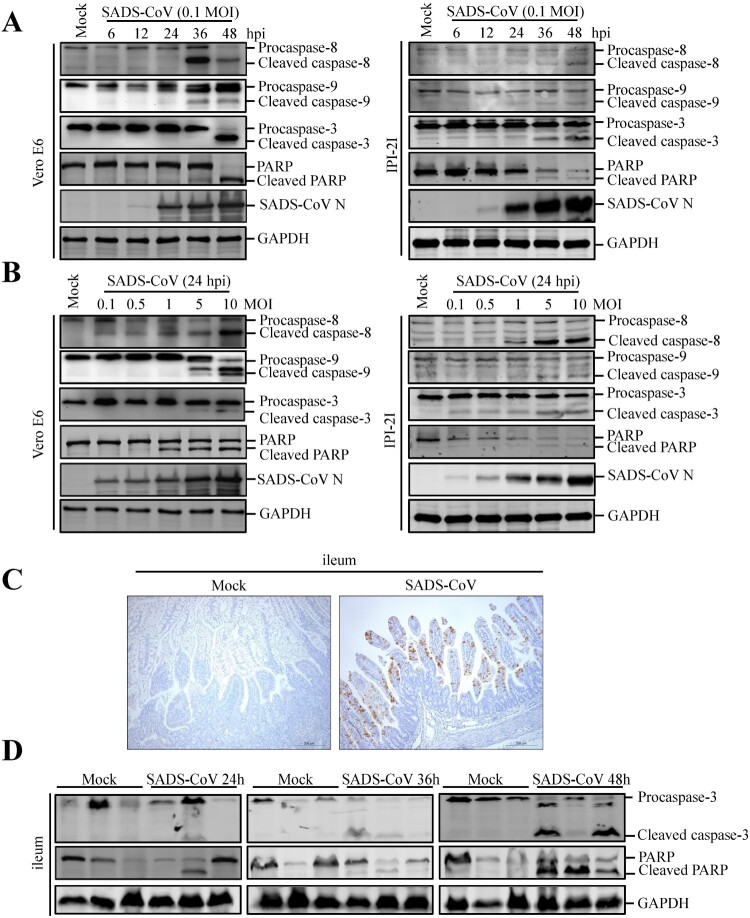
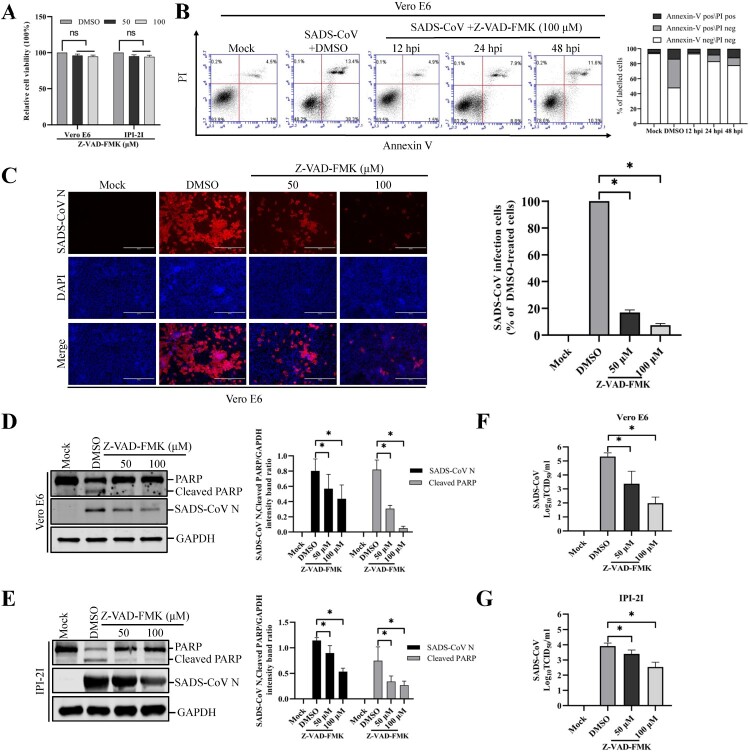
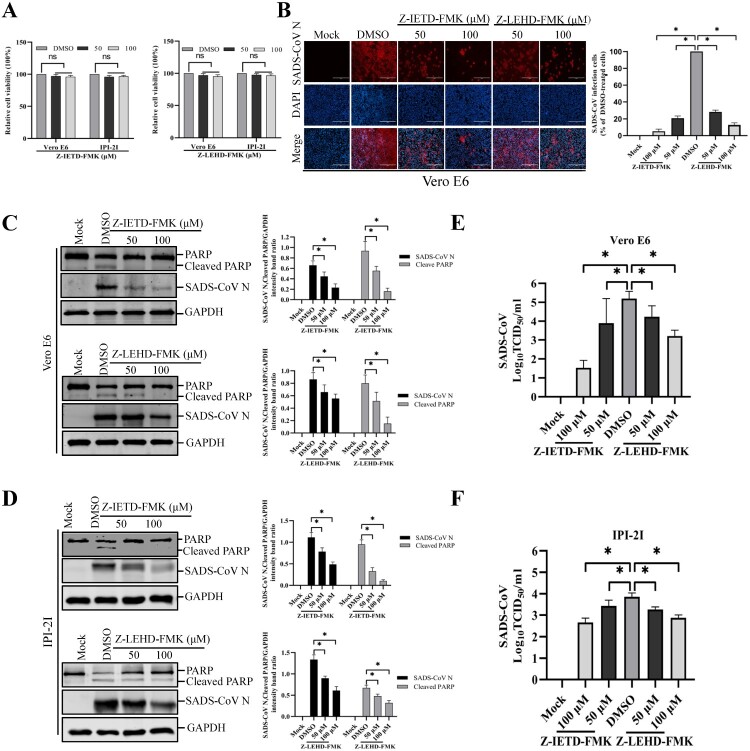
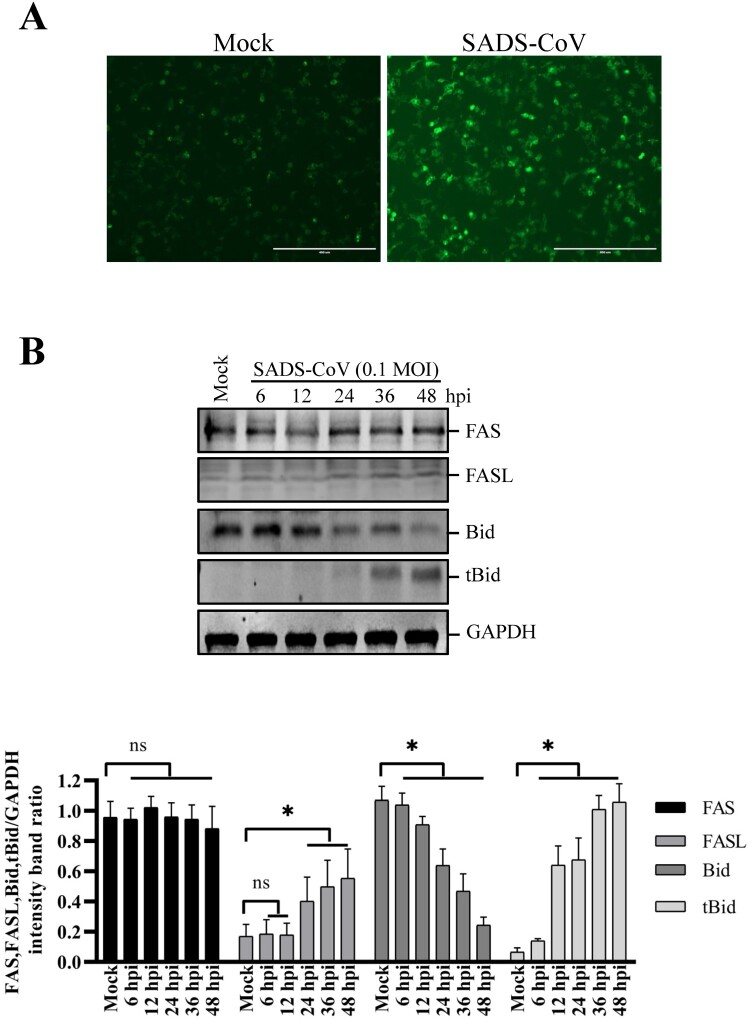
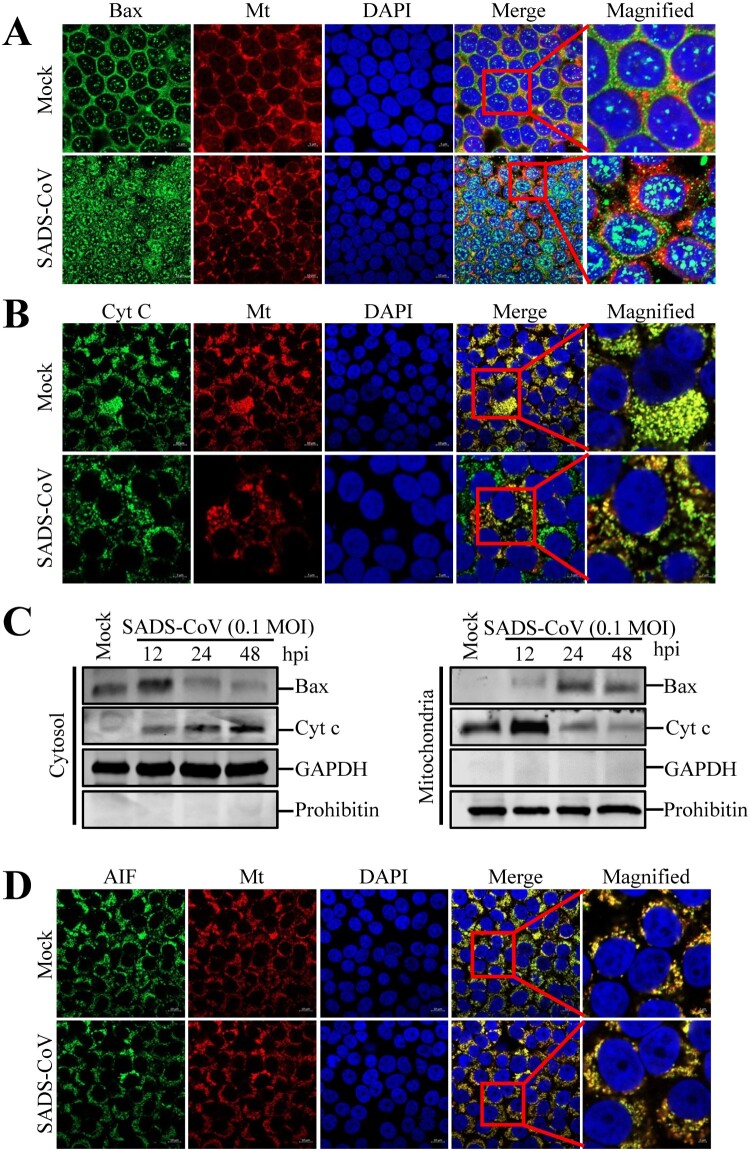
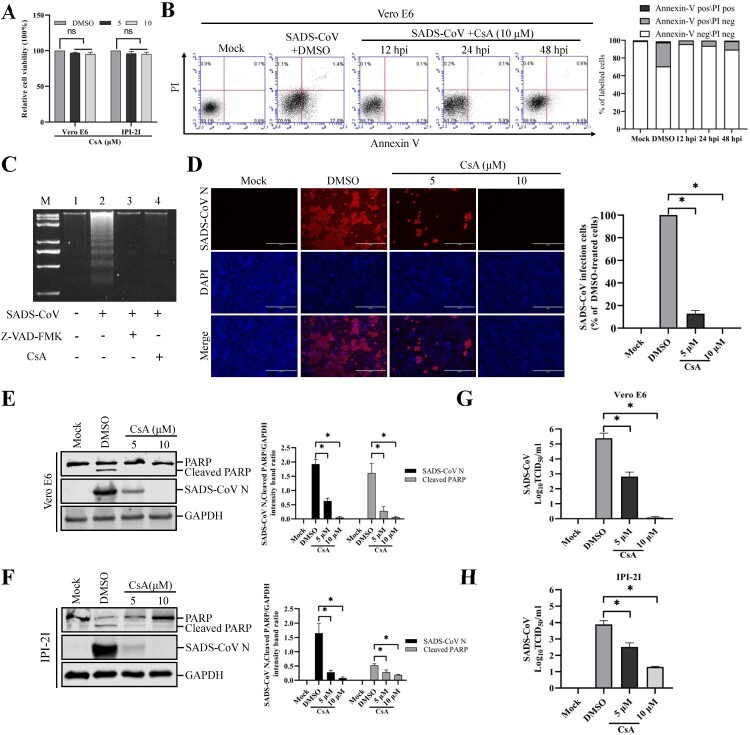
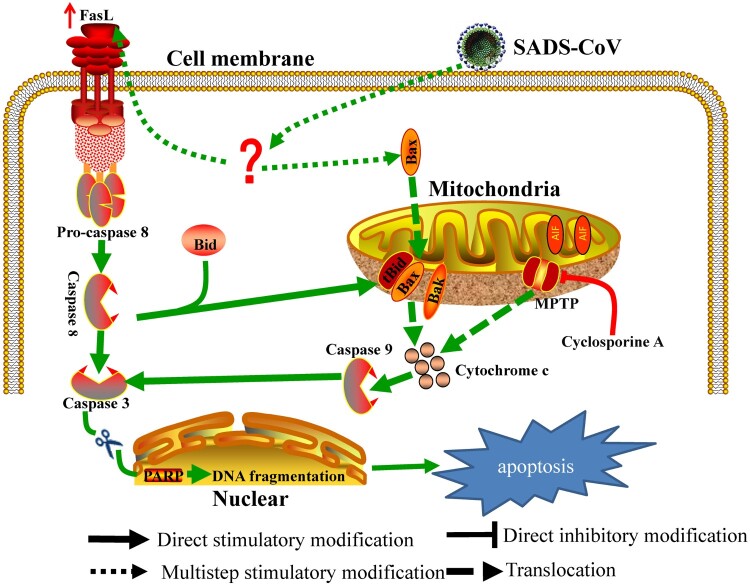
Swine acute diarrhea syndrome coronavirus (SADS-CoV), a newly discovered enteric coronavirus, is the aetiological agent that causes severe clinical diarrhea and intestinal pathological damage in piglets. To understand the effect of SADS-CoV on host cells, we characterized the apoptotic pathways and elucidated mechanisms underlying the process of apoptotic cell death after SADS-CoV infection. SADS-CoV-infected cells showed evidence of apoptosis in vitro and in vivo. The use of a pan-caspase inhibitor resulted in the inhibition of SADS-CoV-induced apoptosis and reduction in SADS-CoV replication, suggestive of the association of a caspase-dependent pathway. Furthermore, SADS-CoV infection activated the initiators caspase-8 and -9 and upregulated FasL and Bid cleavage, demonstrating a crosstalk between the extrinsic and intrinsic pathways. However, the proapoptotic proteins Bax and Cytochrome c (Cyt c) relocalized to the mitochondria and cytoplasm, respectively, after infection by SADS-CoV. Moreover, Vero E6 and IPI-2I cells treated with cyclosporin A (CsA), an inhibitor of mitochondrial permeability transition pore (MPTP) opening, were completely protected from SADS-CoV-induced apoptosis and viral replication, suggesting the involvement of cyclophilin D (CypD) in these processes. Altogether, our results indicate that caspase-dependent FasL (extrinsic)- and mitochondria (intrinsic)- mediated apoptotic pathways play a central role in SADS-CoV-induced apoptosis that facilitates viral replication. In summary, these findings demonstrate mechanisms by which SADS-CoV induces apoptosis and improve our understanding of SADS-CoV pathogenesis.

Keywords: SADS-CoV; apoptosis; apoptosis-inducing factor; pathogenesis.


Conflict of interest statement

No potential conflict of interest was reported by the author(s).

Figures

Figure 1.
Figure 1.
SADS-CoV infection induces apoptosis in vitro. (A) Electron micrographs of mock-infected and SADS-CoV-infected Vero E6 cells at 36 hpi. In mock-infected cells (Mock), the round nuclei (N) displays a large, unique, electron-dense nucleolus (n). Mitochondria (arrowheads) are dispersed within the cytoplasm. SADS-CoV-infected cells (SADS-CoV) are characterized by numerous masses of condensed chromatin (m) dispersed at the periphery of a convoluted nucleus (N) and swollen mitochondria (arrowheads) (Bar: 2 μm). (B) Morphological changes in SADS-CoV-infected Vero E6 and IPI-2I cells. Cells were mock or SADS-CoV infected, stained with DAPI at 24 and 48 hpi, and viewed under a light microscope. Phase-contrast images; DAPI, nuclear staining. (C and D) DNA fragmentation in SADS-CoV-infected cells. DNA isolated from SADS-CoV-infected Vero E6 and IPI-2I cells was resolved by 1.5% agarose gel electrophoresis, followed by visualization of bands and photography. Lane M, 2 kb DNA molecular weight marker. Lane mock (Fig.1C), sham-infected for 48 h; lane mock (Fig.1D), sham-infected for 24 h. (E) TUNEL labelling of SADS-CoV-infected cells. Mock-infected control and SADS-CoV-infected cells fixed at 36 hpi were labelled with TUNEL (green) and sequentially stained with an anti-SADS-CoV N antibody (red). Cells were counterstained with DAPI, and photomicrographs of TUNEL labelling and N protein staining in virus-infected cells were obtained using a confocal microscope. (F) Cell death analysis by flow cytometry with dual Annexin V-PI cell labelling. SADS-CoV-infected cells collected at different time points were subjected to dual Annexin V and PI labelling and analyzed by FACS. Lower left quadrants represent intact cells (Annexin V negative\PI negative); Lower right quadrants represent early apoptotic cells (Annexin V positive\PI negative); upper right quadrants indicate late apoptotic and/or necrotic cells (Annexin V positive\PI positive); and upper left quadrants indicate necrotic cells (Annexin V negative\PI positive). The graph on the right represents the percentage of each quadrant, and the non-significant percentages of Annexin V- negative and PI- positive cells were excluded.
Figure 2.
Figure 2.
Effects of SADS-CoV infection on caspase activation and PARP cleavage in vitro and in vivo. (A and B) SADS-CoV infection activates caspase-8, -9, -3 and cleaved PARP in vitro. Western blot analysis of caspase activation in SADS-CoV-infected cells (0.1 MOI) at different times or MOIs at 24 hpi. GAPDH was used as internal loading control. (C) Representative microphotographs of viral antigen immunochemical staining in SADS-CoV -non-infected and -infected ileal tissues (Bar: 200 μm). (D) SADS-CoV infection activates caspase-3 and cleaved PARP in vivo. Western blot analysis of the protein expression levels of caspase-3 and cleaved PARP in ileal samples from SADS-CoV -non-infected and -infected piglets at 24, 36, and 48 hpi. GAPDH was used as internal loading control.
Figure 3.
Figure 3.
Pan-caspase inhibitor affects SADS-CoV-induced apoptosis and SADS-CoV infection. (A) Z-VAD-FMK treatment does not affect cell viability. Vero E6 and IPI-2I cells were treated with the carrier control DMSO or Z-VAD-FMK at different concentrations for 36 h. Cell cytotoxicity was analyzed by CCK-8 kit as described in Materials and Methods. (B) FACS with dual Annexin V-PI cell labelling in the presence of Z-VAD-FMK. Vero E6 cells were pretreated with DMSO or Z-VAD-FMK (100 μM) for 1 h, followed by mock or SADS-CoV infection. Cells were harvested at the indicated time points, dual labelled with Annexin V and PI, and then analyzed by FACS. The right graph represents the percentage of each quadrant. (C) SADS-CoV replication in the presence of Z-VAD-FMK. Vero E6 cells were treated with DMSO or Z-VAD-FMK at the indicated concentrations for 1 h prior to infection with SADS-CoV. SADS-CoV infected cells were maintained for 36 h in the presence of DMSO or Z-VAD-FMK. For immunostaining, infected cells were fixed at 36 hpi and incubated with mAb against SADS-CoV N protein, followed by incubation with Alexa Fluor 594-conjugated goat anti-mouse secondary antibody. The cells were counterstained with DAPI and examined using an inverted fluorescence microscope. The percentage of SADS-CoV infected cells per view from three independent experiments is expressed as the mean ± SD. (D and E) Viral N protein expression and PARP cleavage in the presence of Z-VAD-FMK. Vero E6 and IPI-2I cells were treated with Z-VAD-FMK at the indicated concentrations for 1 h prior to infection with SADS-CoV. SADS-CoV-infected cells were maintained for 36 h in the presence of DMSO or Z-VAD-FMK. At 36 hpi, cellular lysates were examined by western blot with antibodies against SADS-CoV N protein and PARP. The blot was also reacted with a mouse mAb against GAPDH to verify equal protein loading. Densitometric data of N/GAPDH and cleaved PARP/GAPDH from three independent experiments are expressed as the mean ± SD. (F and G) Z-VAD-FMK treatment suppresses SADS-CoV replication. Treatment and infection conditions were as described for in panel D and E, and the viral titers in the supernatants collected at 36 hpi were determined by the Spearman-Kärber method. Error bars represent the standard errors of the means from three independent experiments.
Figure 4.
Figure 4.
Treatment with caspase-8 and -9 inhibitors attenuates SADS-CoV infection. (A) Z-IETD-FMK and Z-LEHD-FMK treatment does not affect cell viability. Vero E6 and IPI-2I cells were treated with the carrier control DMSO, Z-IETD-FMK or Z-LEHD-FMK at different concentrations for 36 h. Cell cytotoxicity was analyzed by CCK-8 kit as described in Materials and Methods. (B) SADS-CoV propagation in the presence of Z-IETD-FMK (caspase-8 inhibitor) or Z-LEHD-FMK (caspase-9 inhibitor). Vero E6 cells were pretreated with each inhibitor at the indicated concentrations for 1 h and then infected with SADS-CoV. SADS-CoV -infected cells were further maintained for 36 h in the presence of DMSO, Z-IETD-FMK, or Z-LEHD-FMK. At 36 hpi, virus-infected cells were subjected to IFA with an anti-SADS-CoV N antibody, followed by DAPI counterstaining and examination under an inverted fluorescence microscope. The percentage of SADS-CoV infected cells per view from three independent experiments is expressed as the mean ± SD. (C and D) Viral N protein expression and PARP cleavage in the presence of Z-IETD-FMK or Z-LEHD-FMK. Vero E6 and IPI-2I cells were treated with DMSO, Z-IETD-FMK or Z-LEHD-FMK at the indicated concentrations for 1 h prior to infection with SADS-CoV. SADS-CoV infected cells were maintained for 36 h in the presence of DMSO, Z-IETD-FMK or Z-LEHD-FMK. At 36 hpi, cellular lysates were examined by western blot with antibodies against SADS-CoV N protein and PARP. The blot was also reacted with a mouse mAb against GAPDH to verify equal protein loading. Densitometric data for N/GAPDH and cleaved PARP/GAPDH from three independent experiments are expressed as the mean ± SD. (E and F) Z-IETD-FMK or Z-LEHD-FMK treatment suppresses SADS-CoV replication. Treatment and infection conditions were as described for in panel C and D, and the viral titers in the supernatants collected at 36 hpi were determined by the Spearman-Kärber method. Error bars represent the standard errors of the means from three independent experiments.
Figure 5.
Figure 5.
Effects of SADS-CoV infection on Fas, FasL expression and Bid cleavage in Vero E6 cells. (A) SADS-CoV increases cell surface expression of FasL. Cells were fixed and stained for FasL at 36 hpi and observed under fluorescence microscopy. (B) Cells were mock or SADS-CoV-infected at 0.1 MOI at different time points. Cell lysates were analyzed by western blot. Densitometric data for Fas, FasL, Bid, and tBid/GAPDH from three independent experiments are expressed as the mean ± SD.
Figure 6.
Figure 6.
Infections by SADS-CoV promote Bax and Cyt c relocalization but not AIF relocalization in Vero E6 cells. (A and B) Immunofluorescent detection of activated Bax and Cyt c. At 36 hpi, mock-infected or SADS-CoV-infected Vero E6 cells were incubated with the MitoTracker Red CMXROS (red), fixed, and incubated with anti-activated Bax or Cyt c antibodies (green). Bax mitochondrial relocalization is represented as the merger of Bax and mitochondrial marker (yellow), while the residual cytosolic localization is indicated by single staining signal (green). Conversely, Cyt c cytosolic relocalization is represented by single staining signals (green), and residual mitochondrial accumulation is indicated as the colocation of Cyt c and MitoTracker Red CMXROS (yellow). The square-enclosed region provides a higher-magnification view. (C) Western blot analysis of Bax and Cyt c. The mitochondrial and cytosolic fractions were subjected to western blot with an antibody specific to Bax, Cyt c, GAPDH (cytosolic protein marker), or prohibitin (mitochondrial protein marker). All subcellular protein markers served as loading controls. (D) Immunofluorescent detection of activated AIF. At 36 hpi, mock or SADS-CoV-infected Vero E6 cells were incubated with MitoTracker Red CMXROS (red), fixed, and incubated with anti-AIF antibody (green). AIF mitochondrial retention is represented as the merger of AIF and mitochondrial marker (yellow). The square-enclosed region provides a higher-magnification view.
Figure 7.
Figure 7.
CsA treatment diminishes SADS-CoV-induced apoptosis and suppresses SADS-CoV propagation. (A) CsA treatment does not affect cell viability. Vero E6 and IPI-2I cells were treated with the carrier control DMSO or CsA at different concentrations for 36 h. Cell cytotoxicity was analyzed by CCK-8 kit as described in Materials and Methods. (B) FACS with dual Annexin V-PI cell labelling in the presence of CsA. Vero E6 cells were pretreated with DMSO or CsA (10 μM) for 1 h and mock-infected or infected with SADS-CoV in the presence of DMSO or CsA. Cells were harvested at the indicated time points, dual labelled with Annexin V and PI, and analyzed by FACS. The graph on the right represents the percentage of each quadrant. (C) DNA fragmentation analysis in the presence of CsA. Vero E6 cells were pre-incubated with Z-VAD-FMK (100 μM) or CsA (10 μM) for 1 h and infected with mock virus or SADS-CoV. Nucleosomal DNA fragmentation of the cells was analyzed by agarose gel electrophoresis. Lane M, 2-kb DNA molecular weight marker; lane 1, mock-infected and non-treated; lane 2, only SADS-CoV-infected; lane 3, SADS-CoV-infected and Z-VAD-FMK-treated; lane 4, SADS-CoV-infected and CsA-treated. (D) SADS-CoV infection in the presence of CsA. Vero E6 cells were treated with DMSO or CsA at the indicated concentrations for 1 h prior to their infection with SADS-CoV. SADS-CoV-infected cells were further maintained for 36 h in the presence of DMSO or CsA. For immunostaining, infected cells were fixed at 36 hpi and stained with an anti- SADS-CoV N protein antibody, followed by incubation with Alexa Fluor 594-conjugated goat anti-mouse secondary antibody. The cells were counterstained with DAPI and examined under an inverted fluorescence microscope. The percentage of SADS-CoV infected cells per view from three independent experiments is expressed as the mean ± SD. (E and F) Viral N protein expression and PARP cleavage in the presence of CsA. Vero E6 and IPI-2I cells were treated with DMSO or CsA at the indicated concentrations for 1 h prior to infection with SADS-CoV. SADS-CoV infected cells were maintained for 36 h in the presence of DMSO or CsA. At 36 hpi, cellular lysates were examined by western blot with antibodies against SADS-CoV N protein and PARP. The blot was also reacted with a mouse mAb against GAPDH to verify equal protein loading. Densitometric data for N/GAPDH and cleaved PARP/GAPDH from three independent experiments are expressed as the mean ± SD. (G and H) CsA treatment suppresses SADS-CoV replication. Treatment and infection conditions were as described in panel E and F, and the viral titers in the supernatants collected at 36 hpi were determined by the Spearman-Kärber method. Error bars represent the standard errors of the means from three independent experiments.
Figure 8.
Figure 8.
Schematic representation of SADS-CoV-induced apoptosis pathways.

References

    1. Galluzzi L, Kepp O, Trojel-Hansen C, et al. . Mitochondrial control of cellular life, stress, and death. Circ Res. 2012;111(9):1198–1207. - PubMed
    1. Kroemer G, Galluzzi L, Vandenabeele P, et al. . Classification of cell death: recommendations of the Nomenclature Committee on Cell Death 2009. Cell Death Differ. 2009;16(1):3–11. - PMC - PubMed
    1. Arch RH, Thompson CB.. Lymphocyte survival–the struggle against death. Annu Rev Cell Dev Biol. 1999;15:113–140. - PubMed
    1. Shih WL, Hsu HW, Liao MH, et al. . Avian reovirus sigmaC protein induces apoptosis in cultured cells. Virology. 2004;321(1):65–74. - PubMed
    1. Everett H, McFadden G.. Apoptosis: an innate immune response to virus infection. Trends Microbiol. 1999;7(4):160–165. - PubMed

Supplementary concepts

LinkOut - more resources