. 2020 Feb 24;12(4):3574-3593.
doi: 10.18632/aging.102831. Epub 2020 Feb 24.

SERPINH1 regulates EMT and gastric cancer metastasis via the Wnt/β-catenin signaling pathway

Affiliations

SERPINH1 regulates EMT and gastric cancer metastasis via the Wnt/β-catenin signaling pathway

Shan Tian et al. Aging (Albany NY). .

Abstract

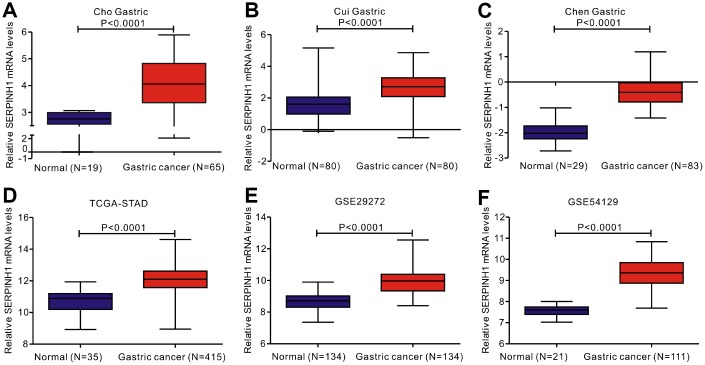
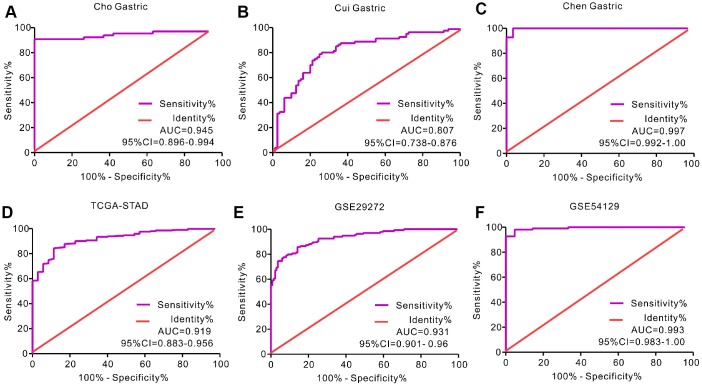
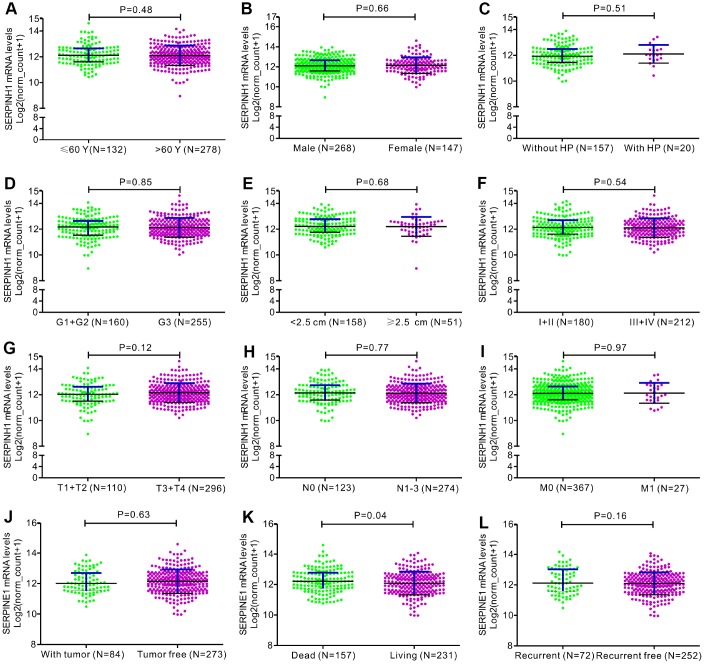
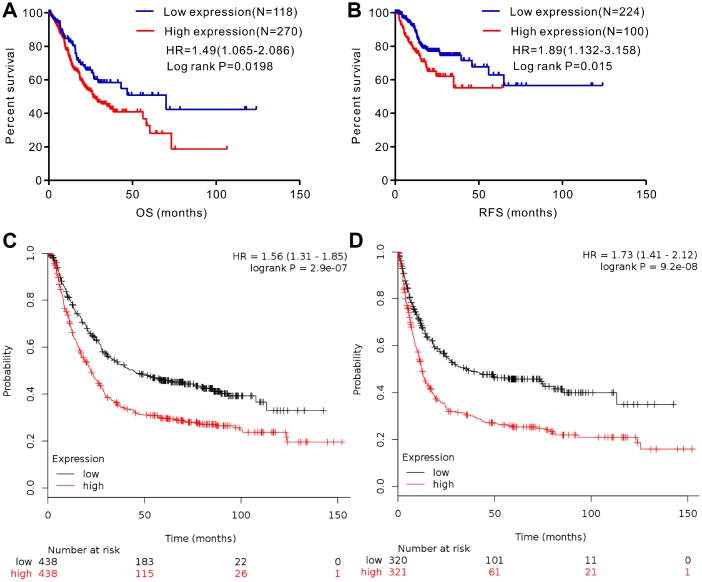
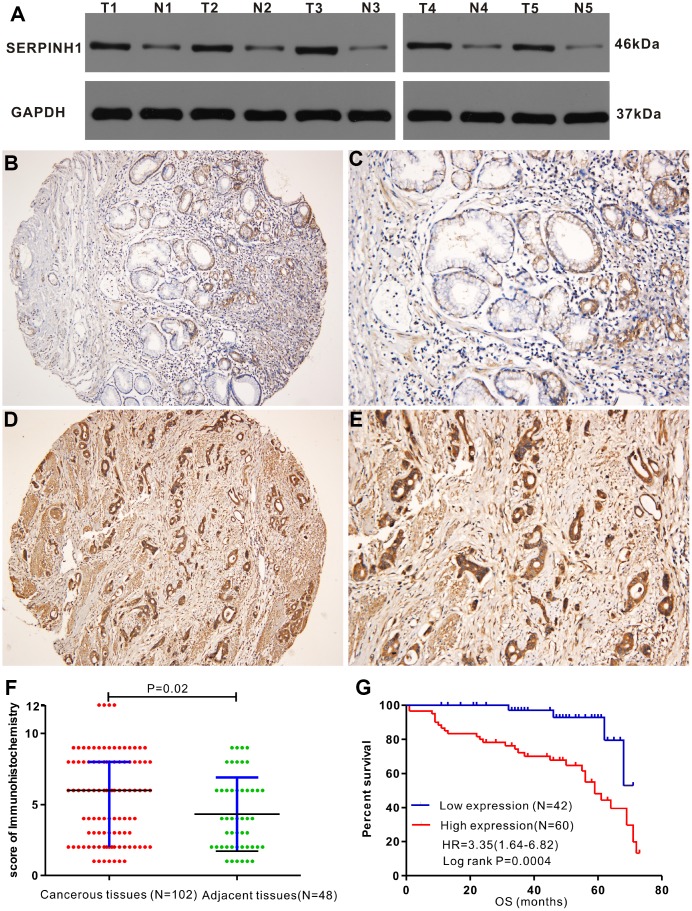
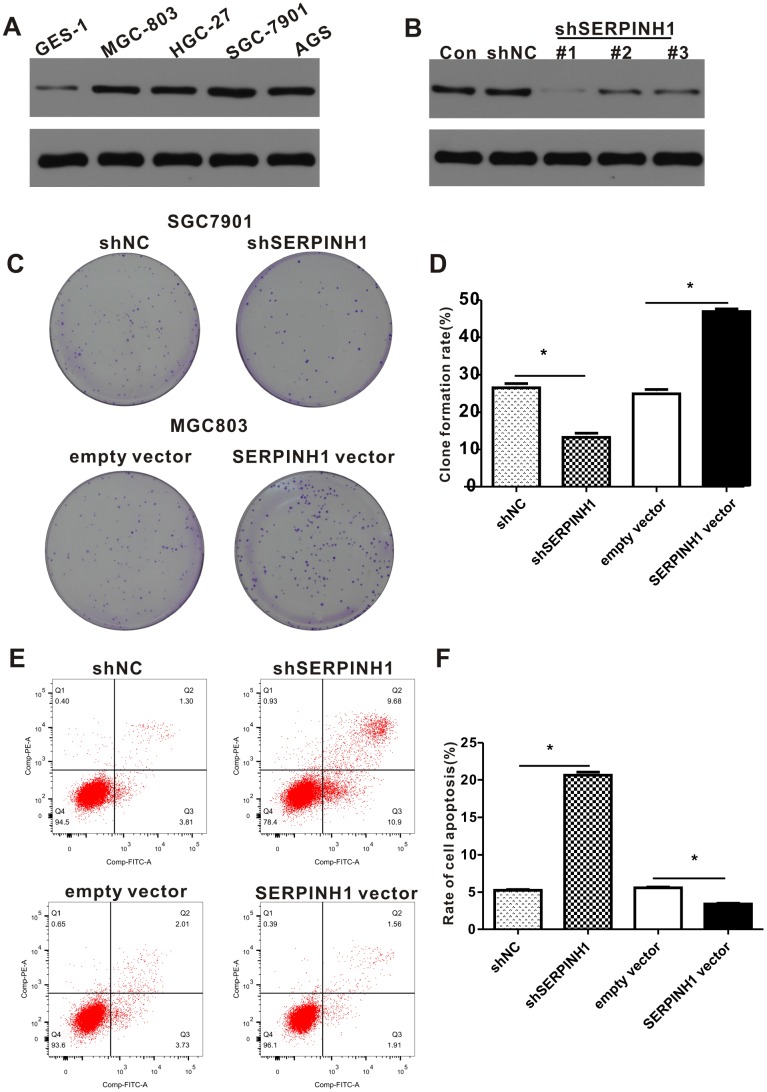
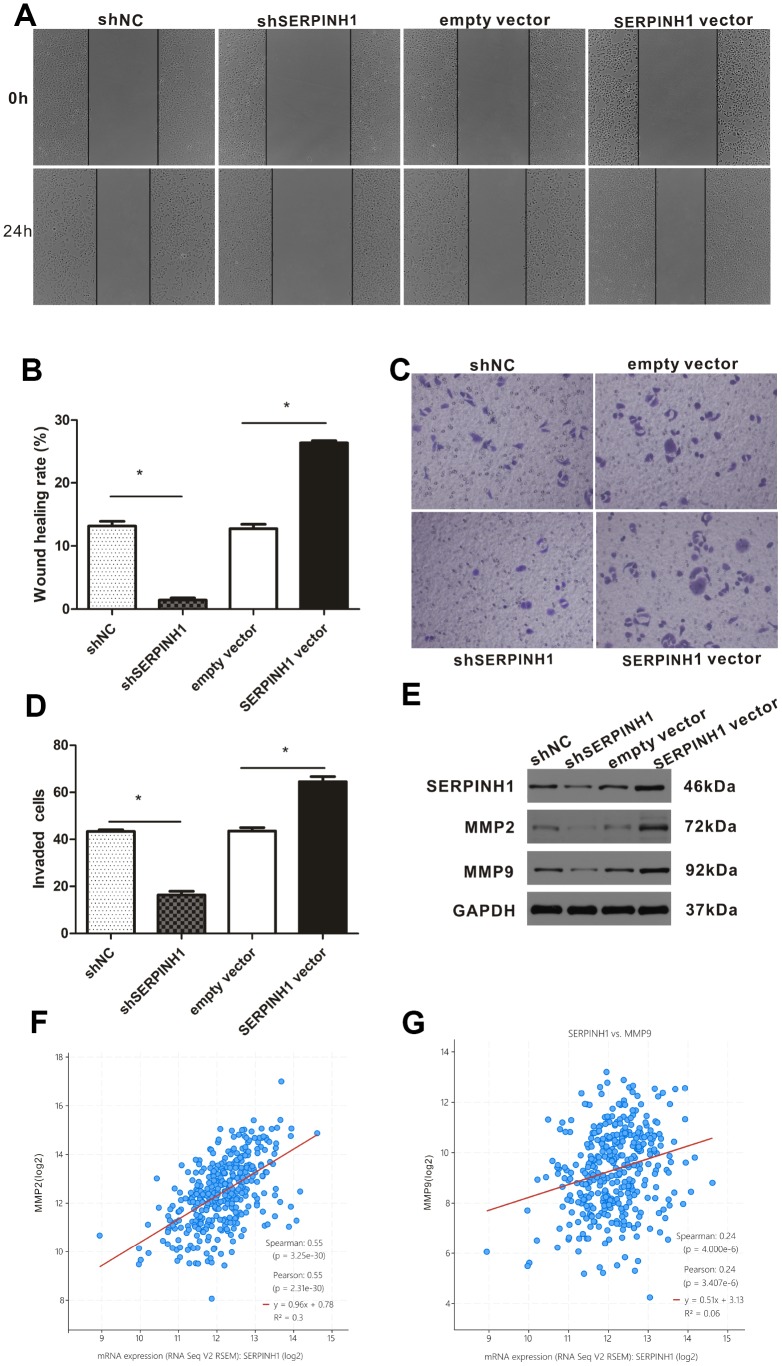
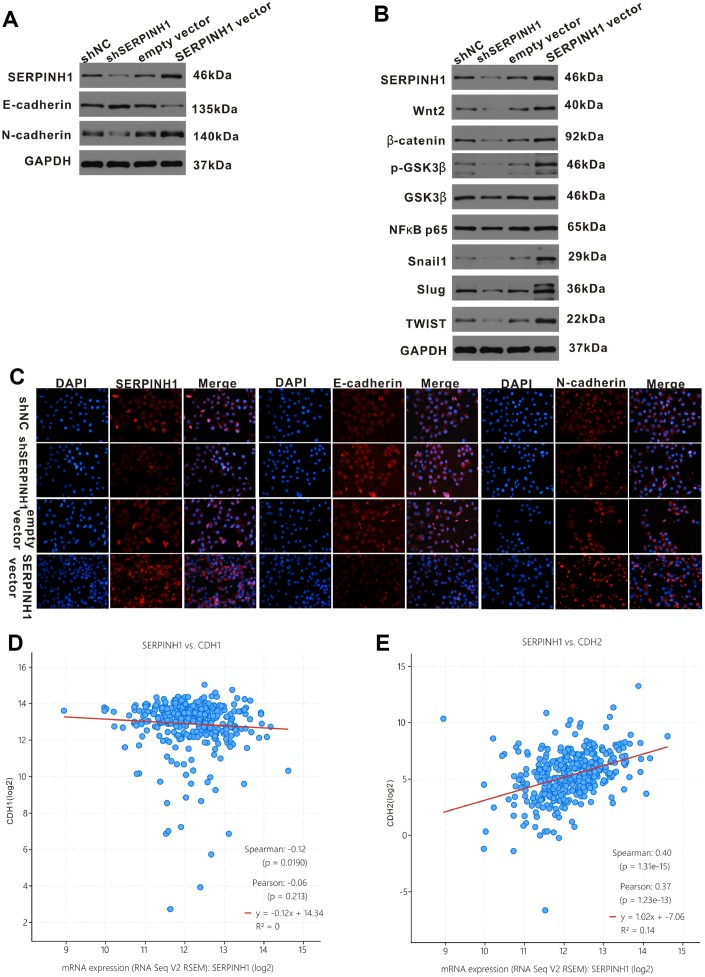
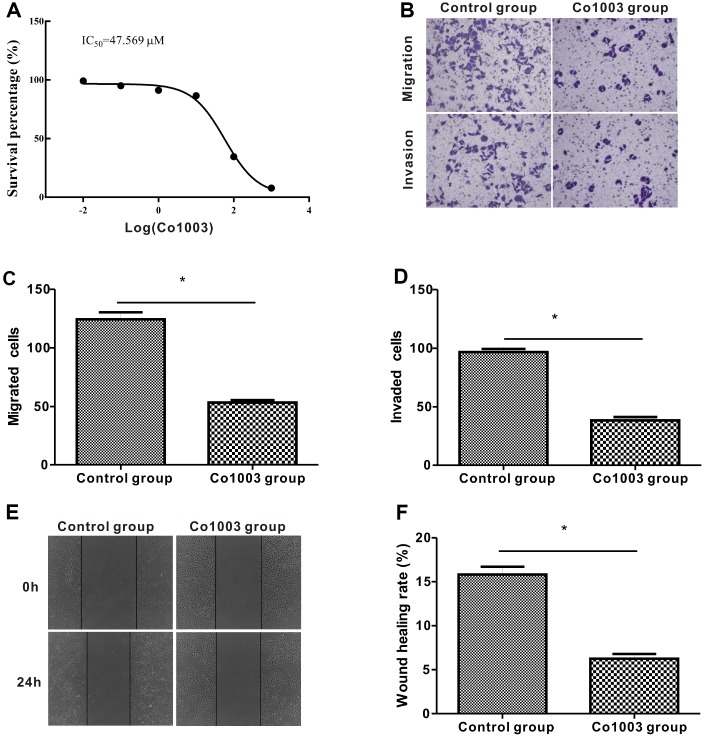
In this study, we investigated the role of SERPINH1 in gastric cancer (GC) progression. GC patient tissues show significantly higher SERPINH1 mRNA and protein levels than normal gastric mucosal tissues. GC patients with high SERPINH1 expression are associated with lymph node metastasis and poor prognosis. SERPINH1 mRNA levels negatively correlate with E-cadherin mRNA levels and positively correlate with levels of N-cadherin, MMP2, and MMP9 mRNA levels. This suggests SERPINH1 regulates epithelial to mesenchymal transition (EMT). SERPINH1 expression was significantly higher in the HGC-27, AGS, MGC-803, and SGC-7901 GC cell lines than in the GES-1 normal gastric mucosal cell line. In SERPINH1-silenced SGC-7901 cells, survival, colony formation, migration and invasion were all reduced, whereas they were all enhanced in SERPINH1-overexpressing MGC-803 cells. Levels of WNT/β-catenin signaling pathway proteins, including β-catenin, Wnt2, GSK-3β, p-GSK-3β, NF-κB P65, Snail1, Slug and TWIST, were all reduced in SERPINH1-silenced SGC-7901 cells, and increased in the SERPINH1-overexpressing MGC-803 cells. Inhibition of SERPINH1 protein using Co1003 significantly decreased survival, invasion, and migration of GC cells. SERPINH1 thus appears to regulate EMT and GC progression via the Wnt/β-catenin pathway, making SERPINH1 a potential prognostic biomarker and therapeutic target in GC patients.

Keywords: SERPINH1; Wnt/β-catenin pathway; epithelial-mesenchymal transition; gastric cancer; therapeutic target.


Conflict of interest statement

CONFLICTS OF INTEREST: The authors declare that there are no conflicts of interests.

Figures

Figure 1
Figure 1
Analysis of SERPINH1 mRNA expression in normal and gastric cancer (GC) tissues from 3 public databases. SERPINH1 mRNA levels are significantly lower (P<0.0001) in normal gastric mucosal than that in gastric cancer tissue samples in the (A) Cho (Normal=19; Tumor=65), (B) Cui (Normal=80; Tumor=80), and (C) Chen (Normal=29; Tumor=83) Gastric datasets from the Oncomine database; (D) STAD dataset (Normal=35; Tumor=415) from the TCGA database; and (E) GSE29272 (Normal=134; Tumor=134) and (F) GSE54129 (Normal=21; Tumor=111) datasets from the GEO databases.
Figure 2
Figure 2
Receiver operating characteristic (ROC) curve analysis to determine diagnostic relevance of SERPINH1 mRNA levels in GC patients. ROC curve analysis of SERPINH1 mRNA levels in the (A) Cho (AUC=0.945), (B) Cui (AUC=0.807), and (C) Chen (AUC=0.997) Gastric datasets from the Oncomine database; (D) STAD dataset (AUC=0.919) from the TCGA database; and (E) GSE29272 (AUC=0.931) and (F) GSE54129 (AUC=0.993) datasets from the GEO databases.
Figure 3
Figure 3
Correlation analyses between SERPINH1 mRNA levels and different clinicopathological characteristics of GC patients. The association between SERPINH1 levels and clinicopathological characteristics of GC patients, including (A) Age (P=0.48); (B) Gender (P=0.66); (C) Infection of Helicobacter pylori (HP; P=0.51); (D) Tumor grade (G) stage (P=0.85); (E) Tumor size (P=0.68); (F) Tumor Node Metastasis (TNM) stage (P=0.54); (G) Tumor (T) stage (P=0.12); (H) Node (N) stage (P=0.77); (I) Metastasis (M) stage (P=0.97); (J) Tumor status (P=0.63); (K) Overall Survival (OS; P=0.04); (L) Relapse-free survival (RFS; P=0.16).
Figure 4
Figure 4
Analysis of the prognostic significance of SERPINH1 mRNA levels in GC patients. (A) Patients with high SERPINH1 mRNA levels show significantly poorer OS than patients with low SERPINH1 mRNA levels in the TCGA-STAD dataset (N=388, HR=1.49, P=0.0198). (B) Patients with high SERPINH1 mRNA levels show poorer RFS than patients with low SERPINH1 mRNA levels in the TCGA-STAD dataset (N=324, HR=1.89, P=0.015). (C) GC patients with high SERPINH1 mRNA levels show poorer OS than the GC patients with low SERPINH1 levels in the Kaplan-Meier Plotter database (N=876, HR=1,56, P<0.0001). (D) GC patients with high SERPINH1 mRNA levels show poorer PFS than GC patients with low SERPINH1 levels in the Kaplan-Meier Plotter database (N=641, HR=1.73, P<0.0001).
Figure 5
Figure 5
Immunohistochemical analysis of SERPINH1 protein expression in human GC tissues. (A) Immunohistochemical (IHC) analysis shows that SERPINH1 protein levels are significantly higher in five pairs of matched GC tissues compared with the adjacent non-tumor gastric mucosal tissues. (BE) Representative images show IHC staining of SERPINH1 protein in (B, C) normal gastric mucosal tissues and (D, E) gastric cancer tissues at 100X and 200X magnification, respectively. (F) Comparison of IHC scores show that SERPINH1 protein expression is significantly higher (P=0.02) in gastric cancer tissues (N=102) compared with adjacent non-tumor gastric tissues (N=48). (G) Survival curve analysis shows that GC patients with high SERPINH1 protein levels exhibit poorer OS than patients with low SERPINH1 protein levels (HR=3.35, P=0.0004).
Figure 6
Figure 6
SERPINH1 expression regulates the proliferation and survival of GC cell lines. (A) Western blot analysis shows that SERPINH1 protein levels are higher in the four GC cell lines, HGC-27, AGS, MGC-803, SGC-7901, compared to the normal gastric mucosal cell line, GES-1. (B) Western blot analysis shows that SERPINH1 protein levels are significantly reduced in shSERPINH1 #1-transfected SGC-7901 cells compared with SGC-7901 cells transfected with shSERPINH1 #2, shSERPINH1 #2, and shNC. (C) Representative images of colonies in shSERPINH1#1-transfected SGC-7901 cells, SERPINH1-overexpression vector transfected MGC-803 cells, and their corresponding controls. (D) Histogram plots show the number of colonies in shSERPINH1#1-transfected SGC-7901 cells, SERPINH1-overexpression vector-transfected MGC-803 cells, and their corresponding controls. (E) Flow cytometry analysis shows that apoptotic rate is significantly higher in the shSERPINH1#1-transfected SGC-7901 cells and significantly lower in the SERPINH1-overexpression vector-transfected MGC-803 cells compared to their corresponding controls. (F) Histogram plot shows the percentage of apoptotic cells in shNC-, and shSERPINH1#1-transfected SGC-7901 cell cultures, as well as, empty vector and SERPINH1-overexpression vector-transfected MGC-803 cells.
Figure 7
Figure 7
SERPINH1 expression regulates in vitro migration and invasion of GC cells. (A) Wound healing assay shows that the distance between wound edges was higher in SERPINH1-silenced SGC-7901 cells than in the control SGC-7901 cells at 24 h. Conversely, the distance between wound edges was significantly lower in the SERPINH1-overexpressing MGC-803 cells than in the control MGC-803 cells at 24 h. (B) Quantitative analysis of wound healing assay in the control and SERPINH1-silenced SGC-7901 cells, as well as control and SERPINH1-overexpressing MGC-803 cells. (C) Representative images show results of the Transwell migration assay, and (D) histogram plots show the number of migrating cells in the control and SERPINH1-silenced SGC-7901 cells, as well as control and SERPINH1-overexpressing MGC-803 cells. As shown, migration is reduced in SERPINH1-silenced SGC-7901 cells and increased in SERPINH1 overexpressed MGC-803 cells compared with the corresponding controls. (E) Western blot analysis shows that MMP2 and MMP9 protein levels are significantly reduced in the shSERPINH1-silenced SGC-7901 cells and increased in the SERPINH1-overexpressing MGC-803 cells compared with the corresponding controls. (F, G) Gene expression analysis shows that (F) MMP2 (r=0.55, P<0.0001) and (G) MMP9 (r=0.24, P<0.0001) mRNA levels positively correlate with SERPINH1 mRNA levels in GC patients from the TCGA-STAD dataset.
Figure 8
Figure 8
SERPINH1 regulates EMT markers and Wnt/β-catenin signaling pathway in GC. (A) Western blot analysis shows reduced N-cadherin and increased E-cadherin expression in SERPINH1-silenced SGC-7901 cells compared with controls. Conversely, SERPINH1-overexpressing MGC-803 cells show increased N-cadherin and reduced E-cadherin expression compared with the controls. (B) Western blot analysis shows increased levels of β-catenin, Wnt2, GSK-3β, p-GSK-3β, NF-κB p65, Snail1, Slug, and TWIST in the SERPINH1-overexpressing MGC-803 cells compared with the controls, whereas SERPINH1-silenced SGC-7901 cells show reduced levels of β-catenin, Wnt2, GSK-3β, p-GSK-3β, NF-κB p65, Snail1, Slug, and TWIST compared with the controls. (C) Immunofluorescence staining of E-cadherin, N-cadherin and SERPINH1 proteins in the control and SERPINH1-silenced SGC-7901 cells, as well as, control and SERPINH1-overexpressing MGC-803 cells. (D, E) Gene expression analysis of the TCGA-STAD dataset shows (D) negative correlation of CDH1 (r=-0.12, P=0.019) or E-cadherin mRNA levels and (E) positive association of CDH2 (r=0.40, P<0.0001) or N-cadherin mRNA levels with the SERPINH1 mRNA levels.
Figure 9
Figure 9
Anti-tumor effects of CO1003 in GC cells. (A) CCK-8 assay analysis shows concentration-dependent inhibition of proliferation of SGC-7901 GC cells by CO1003 (0, 0.01, 0.1, 1, 10, 100, 1000 μM). This curve was used to determine the IC50 concentration of CO1003, which is the concentration of CO1003 required to reduce proliferation of SGC-7901 cells by 50%. IC50 for CO1003 is 47.56 μM. (B) Transwell migration and invasion assay shows reduced migration and invasion of CO1003-treated SGC-7901 cells compared to the DMSO-treated GC cells. (C, D) Histogram plots show total number of (C) migrating and (D) invading DMSO- and CO1003-treated SGC-7901 cells. (E) Representative images of wound healing assay show that the distance between wound edges was significantly higher in Co1003-treated SGC-7901 cells compared with the DMS-treated SGC-7901 cells. (F) Wound healing assay shows lower wound healing rate because of reduced migration in CO1003-treated SGC-7901 cells compared with the DMSO-treated SGC-7901 cells.

References

    1. Fitzmaurice C, Abate D, Abbasi N, Abbastabar H, Abd-Allah F, Abdel-Rahman O, Abdelalim A, Abdoli A, Abdollahpour I, Abdulle AS, Abebe ND, Abraha HN, Abu-Raddad LJ, et al., and Global Burden of Disease Cancer Collaboration. Global, Regional, and National Cancer Incidence, Mortality, Years of Life Lost, Years Lived With Disability, and Disability-Adjusted Life-Years for 29 Cancer Groups, 1990 to 2017: A Systematic Analysis for the Global Burden of Disease Study. JAMA Oncol. 2019. [Epub ahead of print]. 10.1001/jamaoncol.2019.2996 - DOI - PMC - PubMed
    1. Chen W, Zheng R, Baade PD, Zhang S, Zeng H, Bray F, Jemal A, Yu XQ, He J. Cancer statistics in China, 2015. CA Cancer J Clin. 2016; 66:115–32. 10.3322/caac.21338 - DOI - PubMed
    1. Ferlay J, Shin HR, Bray F, Forman D, Mathers C, Parkin DM. Estimates of worldwide burden of cancer in 2008: GLOBOCAN 2008. Int J Cancer. 2010; 127:2893–917. 10.1002/ijc.25516 - DOI - PubMed
    1. Biagioni A, Skalamera I, Peri S, Schiavone N, Cianchi F, Giommoni E, Magnelli L, Papucci L. Update on gastric cancer treatments and gene therapies. Cancer Metastasis Rev. 2019; 38:537–48. 10.1007/s10555-019-09803-7 - DOI - PubMed
    1. Zhang JX, Chen ZH, Chen DL, Tian XP, Wang CY, Zhou ZW, Gao Y, Xu Y, Chen C, Zheng ZS, Weng HW, Ye S, Kuang M, et al.. LINC01410-miR-532-NCF2-NF-kB feedback loop promotes gastric cancer angiogenesis and metastasis. Oncogene. 2018; 37:2660–75. 10.1038/s41388-018-0162-y - DOI - PMC - PubMed

Publication types

MeSH terms

Substances