Clinical Trial
. 2020 Apr 1;130(4):1653-1668.
doi: 10.1172/JCI131041.

Circulating tumor DNA profile recognizes transformation to castration-resistant neuroendocrine prostate cancer

Affiliations
Clinical Trial

Circulating tumor DNA profile recognizes transformation to castration-resistant neuroendocrine prostate cancer

Himisha Beltran et al. J Clin Invest. .

Abstract

Loss of androgen receptor (AR) signaling dependence occurs in approximately 15%-20% of advanced treatment-resistant prostate cancers, and this may manifest clinically as transformation from a prostate adenocarcinoma histology to a castration-resistant neuroendocrine prostate cancer (CRPC-NE). The diagnosis of CRPC-NE currently relies on a metastatic tumor biopsy, which is invasive for patients and sometimes challenging to diagnose due to morphologic heterogeneity. By studying whole-exome sequencing and whole-genome bisulfite sequencing of cell free DNA (cfDNA) and of matched metastatic tumor biopsies from patients with metastatic prostate adenocarcinoma and CRPC-NE, we identified CRPC-NE features detectable in the circulation. Overall, there was markedly higher concordance between cfDNA and biopsy tissue genomic alterations in patients with CRPC-NE compared with castration-resistant adenocarcinoma, supporting greater intraindividual genomic consistency across metastases. Allele-specific copy number and serial sampling analyses allowed for the detection and tracking of clonal and subclonal tumor cell populations. cfDNA methylation was indicative of circulating tumor content fraction, reflective of methylation patterns observed in biopsy tissues, and was capable of detecting CRPC-NE-associated epigenetic changes (e.g., hypermethylation of ASXL3 and SPDEF; hypomethylation of INSM1 and CDH2). A targeted set combining genomic (TP53, RB1, CYLD, AR) and epigenomic (hypo- and hypermethylation of 20 differential sites) alterations applied to ctDNA was capable of identifying patients with CRPC-NE.

Keywords: Oncology; Prostate cancer.


Conflict of interest statement

Conflict of interest: HB has received research funding from Janssen, AbbVie Stemcentrx, Astellas, Eli Lilly, and Millennium, and has served as advisor/consultant for Janssen, Astellas, Amgen, Astra Zeneca, Pfizer, and Sanofi Genzyme. DMN has served on the Data Safety and Monitoring Board for Genetech Roche.

Figures

Figure 1
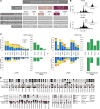
Figure 1. Frequencies of somatic aberrations in advanced prostate cancer driver genes.
(A) Schematic of study cohort. (B) WES segmented data for study cohort. WES segmented data are shown raw (inset) and ploidy- and TC-adjusted. (C) Distribution of somatic copy number loss and SNVs in CRPC-Adeno and CRPC-NE ctDNA and tumor tissue samples. Loss events include homozygous deletions (HomDel), heterozygous deletions (HetDel), copy number neutral losses (CNNL), and events defined by loss of one allele and gain of the other allele (Del|Gain). (D) AR somatic aberration status in CRPC-Adeno, CRPC-NE, and HNPC plasma and tumor tissue samples, ordered based on serial dates of collection. AR gain, focal gain, and SNV (L702H and T878A positional pileup calls) are shown together with sample ploidy and tumor class. Statistics are reported in Supplemental Table 6.
Figure 2
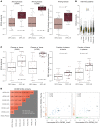
Figure 2. Similarity of somatic aberration profiles across plasma and metastatic tumor tissue samples.
(A) Intrapatient somatic copy number aberrations (SCNAs, Loss and Gain) and single nucleotide variants (SNVs) similarity across metastatic biopsies stratified by patient’s tumor class at plasma collection (Supplemental Table 2). (B) Inter- and intrapatient measures of SCNA similarity per site and across sites of metastasis. (C) Intrapatient loss and gain SCNA similarities (left) and SNV (right) similarities (fraction of SNVs in plasma detected also in tissues and fraction of SNVs in tissues detected also in plasma) across tissue and plasma samples stratified by patient’s tumor class at plasma collection. Only samples of patients with estimated ctDNA greater than 10% are considered. The same trends are also obtained with a more restrictive filter on TC greater than 50%. (D) SCNA similarity among plasma and tumor tissue samples of patient WCM0 (left); private and shared SNVs comparison between WCM0 plasma and selected tumor tissue samples. Reported P values are computed using 2-tailed Wilcoxon Mann-Whitney U test.
Figure 3
Figure 3. Allele-specific copy number quantification of matched plasma and tumor tissue samples.
(A) Example of patient demonstrating almost identical genomic status between a metastasis and a plasma sample, suggesting high homogeneity among all patient’s metastases. The lymph node metastasis of patient WCM198 and the plasma sample were collected at 4 days apart. Polygons include cancer genes with same allele-specific copy number; red dots correspond to reported gene names. (B) Example of patient with heterogeneous profiles. Patient WCM183 liver metastasis was obtained 13 days before the plasma sample. Blue indicates genes with different allele-specific copy number.
Figure 4
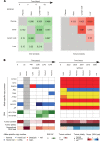
Figure 4. Heterogeneity of somatic aberration profiles in multiple plasma and tumor tissue sample series.
(A) Somatic-copy number aberration (SCNA) and single nucleotide variants (SNV) similarities among plasma and tumor tissue samples of patient WCM161. Samples are ordered by date of collection with date differences reported in days. SNV similarity is an asymmetric measure based on set inclusion and the complete matrix is shown. SCNA similarity is instead a symmetric measure based on the Jaccard coefficient and hence information is shown without redundancy. (B) Genomic analysis of WCM185 and WMC14 multi-sample series. The panel reports: allele-specific copy number of a selection of advanced prostate cancer driver genes (HomDel = homozygous deletion, HetDel = heterozygous deletion, CNNL = copy number neutral loss, Del|Gain = events defined by loss of one allele and gain of the other allele); AR L702H and AR T878A SNVs (determined by pileup analysis); TC estimations; ploidy state estimation; normalized SNV load, with values representing the ratio between the sample’s SNV number and the sample type (plasma/tumor tissue) median SNV number. Samples are ordered by date of collection (intervals shown).
Figure 5
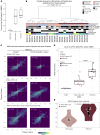
Figure 5. Differential methylation signal is detected in the circulation of patients.
(A) PAMES purity estimation of plasma WGBS plasma and PBMC samples. Top 10 most informative hypermethylated CpG Island were used. (B) Ward’s hierarchical clustering of 25 samples using 1-Pearson’s correlation coefficient as distance measure. The annotation tracks include information on sample tumor purity and on the site of the relative sequenced tissue biopsy for all tissue samples and on the presence or absence of lymph node, bone, or visceral metastases in the corresponding patient for the plasma samples. (C) Evaluation of DMR concordance in matched plasma and tissue samples. Two distinct DMR sets were nominated applying the Rocker-meth algorithm on tissue samples, and single-sample Z scores were computed for each DMR. Comparison among values detected in ctDNA and tissue biopsy are reported for 3 representative patients: WCM90, CRPC-Adeno; WCM0, CRPC-NE; and WCM119, CRPC-Adeno with radiographic progression on enzalutamide, PSA 3.5, and elevated serum NSE. Color density is proportional to point density to the power of 1/4 to improve visualization. First, order linear regression R2 is reported. (D) Comparison of average absolute Z score based on CRPC-NE|CRPC-Adeno DMR in plasma samples from this cohort and from a set of patients treated with abiraterone acetate (reported in ref. 31). To maximize the compatibility of clinical history and disease stage, only end-of-treatment samples with an estimated TC greater than 10% were included. Significance was assessed using 2-tailed unpaired Wilcoxon Mann-Whitney U test without continuity correction. (E) NEPC feature scores are plotted as assessed in plasma data of CRPC-Adeno and CRPC-NE patients.
Figure 6
Figure 6. Proposed model of prostate cancer progression toward CRPC-NE.
Metastatic prostate cancer lesions harbor shared alterations that are often traceable back to a primary tumor clone, supporting a monoclonal origin of metastatic prostate cancer. Tumors acquire alterations with disease progression and treatment resistance, and these alterations may be subclonal. Polyclonal spread in later stages further leads to intrapatient heterogeneity. During the transition toward CRPC-NE, there is likely selection of a dominant clone that persists. Intraindividual tumor heterogeneity and tumor homogeneity are captured through ctDNA analyses. DNA methylation profiles dramatically shift with CRPC-NE.

References

    1. Siegel RL, Miller KD, Jemal A. Cancer statistics, 2019. CA Cancer J Clin. 2019;69(1):7–34. doi: 10.3322/caac.21551. - DOI - PubMed
    1. Watson PA, Arora VK, Sawyers CL. Emerging mechanisms of resistance to androgen receptor inhibitors in prostate cancer. Nat Rev Cancer. 2015;15(12):701–711. doi: 10.1038/nrc4016. - DOI - PMC - PubMed
    1. Beltran H, et al. The role of lineage plasticity in prostate cancer therapy resistance. Clin Cancer Res. 2019;25(23):6916–6924. - PMC - PubMed
    1. Abida W, et al. Genomic correlates of clinical outcome in advanced prostate cancer. Proc Natl Acad Sci U S A. 2019;116(23):11428–11436. doi: 10.1073/pnas.1902651116. - DOI - PMC - PubMed
    1. Aggarwal R, et al. Clinical and genomic characterization of treatment-emergent small-cell neuroendocrine prostate cancer: a multi-institutional prospective study. J Clin Oncol. 2018;36(24):2492–2503. doi: 10.1200/JCO.2017.77.6880. - DOI - PMC - PubMed

Publication types

MeSH terms