Clinical Trial
. 2020 Feb 24;17(2):e1003038.
doi: 10.1371/journal.pmed.1003038. eCollection 2020 Feb.

Safety and immune responses after a 12-month booster in healthy HIV-uninfected adults in HVTN 100 in South Africa: A randomized double-blind placebo-controlled trial of ALVAC-HIV (vCP2438) and bivalent subtype C gp120/MF59 vaccines

Affiliations
Clinical Trial

Safety and immune responses after a 12-month booster in healthy HIV-uninfected adults in HVTN 100 in South Africa: A randomized double-blind placebo-controlled trial of ALVAC-HIV (vCP2438) and bivalent subtype C gp120/MF59 vaccines

Fatima Laher et al. PLoS Med. .

Abstract

Background: HVTN 100 evaluated the safety and immunogenicity of an HIV subtype C pox-protein vaccine regimen, investigating a 12-month booster to extend vaccine-induced immune responses.

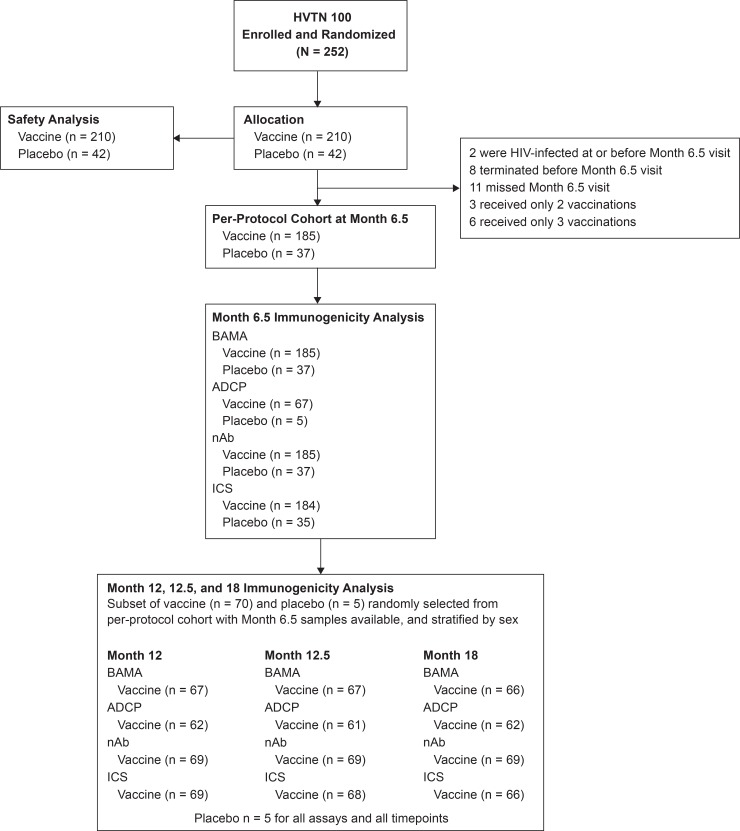
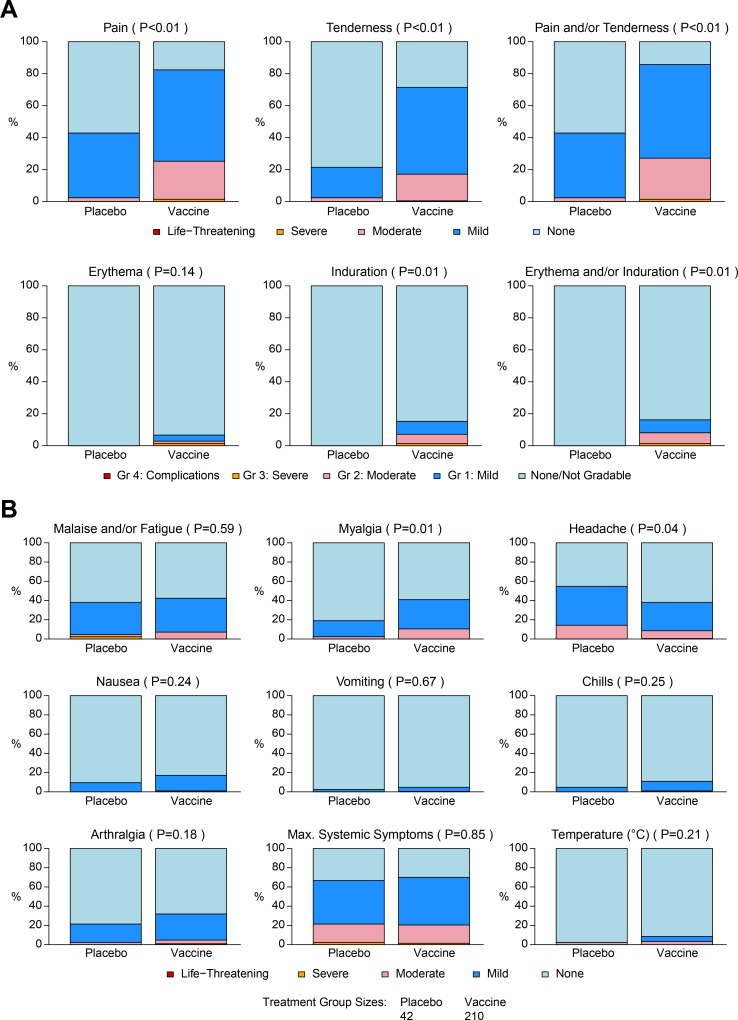
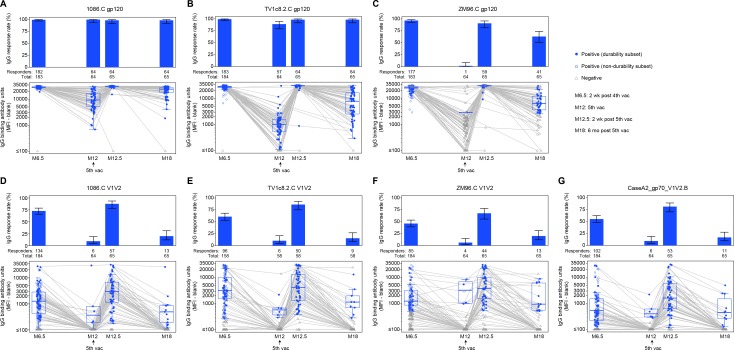
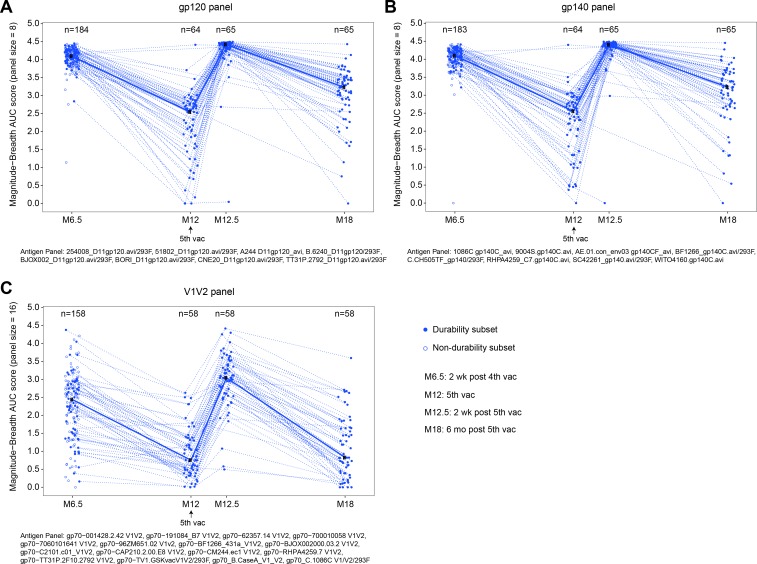
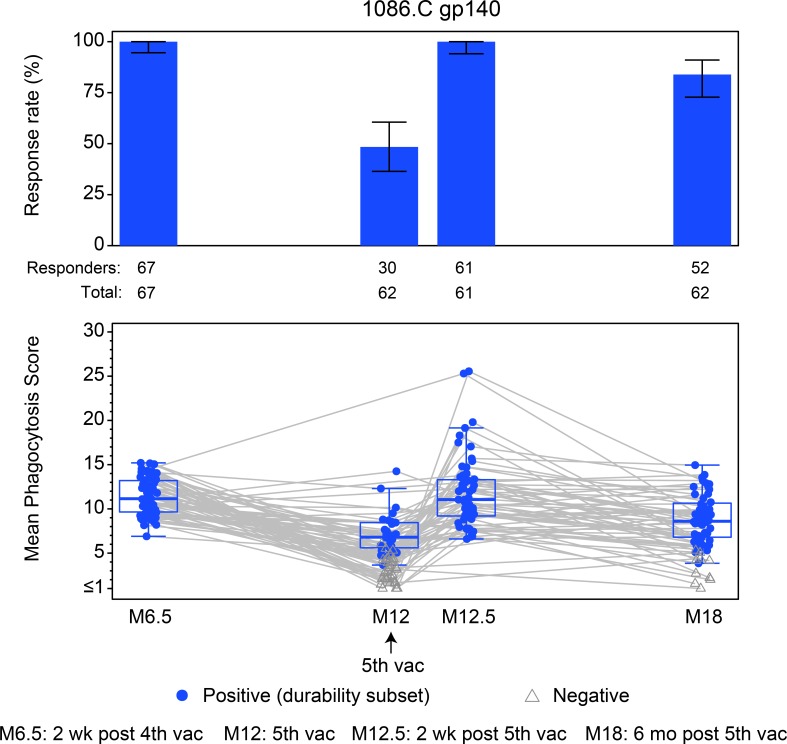
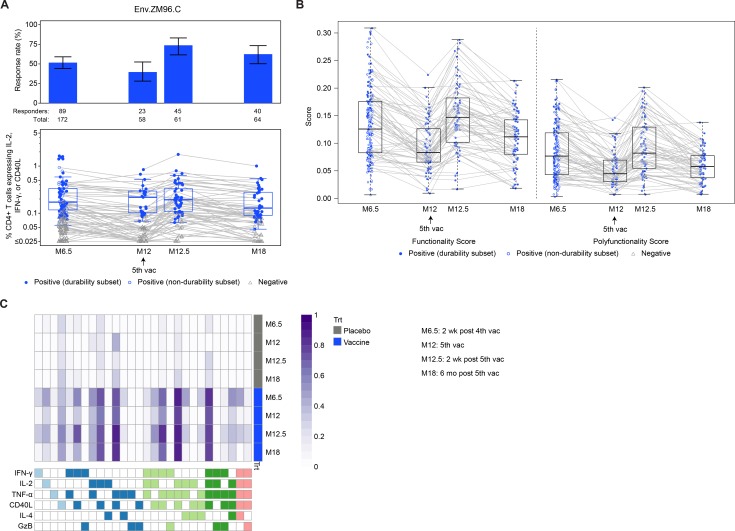
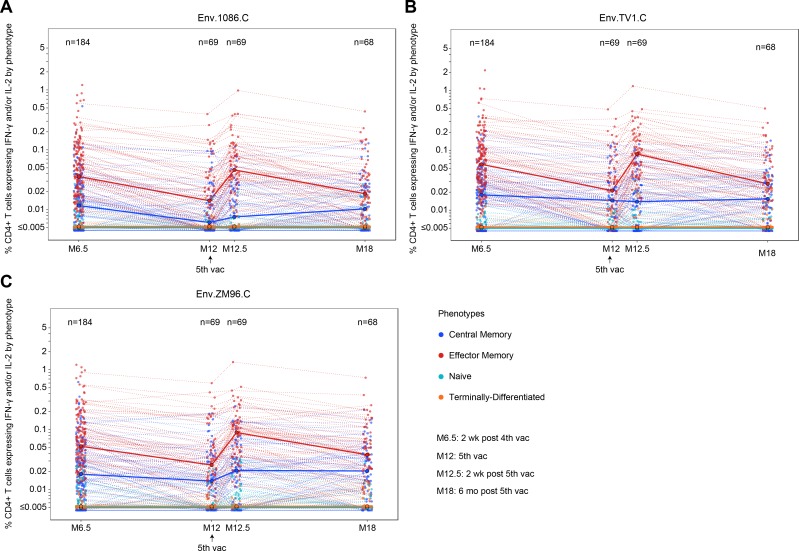
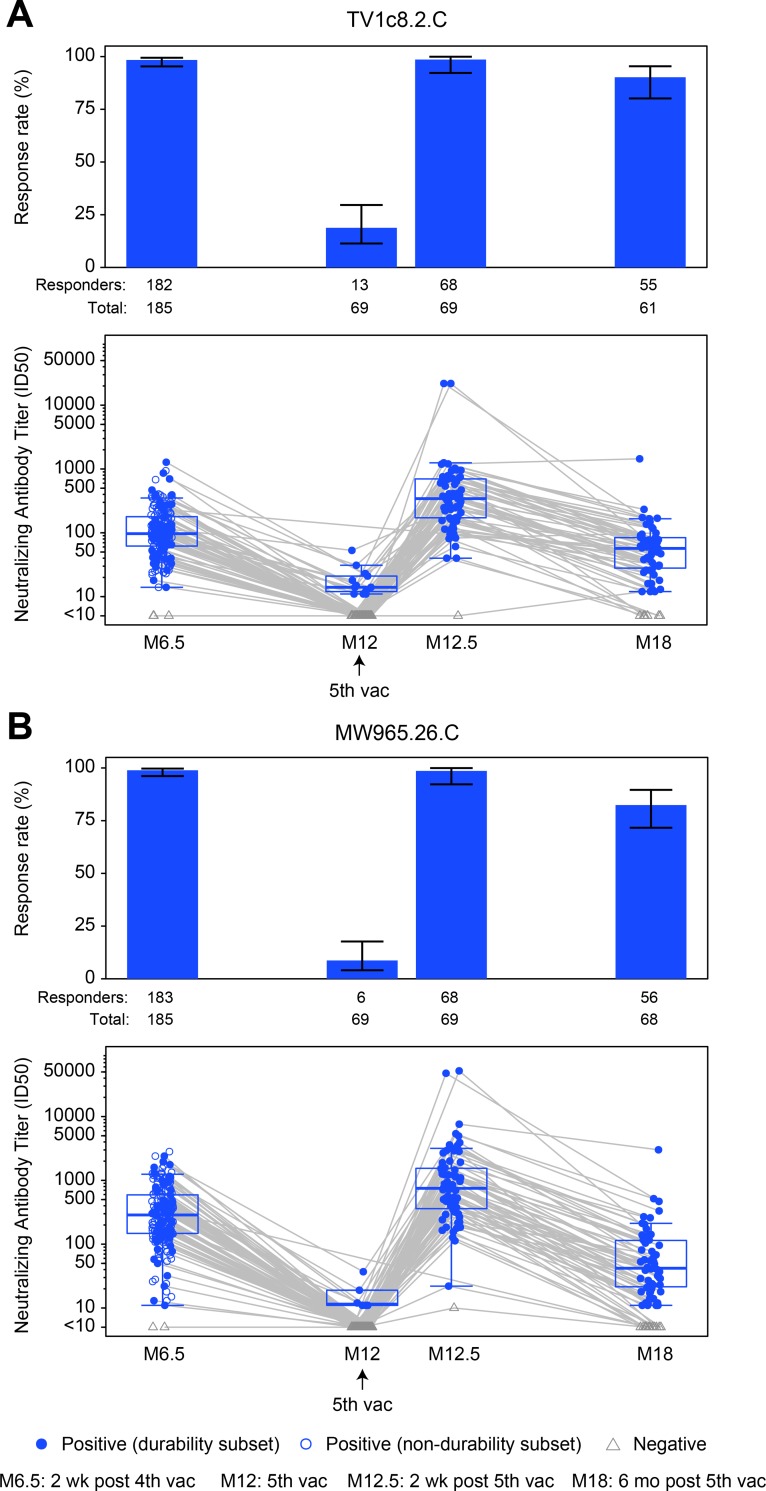
Methods and findings: A phase 1-2 randomized double-blind placebo-controlled trial enrolled 252 participants (210 vaccine/42 placebo; median age 23 years; 43% female) between 9 February 2015 and 26 May 2015. Vaccine recipients received ALVAC-HIV (vCP2438) alone at months 0 and 1 and with bivalent subtype C gp120/MF59 at months 3, 6, and 12. Antibody (IgG, IgG3 binding, and neutralizing) and CD4+ T-cell (expressing interferon-gamma, interleukin-2, and CD40 ligand) responses were evaluated at month 6.5 for all participants and at months 12, 12.5, and 18 for a randomly selected subset. The primary analysis compared IgG binding antibody (bAb) responses and CD4+ T-cell responses to 3 vaccine-matched antigens at peak (month 6.5 versus 12.5) and durability (month 12 versus 18) timepoints; IgG responses to CaseA2_gp70_V1V2.B, a primary correlate of risk in RV144, were also compared at these same timepoints. Secondary and exploratory analyses compared IgG3 bAb responses, IgG bAb breadth scores, neutralizing antibody (nAb) responses, antibody-dependent cellular phagocytosis, CD4+ polyfunctionality responses, and CD4+ memory sub-population responses at the same timepoints. Vaccines were generally safe and well tolerated. During the study, there were 2 deaths (both in the vaccine group and both unrelated to study products). Ten participants became HIV-infected during the trial, 7% (3/42) of placebo recipients and 3% (7/210) of vaccine recipients. All 8 serious adverse events were unrelated to study products. Less waning of immune responses was seen after the fifth vaccination than after the fourth, with higher antibody and cellular response rates at month 18 than at month 12: IgG bAb response rates to 1086.C V1V2, 21.0% versus 9.7% (difference = 11.3%, 95% CI = 0.6%-22.0%, P = 0.039), and ZM96.C V1V2, 21.0% versus 6.5% (difference = 14.5%, 95% CI = 4.1%-24.9%, P = 0.004). IgG bAb response rates to all 4 primary V1V2 antigens were higher 2 weeks after the fifth vaccination than 2 weeks after the fourth vaccination: 87.7% versus 75.4% (difference = 12.3%, 95% CI = 1.7%-22.9%, P = 0.022) for 1086.C V1V2, 86.0% versus 63.2% (difference = 22.8%, 95% CI = 9.1%-36.5%, P = 0.001) for TV1c8.2.C V1V2, 67.7% versus 44.6% (difference = 23.1%, 95% CI = 10.4%-35.7%, P < 0.001) for ZM96.C V1V2, and 81.5% versus 60.0% (difference = 21.5%, 95% CI = 7.6%-35.5%, P = 0.002) for CaseA2_gp70_V1V2.B. IgG bAb response rates to the 3 primary vaccine-matched gp120 antigens were all above 90% at both peak timepoints, with no significant differences seen, except a higher response rate to ZM96.C gp120 at month 18 versus month 12: 64.5% versus 1.6% (difference = 62.9%, 95% CI = 49.3%-76.5%, P < 0.001). CD4+ T-cell response rates were higher at month 18 than month 12 for all 3 primary vaccine-matched antigens: 47.3% versus 29.1% (difference = 18.2%, 95% CI = 2.9%-33.4%, P = 0.021) for 1086.C, 61.8% versus 38.2% (difference = 23.6%, 95% CI = 9.5%-37.8%, P = 0.001) for TV1.C, and 63.6% versus 41.8% (difference = 21.8%, 95% CI = 5.1%-38.5%, P = 0.007) for ZM96.C, with no significant differences seen at the peak timepoints. Limitations were that higher doses of gp120 were not evaluated, this study was not designed to investigate HIV prevention efficacy, and the clinical significance of the observed immunological effects is uncertain.

Conclusions: In this study, a 12-month booster of subtype C pox-protein vaccines restored immune responses, and slowed response decay compared to the 6-month vaccination.

Trial registration: ClinicalTrials.gov NCT02404311. South African National Clinical Trials Registry (SANCTR number: DOH--27-0215-4796).


Conflict of interest statement

I have read the journal's policy and the authors of this manuscript have the following competing interests: CAD is a full-time employee at Sanofi Pasteur, shareholder Sanofi. SP is a full-time employee and shareholder at Sanofi Pasteur at the time of the study, now full-time employee at GSK group companies. MK is a full-time employee of GSK group companies, having GSK shares and stock options. OVDM is a full-time employee of GSK group companies, having GSK shares. MA, MNP, VLM are full-time employee of NIH/NIAID, which is the clinical trial sponsor. ZM is a a paid statistical advisor for PLOS Medicine.

Figures

Fig 1
Fig 1. CONSORT flow diagram of the HVTN 100 trial.
Per-protocol cohort at month 6.5 is defined as receipt of the first 4 scheduled vaccinations. ADCP, antibody-dependent cellular phagocytosis; BAMA, binding antibody multiplex assay; ICS, intracellular cytokine staining; nAb, neutralizing antibody.
Fig 2
Fig 2. Stacked bar charts of maximum local and systemic reactogenicity over all vaccinations.
Local (A) and systemic (B) reactogenicity events. P values indicate differences between vaccine and placebo groups. Reactogenicity event grading color-code: red = life-threatening, orange = severe, pink = moderate, dark blue = mild, light blue = none.
Fig 3
Fig 3. Summary of response rates and magnitudes of IgG binding antibodies to gp120 and V1V2 antigens among per-protocol vaccine recipients of HVTN 100.
Responses to gp120 (A–C) and V1V2 antigens (D–G). Bar charts show response rates with 2-sided 95% CIs. Boxplots show magnitude as log10 (MFI-blank) responses to individual gp120 and V1V2 antigens and are based on positive responders, shown as solid blue circles; negative responders are shown as grey triangles. Grey lines connect the response magnitude of each per-protocol vaccine recipient over time. M[number], month [number]; vac, vaccination.
Fig 4
Fig 4. Breadth of IgG binding antibody responses to gp120, gp140, and V1V2 antigens among per-protocol vaccine recipients of HVTN 100.
Responses to gp120 (A), gp140 (B), and V1V2 (C) antigens. Each point represents the area under the magnitude–breadth curve for an individual vaccine recipient, calculated as the average of the log10 (MFI-blank) over the panel of antigens, where antigens are listed in the footnote below each plot. Dashed lines connect the area under the magnitude–breadth curve of each per-protocol vaccine recipient over time. AUC, area under the curve; M[number], month [number]; vac, vaccination.
Fig 5
Fig 5. Summary of response rates and magnitudes of antibody-dependent cellular phagocytosis to 1086.C gp140 among per-protocol vaccine recipients of HVTN 100.
Bar charts show response rates with 2-sided 95% CIs. Boxplots show magnitude as mean phagocytosis scores to 1086.C gp140 and are based on positive responders, shown as solid blue circles; negative responders are shown as grey triangles. Grey lines connect the response magnitude of each per-protocol vaccine recipient over time. M[number], month [number]; vac, vaccination.
Fig 6
Fig 6. Summary of response rates and magnitudes, functionality and polyfunctionality scores, and heatmap of average COMPASS posterior probabilities of CD4+ T-cell responses to vaccine-matched Env ZM96.C among per-protocol vaccine recipients of HVTN 100.
In (A), bar charts show response rates with 2-sided 95% CIs, and boxplots show response magnitude as the percent expression of IFN-γ, IL-2, or CD40L by CD4+ T cells to Env ZM96.C and are based on positive responders, shown as colored circles (solid circles denote durability subset participants, open circles denote non-durability subset participants); negative responders are shown as grey triangles. Boxplots in (B) show functionality and polyfunctionality scores of CD4+ T-cell subsets recognizing Env ZM96.C; solid circles denote durability subset participants, and open circles denote non-durability subset participants. In the boxplots in (A) and (B), grey lines connect the response magnitude of each per-protocol vaccine recipient over time. In (C), each cell of the heatmap shows the average probability, modeled by COMPASS, that a given cell subset (indicated by bottom panel column) has an antigen-specific response at the corresponding timepoint (row), where the probability is color-coded from white (0) to purple (1). The columns in the bottom panel correspond to cellular subsets, color-coded in blue, green, and pink by the cytokines they express. M[number], month [number]; Trt, treatment; vac, vaccination.
Fig 7
Fig 7. Memory sub-populations of 1086.C gp120, TV1.C gp120, and ZM96.C antigen-specific CD4+ T cells amongst vaccine recipients in HVTN 100.
Memory sub-populations of 1086.C (A), TV1.C (B), and ZM96.C (C) antigen-specific CD4+ T cells. Frequencies of central memory (dark blue symbols, CD45RACCR7+), effector memory (red symbols, CD45RACCR7), naïve (teal symbols, CD45RA+CCR7+), and terminally differentiated (orange symbols, CD45RA+CCR7) CD4+ T cells expressing IFN-γ or IL-2 out of total CD4+ T cells are shown 2 weeks after the fourth vaccination (month 6.5), 6 months after the fourth vaccination (month 12), 2 weeks after the fifth vaccination (month 12.5), and 6 months after the fifth vaccination (month 18). Black circles represent median antigen-specific sub-populations at each timepoint. Dashed lines connect the frequencies of each memory sub-population for each per-protocol vaccine recipient over time. M[number], month [number]; vac, vaccination.
Fig 8
Fig 8. Summary of response rates and magnitudes to vaccine-matched TV1c8.2.C and tier 1A MW965.26.C among per-protocol vaccine recipients of HVTN 100.
Responses to (A) TV1c8.2.C and (B) MW965.26.C. Bar charts show response rates with 2-sided 95% CIs. Boxplots show response magnitude as the ID50 neutralizing antibody titer and are based on positive responders, shown as solid blue circles; negative responders are shown as grey triangles. Grey lines connect the response magnitude of each per-protocol vaccine recipient over time. M[number], month [number]; vac, vaccination.

References

    1. Rerks-Ngarm S, Pitisuttithum P, Nitayaphan S, Kaewkungwal J, Chiu J, Paris R, et al. Vaccination with ALVAC and AIDSVAX to prevent HIV-1 infection in Thailand. N Engl J Med. 2009;361(23):2209–20. 10.1056/NEJMoa0908492 - DOI - PubMed
    1. Corey L, Gilbert PB, Tomaras GD, Haynes BF, Pantaleo G, Fauci AS. Immune correlates of vaccine protection against HIV-1 acquisition. Sci Transl Med. 2015;7(310):310rv7 10.1126/scitranslmed.aac7732 - DOI - PMC - PubMed
    1. Lewis GK, DeVico AL, Gallo RC. Antibody persistence and T-cell balance: two key factors confronting HIV vaccine development. Proc Natl Acad Sci U S A. 2014;111(44):15614–21. 10.1073/pnas.1413550111 - DOI - PMC - PubMed
    1. Robb ML, Rerks-Ngarm S, Nitayaphan S, Pitisuttithum P, Kaewkungwal J, Kunasol P, et al. Risk behaviour and time as covariates for efficacy of the HIV vaccine regimen ALVAC-HIV (vcp1521) and AIDSVAX B/E: a post-hoc analysis of the Thai phase 3 efficacy trial RV 144. Lancet Infect Dis. 2012;12(7):531–7. 10.1016/S1473-3099(12)70088-9 - DOI - PMC - PubMed
    1. Yates NL, Liao HX, Fong Y, deCamp A, Vandergrift NA, Williams WT, et al. Vaccine-induced Env V1-V2 IgG3 correlates with lower HIV-1 infection risk and declines soon after vaccination. Sci Transl Med. 2014;6(228):228ra39 10.1126/scitranslmed.3007730 - DOI - PMC - PubMed

Publication types

MeSH terms

Associated data