Heavy precipitation, drinking water source, and acute gastrointestinal illness in Philadelphia, 2015-2017
- PMID: 32092111
- PMCID: PMC7039462
- DOI: 10.1371/journal.pone.0229258
Heavy precipitation, drinking water source, and acute gastrointestinal illness in Philadelphia, 2015-2017
Abstract
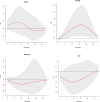
Runoff from heavy precipitation events can lead to microbiological contamination of source waters for public drinking water supplies. Philadelphia is a city of interest for a study of waterborne acute gastrointestinal illness (AGI) because of frequent heavy precipitation, extensive impervious landcover, and combined sewer systems that lead to overflows. We conducted a time-series analysis of the association between heavy precipitation and AGI incidence in Philadelphia, served by drinking water from Delaware River and Schuylkill River source waters. AGI cases on each day during the study period (2015-2017) were captured through syndromic surveillance of patients' chief complaint upon presentation at local emergency departments. Daily precipitation was represented by measurements at the Philadelphia International Airport and by modeled precipitation within the watershed boundaries, and we also evaluated stream flowrate as a proxy of precipitation. We estimated the association using distributed lag nonlinear models, assuming a quasi-Poisson distribution of the outcome variable and with adjustment for potential confounding by seasonal and long-term time trends, ambient temperature, day-of-week, and major holidays. We observed an association between heavy precipitation and AGI incidence in Philadelphia that was primarily limited to the spring season, with significant increases in AGI that peaked from 8 to 16 days following a heavy precipitation event. For example, the increase in AGI incidence related to airport precipitation above the 95th percentile (vs no precipitation) during spring reached statistical significance on lag day 7, peaked on day 16 (102% increase, 95% confidence interval: 16%, 252%), and declined while remaining significantly elevated through day 28. Similar associations were observed in analyses of watershed-specific precipitation in relation to AGI cases within the populations served by drinking water from each river. Our results suggest that heavy precipitation events in Philadelphia result in detectable local increases in waterborne AGI.
Conflict of interest statement
The authors have declared that they have no competing interests.
Figures


References
-
- IPCC, 2014. Climate Change 2014: Synthesis Report. Contribution of Working Groups I, II and III to the Fifth Assessment Report of the Intergovernmental Panel on Climate Change. [Core Writing Team, Pachauri RK and Meyer LA, editors)]. IPCC, Geneva, Switzerland, 151 pp.
-
- Easterling DR, Kunkel KE, Arnold JR, Knutson T, LeGrande AN, Leung LR, et al. Precipitation change in the United States. In: Wuebbles DJ, Fahey DW, Hibbard KA, Dokken DJ, Stewart BC, Maycock TK, editors. Climate Science Special Report: Fourth National Climate Assessment, Volume I. US Global Change Research Program, Washington, DC, USA. pp. 207–230.
-
- Guzman Herrador BR, de Blasio BF, MacDonald E, Nichols G, Sudre B, Vold L, et al. Analytical studies assessing the association between extreme precipitation or temperature and drinking water-related waterborne infections: a review. Environ Health. 2015;14: 29 10.1186/s12940-015-0014-y - DOI - PMC - PubMed
-
- Jagai JS, Li Q, Wang S, Messier KP, Wade TJ, Hilborn ED. Extreme precipitation and emergency room visits for gastrointestinal illness in areas with and without combined sewer systems: an analysis of Massachusetts data, 2003–2007. Environ Health Perspect. 2015;123: 873–879. 10.1289/ehp.1408971 - DOI - PMC - PubMed
-
- Nowak DJ, Greenfield EJ. Tree and impervious cover change in US cities. Urban For Urban Green 2012;11: 21–30.
Publication types
MeSH terms
Substances
LinkOut - more resources
Full Text Sources
Medical

