. 2020 Mar 27;23(3):100899.
doi: 10.1016/j.isci.2020.100899. Epub 2020 Feb 8.

A Pivotal Genetic Program Controlled by Thyroid Hormone during the Maturation of GABAergic Neurons

Affiliations

A Pivotal Genetic Program Controlled by Thyroid Hormone during the Maturation of GABAergic Neurons

Sabine Richard et al. iScience. .

Abstract

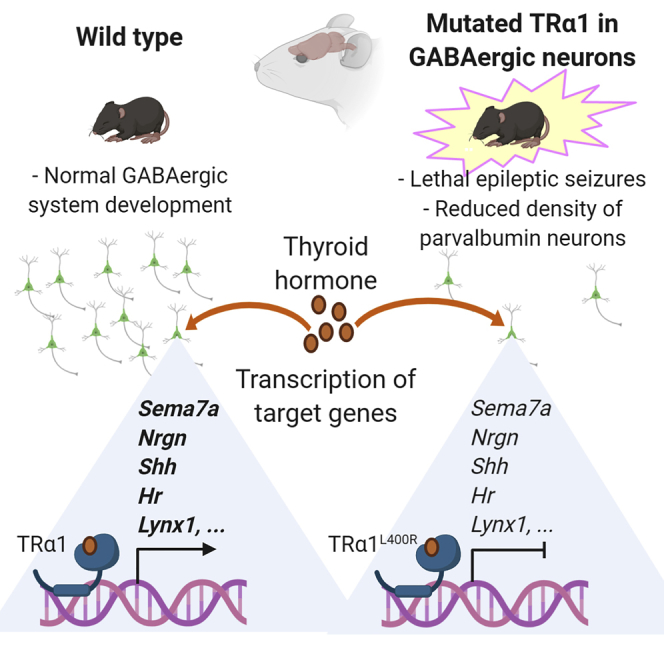
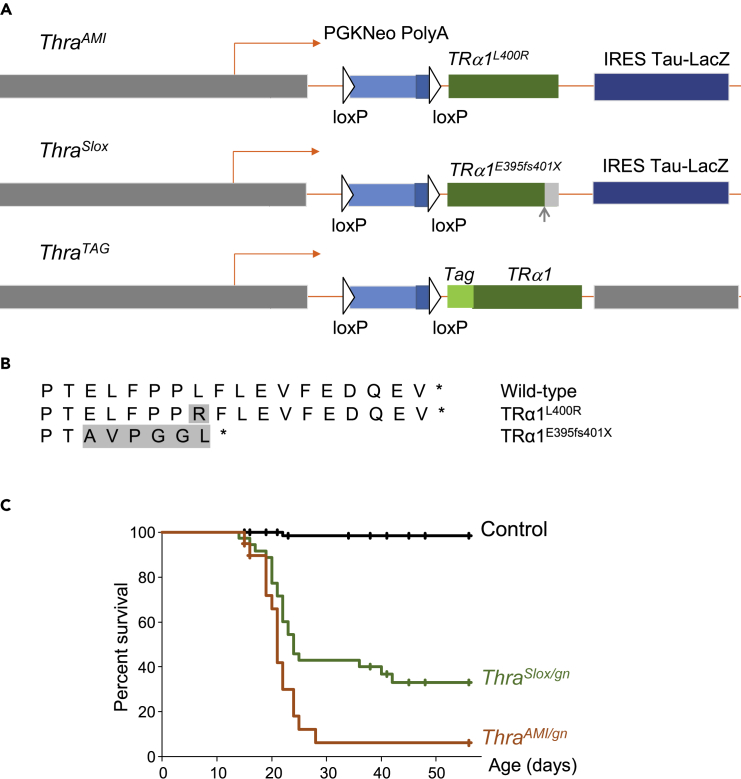
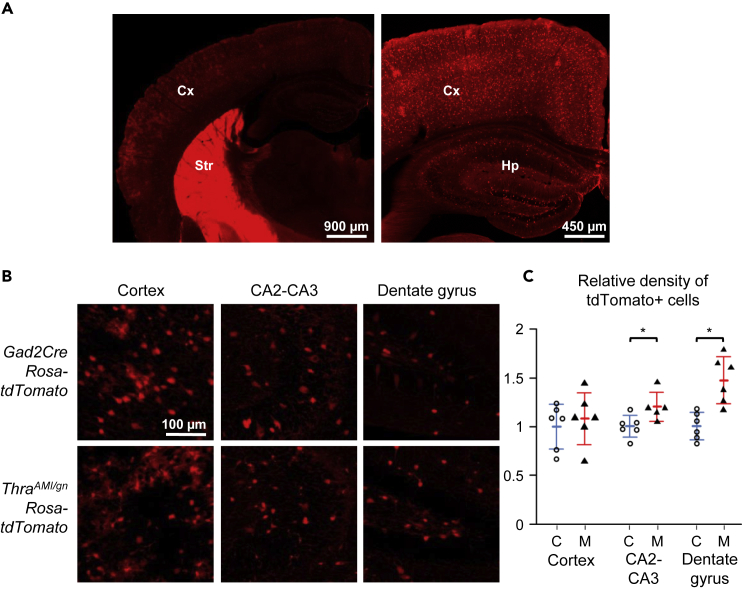
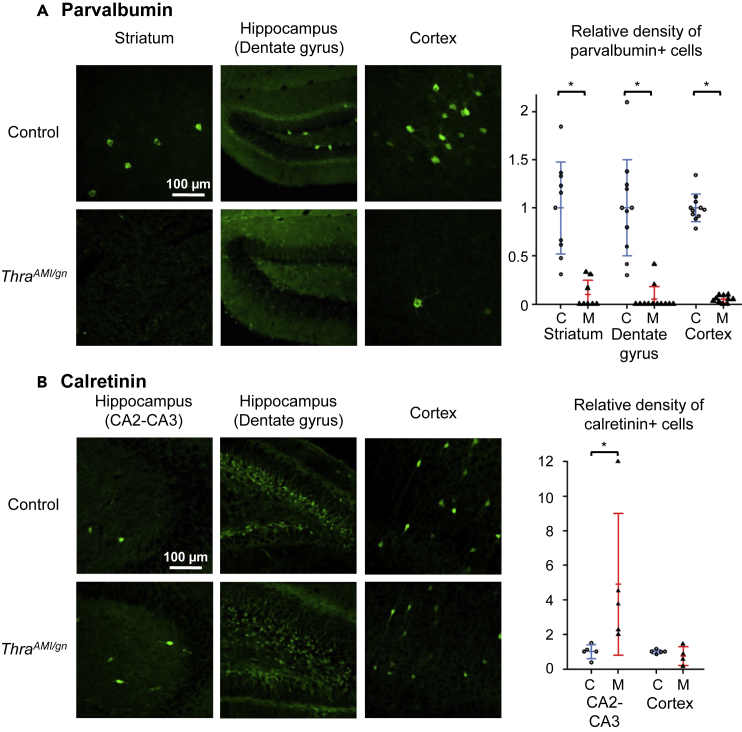
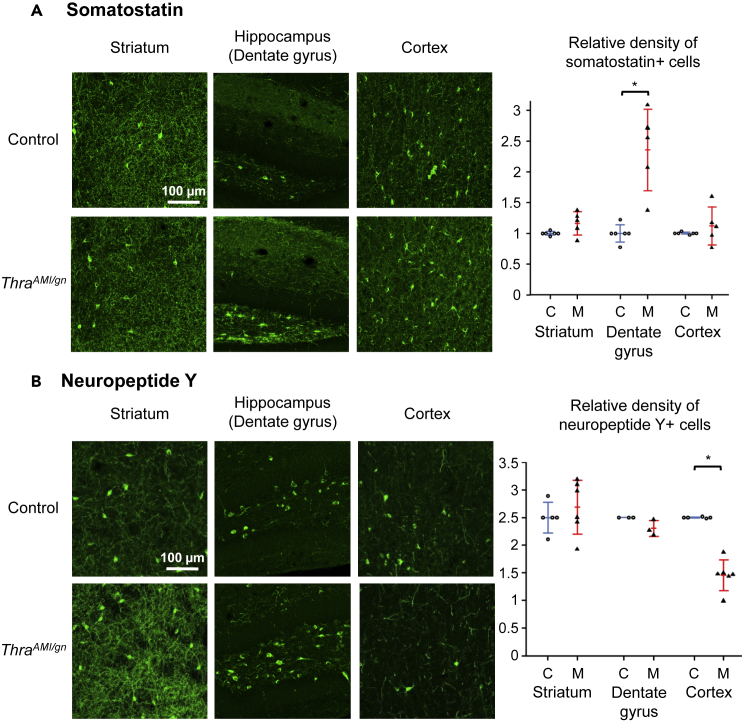
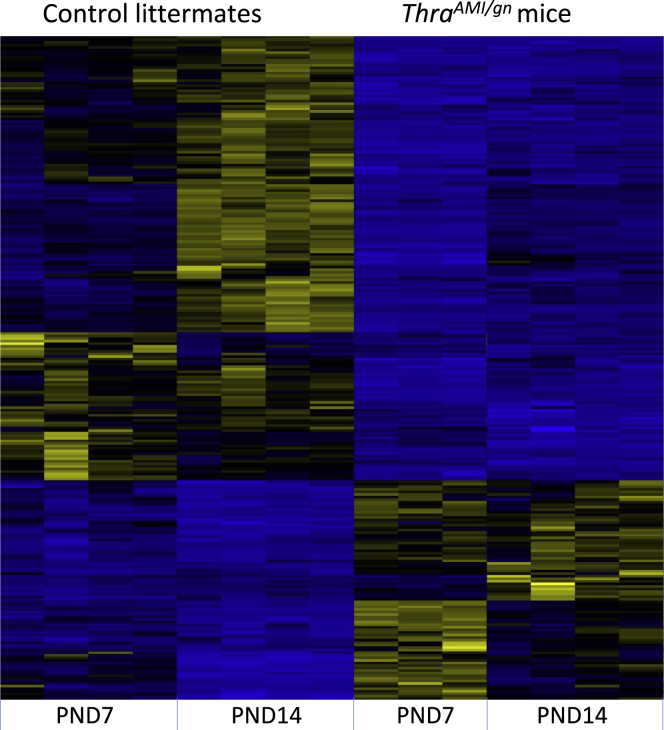
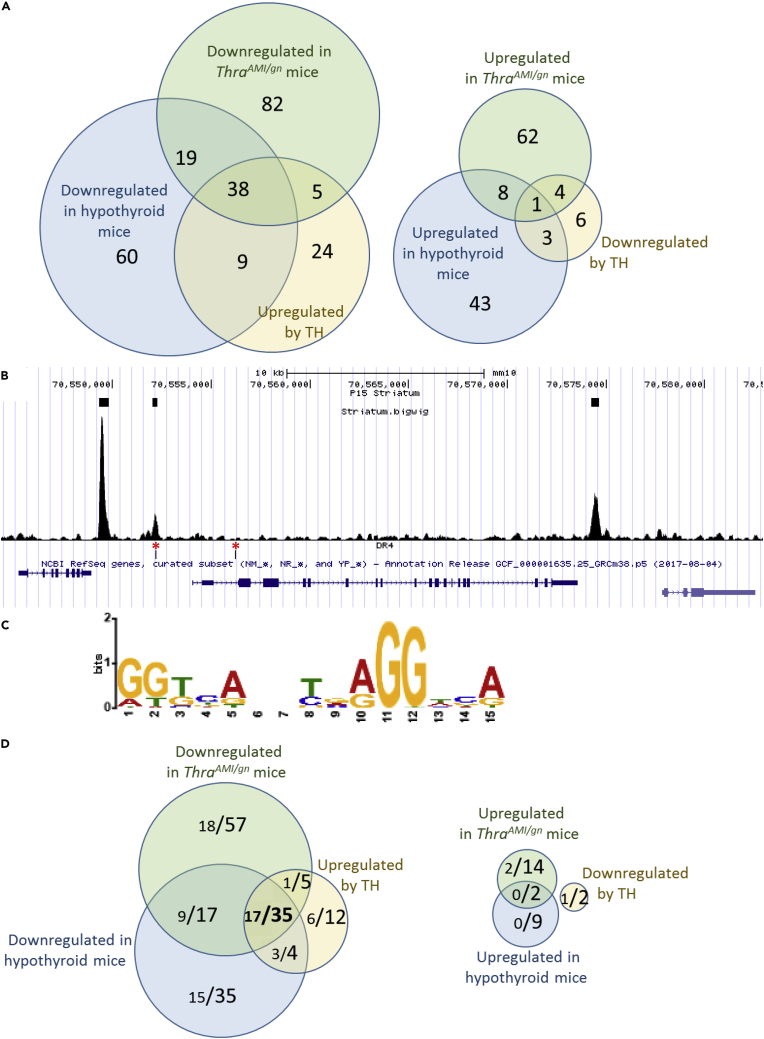
Mammalian brain development critically depends on proper thyroid hormone signaling, via the TRα1 nuclear receptor. The downstream mechanisms by which TRα1 impacts brain development are currently unknown. In order to investigate these mechanisms, we used mouse genetics to induce the expression of a dominant-negative mutation of TRα1 specifically in GABAergic neurons, the main inhibitory neurons in the brain. This triggered post-natal epileptic seizures and a profound impairment of GABAergic neuron maturation in several brain regions. Analysis of the transcriptome and TRα1 cistrome in the striatum allowed us to identify a small set of genes, the transcription of which is upregulated by TRα1 in GABAergic neurons and which probably plays an important role during post-natal maturation of the brain. Thus, our results point to GABAergic neurons as direct targets of thyroid hormone during brain development and suggest that many defects seen in hypothyroid brains may be secondary to GABAergic neuron malfunction.

Keywords: Developmental Neuroscience; Molecular Neuroscience; Neuroscience.


Conflict of interest statement

Declaration of Interests The authors declare no competing interest.

Figures

None
Graphical abstract
Figure 1
Figure 1
Thra Alleles and Survival Curves (A) Schematic representation of Thra alleles in ThraAMI, ThraSlox and ThraTAG mice. In all 3 alleles, the coding sequence is preceded with a floxed stop cassette (PGKNeo Poly(A). The intronless structure eliminates alternate splicing and internal promoter and thus prevents the production of TRα2, TRΔα1, and TRΔα2 non-receptor protein. The dispensable IRES Tau-lacZ reporter part was not included in the ThraTAG construct. (B) C-terminal amino acid sequence of Thra gene products used in the present study, starting from AA393. Shaded amino acids differ from wild-type TRα1. ThraAMI mutation results in a single amino acid substitution within TRα1 helix 12. ThraSlox mutation is a deletion resulting in a +1 frameshift, leading to elimination of helix 12, as in several RTHα patients. (C) Survival curves of mice expressing a mutated TRα1 in GABAergic neurons (green and red lines) and of control littermates (black line). See also Figures S1–S3 and Videos S1 and S2.
Figure 2
Figure 2
Expression of the tdTomato Fluorescent Protein in TRαAMI/gnRosa-tdTomato and Control Littermates at PND14 (A) Low-magnification images illustrating the relative fluorescence intensity in the cortex (Cx), striatum (Str), and hippocampus (Hp) in GAD2Cre Rosa-tdTomato mice. (B) Representative images allowing to compare the density of tdTomato positive cells in selected brain regions in ThraAMI/gnRosa-tdTomato and control littermates (GAD2Cre Rosa-tdTomato). (C) Relative density of tdTomato + cells in ThraAMI/gnRosa-tdTomato (“M” in the graph stands for mutants, filled triangles; red lines for the mean and standard deviation) and control littermates (“C”, empty circles; blue lines for the mean and standard deviation) at PND14. *p < 0.05.
Figure 3
Figure 3
Immunohistochemistry for Parvalbumin and Calretinin Immunohistochemistry for parvalbumin (A) and calretinin (B) in PND14 ThraAMI/gn and control mouse pups in selected brain regions. Right panels: scatterplots illustrating the relative density of immunoreactive cells in control (C, empty circles; blue lines for the mean and standard deviation) and mutant (M, filled triangles; red lines for the mean and standard deviation) mice. Calretinin-immunoreactive neurons could not be quantified in the dentate gyrus, due to the difficulty in delineating individual cells in this area. *p < 0.05. See also Figures S4–S7.
Figure 4
Figure 4
Immunohistochemistry for Somatostatin and Neuropeptide Y Immunohistochemistry for somatostatin (A) and neuropeptide Y (B) in PND14 ThraAMI/gn and control mouse pups in the striatum, hippocampus, and cortex. Right panels: scatterplots illustrating the relative density of immunoreactive cells in control (C, empty circles; blue lines for the mean and standard deviation) and mutant (M, filled triangles; red lines for the mean and standard deviation) mice. *p < 0.05. See also Figures S6 and S7.
Figure 5
Figure 5
Differentially Expressed Genes in the Striatum Hierarchical clustering analysis of differentially expressed transcripts in the striatum of ThraAMI/gn mice and control littermates at PND7 and PND14. The analysis is restricted to 260 genes for which the fold-change is > 2 or <0.5 (adjusted p value < 0.05) for at least one developmental stage. High expression is in yellow, low expression is in blue, average in black. Note that the changes in gene expression between PND7 and PND14 are more conspicuous in control than in mutant mice, suggesting that a maturation process is blunted by the mutation. See also Figure S8 and Tables S2 and S4.
Figure 6
Figure 6
Identifying a Core Set of TRα1 Target Genes in GABAergic Neurons of the Striatum by Combining RNAseq and Chip-Seq Analyses (A) RNAseq identifies a set of 38 genes, the expression pattern of which is fully consistent with a positive regulation by TRα1, and only 1 gene that has the opposite expression pattern. (B) Extract of the Mus musculus genome browser, around the Hr gene, a well-characterized TRα1 target gene. The 3 upper boxes indicate TRBSs identified as significant by the MACS2 algorithm. Note that a DR4-like element (lower track, red asterisks), as defined below, is found in only one of the 3 peaks. (C) Consensus sequence found in TRBSs identified by de novo motif search is close to the DR4 consensus (5′AGGTCANNNNAGGTCA-3′). (D) Combinations of RNAseq and Chip-Seq data. In the Venn diagrams, each fraction gives the number of genes with a proximal TRBS (<30 kb for transcription start site, large lettering) and, among these genes, those in which a DR4 element was identified (small lettering). A set of 35 genes fulfill the criteria for being considered as genuine TRα1 target genes: they are downregulated in hypothyroid and mutant mice and upregulated after TH treatment of hypothyroid mice. For 17 of these genes, the TRBS contains a recognizable DR4-like element. See also Data S1 and Tables S2–S5.

References

    1. Ayers S., Switnicki M.P., Angajala A., Lammel J., Arumanayagam A.S., Webb P. Genome-wide binding patterns of thyroid hormone receptor Beta. PLoS One. 2014;9:e81186. - PMC - PubMed
    1. Bagamasbad P., Howdeshell K.L., Sachs L.M., Demeneix B.A., Denver R.J. A role for basic transcription element-binding protein 1 (BTEB1) in the autoinduction of thyroid hormone receptor beta. J. Biol. Chem. 2008;283:2275–2285. - PubMed
    1. Berbel P., Marco P., Cerezo J.R., DeFelipe J. Distribution of parvalbumin immunoreactivity in the neocortex of hypothyroid adult rats. Neurosci. Lett. 1996;204:65–68. - PubMed
    1. Berbel P., Navarro D., Roman G.C. An evo-devo approach to thyroid hormones in cerebral and cerebellar cortical development: etiological implications for autism. Front. Endocrinol. 2014;5:146. - PMC - PubMed
    1. Bernal J. Action of thyroid hormone in brain. J. Endocrinol. Invest. 2002;25:268–288. - PubMed