. 2020 Apr 6;147(7):dev184507.
doi: 10.1242/dev.184507.

Myosin heavy chain-embryonic regulates skeletal muscle differentiation during mammalian development

Affiliations

Myosin heavy chain-embryonic regulates skeletal muscle differentiation during mammalian development

Megha Agarwal et al. Development. .

Abstract

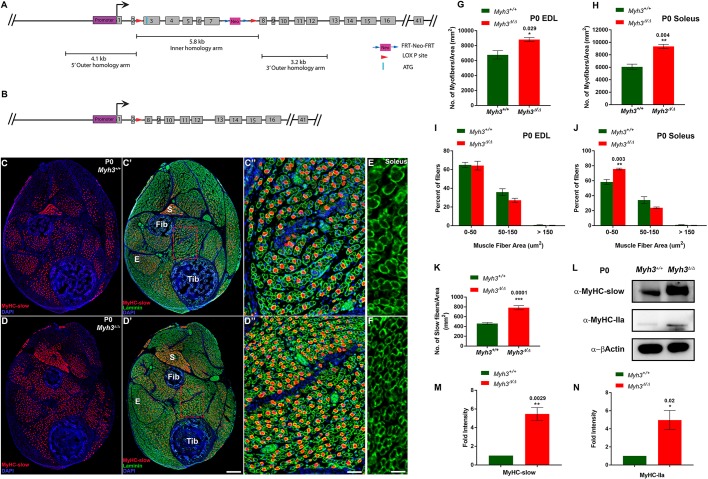
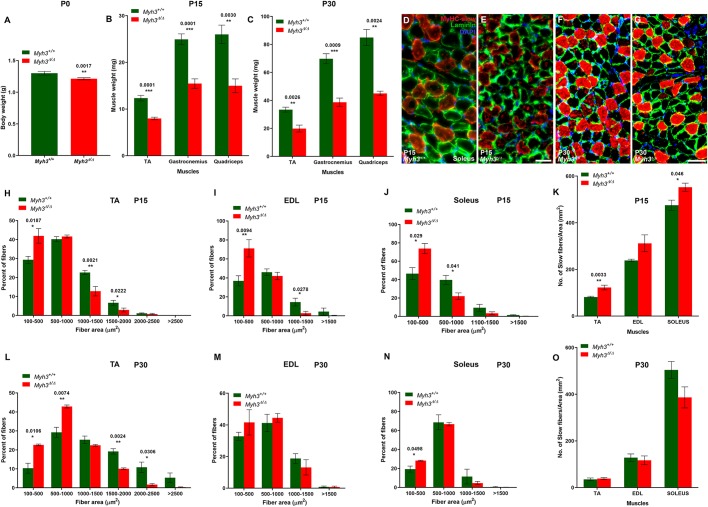
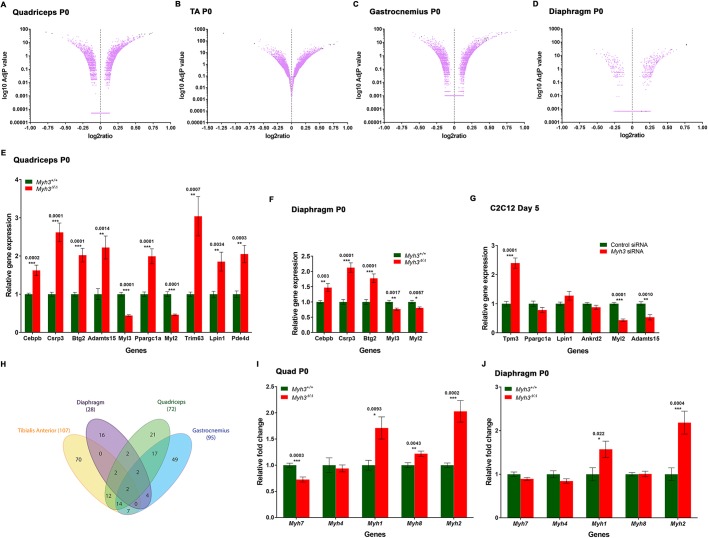
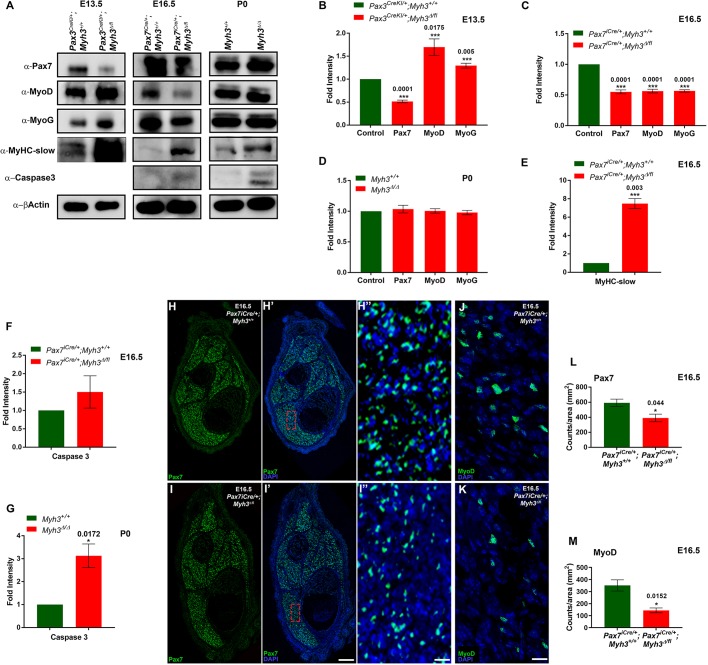
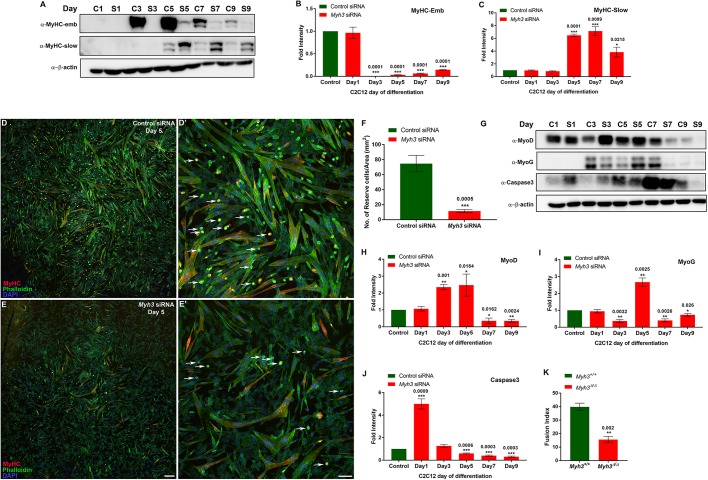
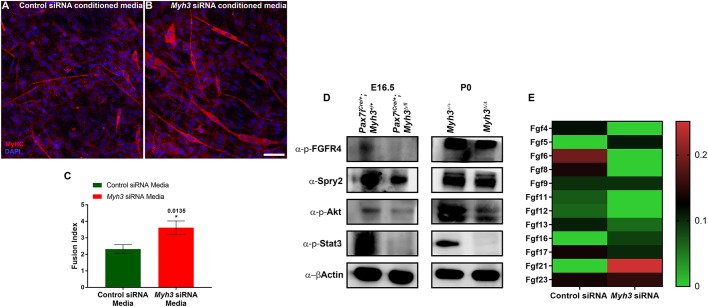
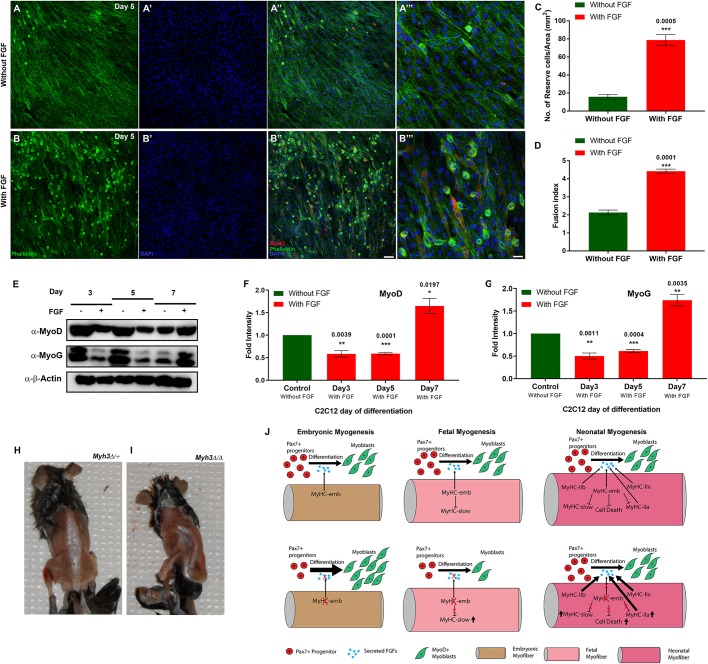
Myosin heavy chain-embryonic (MyHC-emb) is a skeletal muscle-specific contractile protein expressed during muscle development. Mutations in MYH3, the gene encoding MyHC-emb, lead to Freeman-Sheldon and Sheldon-Hall congenital contracture syndromes. Here, we characterize the role of MyHC-emb during mammalian development using targeted mouse alleles. Germline loss of MyHC-emb leads to neonatal and postnatal alterations in muscle fiber size, fiber number, fiber type and misregulation of genes involved in muscle differentiation. Deletion of Myh3 during embryonic myogenesis leads to the depletion of the myogenic progenitor cell pool and an increase in the myoblast pool, whereas fetal myogenesis-specific deletion of Myh3 causes the depletion of both myogenic progenitor and myoblast pools. We reveal that the non-cell-autonomous effect of MyHC-emb on myogenic progenitors and myoblasts is mediated by the fibroblast growth factor (FGF) signaling pathway, and exogenous FGF rescues the myogenic differentiation defects upon loss of MyHC-emb function in vitro Adult Myh3 null mice exhibit scoliosis, a characteristic phenotype exhibited by individuals with Freeman-Sheldon and Sheldon-Hall congenital contracture syndrome. Thus, we have identified MyHC-emb as a crucial myogenic regulator during development, performing dual cell-autonomous and non-cell-autonomous functions.This article has an associated 'The people behind the papers' interview.

Keywords: Development; FGF; Mice; Muscle progenitors; Myogenesis; Myosin heavy chain-embryonic; Signaling; Skeletal muscle.


Conflict of interest statement

Competing interestsThe authors declare no competing or financial interests.

Figures

Fig. 1.
Fig. 1.
Loss of MyHC-embryonic leads to neonatal myogenic differentiation defects. (A,B) Schematics depicting the Myh3fl3-7 allele, where LoxP sites (red arrowheads) flank exons 3-7 (A) and the Myh3Δ allele lacking exons 3-7 of Myh3 (B). (C-D″) Cross-sections through the hind limbs of P0 Myh3+/+ (C,C′) and Myh3Δ/Δ (D,D′) mice labeled by immunofluorescence for MyHC-slow (red), laminin (green) and DAPI (blue). ‘E’ and ‘S’ denote EDL and soleus muscles, respectively, and ‘Tib’ and ‘Fib’ denote tibia and fibula bones, respectively, in C′ and D′; C″ and D″ are magnifications of boxed areas of the flexor digitorum longus (FDL) muscle from C′ and D′, respectively. (E,F) Laminin (green) labeling on sections through the soleus muscles of P0 Myh3+/+ (E) and Myh3Δ/Δ (F) mice. (G,H) Quantification of myofiber number through the EDL (G) and soleus (H) muscles of P0 Myh3+/+ and Myh3Δ/Δ mice. (I,J) Quantification of myofiber area through the EDL (I) and soleus (J) muscles of P0 Myh3+/+ and Myh3Δ/Δ mice, grouped into 0-50 µm2, 50-150 µm2 and above 150 µm2. (K) Quantification of MyHC-slow+ fibers from P0 Myh3+/+ and Myh3Δ/Δ shank whole cross-section normalized to total area. (L-N) Western blots for MyHC-slow, MyHC-IIa and β-actin from P0 Myh3+/+ and Myh3Δ/Δ mice hind limb protein lysates (L) and densitometric quantification (M,N). Data are mean±s.e.m. of a minimum of three independent experiments. Scale bars: 200 μm (D′); 40 μm (D″); 20 μm (F).
Fig. 2.
Fig. 2.
Loss of MyHC-embryonic leads to postnatal myogenic differentiation defects. (A) Graph showing body weight of P0 Myh3+/+ and Myh3Δ/Δ pups. (B,C) Graphs showing TA, gastrocnemius and quadriceps muscle weights of Myh3+/+ and Myh3Δ/Δ animals at P15 (B) and P30 (C). (D-G) Representative images from cross-sections through the soleus of P15 and P30 Myh3+/+ mice (D,F), and Myh3Δ/Δ (E,G) mice labeled by immunofluorescence for MyHC-slow (red), laminin (green) and DAPI (blue). (H-J) Quantification of myofiber area through the TA (H), EDL (I) and soleus (J) muscles of P15 Myh3+/+ and Myh3Δ/Δ mice, grouped into 100-500 µm2, 500-1000 µm2, 1000-1500 µm2, above 1500 µm2 (for EDL and soleus), 1500-2000 µm2 (for TA), 2000-2500 µm2 (for TA) and above 2500 µm2 (for TA). (K) Quantification of MyHC-slow+ fibers in cross-sections of the TA, EDL and soleus muscles of P15 Myh3+/+ and Myh3Δ/Δ mice normalized to total area. (L-N) Quantification of myofiber area through the TA (L), EDL (M) and soleus (N) muscles of P30 Myh3+/+ and Myh3Δ/Δ mice, grouped into 100-500 µm2, 500-1000 µm2, 1000-1500 µm2, above 1500 µm2 (for EDL and soleus), 1500-2000 µm2 (for TA), 2000-2500 µm2 (for TA) and above 2500 µm2 (for TA). (O) Quantification of MyHC-slow+ fibers in cross-sections of the TA, EDL and soleus muscles of P30 Myh3+/+ and Myh3Δ/Δ mice normalized to total area. Data are mean±s.e.m. of a minimum of three independent experiments. Scale bars: 25 μm (E); 50 μm (G).
Fig. 3.
Fig. 3.
Loss of MyHC-embryonic leads to global misregulation of genes involved in myogenic differentiation. (A-D) Volcano plots depicting results from the RNA-Seq experiment comparing P0 Myh3+/+ and Myh3Δ/Δ samples for quadriceps (A), TA (B), gastrocnemius (C) and diaphragm (D) muscles. The adjusted P-values are on a log10 scale, and significantly up- or down regulated candidates are marked as dark spots on the volcano plot. (E,F) Selected candidate genes from the RNA-Seq were validated by qPCR for quadriceps (E) and diaphragm (F). (G) Candidates from the RNA-Seq were tested on Myh3 or control siRNA-treated C2C12 cells at day 5. (H) Venn diagram depicting the number of candidate genes obtained and the degree of overlap in the RNA-Seq results comparing P0 Myh3+/+ and Myh3Δ/Δ muscles. (I,J) Quantification of Myh isoform transcript levels by qPCR on P0 quadriceps (I) and diaphragm (J) muscles of Myh3+/+ and Myh3Δ/Δ mice. The graphical data represent the mean±s.e.m. of a minimum of three independent experiments.
Fig. 4.
Fig. 4.
MyHC-embryonic non-cell-autonomously regulates myogenic progenitor differentiation during embryonic and fetal myogenesis. (A-G) Western blots for Pax7, MyoD, myogenin, MyHC-slow, caspase 3 and β-actin on protein lysates from hind limbs of E13.5 Pax3CreKI/+;Myh3Δ/fl3-7, E16.5 Pax7iCre/+; Myh3Δ/fl3-7 and P0 Myh3Δ/Δ, and controls (A); and their densitometric quantification (B-G). (H-I″) Immunofluorescence for Pax7 (green) and DAPI (blue) on cross-sections from E16.5 control (H-H″) and Pax7iCre/+;Myh3Δ/fl3-7 (I-I″) embryo hind limbs; H″ and I″ are magnifications of boxed areas from H′ and I′, respectively. (J,K) Immunofluorescence for MyoD (green) and DAPI (blue) on cross-sections from E16.5 control (J) and Pax7iCre/+;Myh3Δ/fl3-7 (K) embryo hind limbs. (L,M) Quantification of Pax7+ myogenic progenitors (L) and MyoD+ myoblast numbers (M) normalized to total area from E16.5 Pax7iCre/+;Myh3Δ/fl3-7 and the control embryo. Data are mean±s.e.m. of a minimum of three independent experiments. Scale bars: 200 μm (I′); 20 μm (I″ and K).
Fig. 5.
Fig. 5.
Myh3 depletion causes reduction in reserve cell number and decreased fusion index. (A-C) Western blots for MyHC-emb, MyHC-slow and β-actin on control and Myh3 siRNA-treated C2C12 cells over 9 days of differentiation (A), and densitometric quantification (B,C); ‘C’ and ‘S’ denote control and Myh3 siRNA along with the specific day of differentiation (A). (D-E′) MyHC (red), phalloidin (green) and DAPI (blue) immunofluorescence on control (D,D′) and Myh3 (E,E′) siRNA-treated C2C12 cells at day 5 of differentiation (D′ and E′ are magnifications from D and E, respectively, with white arrows marking reserve cells). (F) Quantification of reserve cell number per unit area (mm2) from control and Myh3 siRNA-treated C2C12 cells. (G-J) Western blots for MyoD, myogenin, caspase 3 and β-actin on control and Myh3 siRNA-treated C2C12 cells during differentiation (G) and densitometric quantification (H-J); ‘C’ and ‘S’ denote control and Myh3 siRNA along with the specific day of differentiation (G). (K) Fusion index of myofibers formed by differentiating myoblasts for 7 days, isolated from Myh3+/+ and Myh3Δ/Δ P0 mice, for which representative images are shown in Fig. S5C,D. Data are mean±s.e.m. of a minimum of three independent experiments. Scale bars: 100 μm (E); 25 μm (E′).
Fig. 6.
Fig. 6.
The non-cell-autonomous effect of MyHC-embryonic on myogenesis is mediated by FGF signaling. (A-C) Immunofluorescence labeling for MyHC (red) and DAPI (blue) on C2C12 cells differentiated for 4 days in conditioned media from control and Myh3 siRNA-treated cells (A,B) and quantification of the fusion index (C). (D) Western blots for p-FGFR4, Spry2, p-Akt, p-Stat3 and β-actin on protein lysates from E16.5 Pax7iCre/+;Myh3Δ/fl3-7 and P0 Myh3Δ/Δ compared with controls. (E) Mass spectrometric analysis of secretome showing an abundance of FGF ligands in control and Myh3 siRNA-treated C2C12 cells. The graphical data represent the mean±s.e.m. of a minimum of three independent experiments. Scale bar: 25 μm.
Fig. 7.
Fig. 7.
Supplementation of FGF rescues the effect of loss of MyHC-embryonic on myogenesis. (A-B‴) Immunofluorescence labeling for MyHC (red), phalloidin (green) and DAPI (blue) on C2C12 cells at day 5, where Myh3 has been knocked down, treated with control media without FGF (A-A‴) or with FGF-supplemented media (B-B‴); A‴ and B‴ are magnifications from A″ and B″, respectively. (C,D) Quantification of reserve cell number per unit area (mm2) (C) and fusion index (D) from Myh3 siRNA-treated C2C12 cells at day 5, treated with FGF-supplemented media compared with the control. (E-G) Western blots for MyoD, myogenin and β-actin on Myh3 siRNA-treated C2C12 cells at days 3, 5 and 7 of differentiation, grown in the presence or absence of FGF (E), and densitometric quantification (F-G). The symbols, ‘−’ and ‘+’ denote absence or presence of FGF in the media (E). (H,I) Six-week old Myh3Δ/Δ mice exhibit scoliosis (I), compared with control Myh3Δ/+ animals (H). (J) Model summarizing the cell-autonomous and non-cell-autonomous roles of MyHC-embryonic during embryonic, fetal and neonatal myogenesis, where it regulates FGF levels, which control the rate of myogenic differentiation. Data are mean±s.e.m. of a minimum of three independent experiments. Scale bars: 100 μm (B″); 33 μm (B‴).

References

    1. Acakpo-Satchivi L. J. R., Edelmann W., Sartorius C., Lu B. D., Wahr P. A., Watkins S. C., Metzger J. M., Leinwand L. and Kucherlapati R. (1997). Growth and muscle defects in mice lacking adult myosin heavy chain genes. J. Cell Biol. 139, 1219-1229. 10.1083/jcb.139.5.1219 - DOI - PMC - PubMed
    1. Allen D. L. and Leinwand L. A. (2001). Postnatal myosin heavy chain isoform expression in normal mice and mice null for IIb or IId myosin heavy chains. Dev. Biol. 229, 383-395. 10.1006/dbio.2000.9974 - DOI - PubMed
    1. Allen D. L., Harrison B. C. and Leinwand L. A. (2000). Inactivation of myosin heavy chain genes in the mouse: diverse and unexpected phenotypes. Microsc. Res. Tech. 50, 492-499. 10.1002/1097-0029(20000915)50:6<492::AID-JEMT6>3.0.CO;2-J - DOI - PubMed
    1. Allen D. L., Harrison B. C., Sartorius C., Byrnes W. C. and Leinwand L. A. (2001). Mutation of the IIB myosin heavy chain gene results in muscle fiber loss and compensatory hypertrophy. Am. J. Physiol. Cell Physiol. 280, C637-C645. 10.1152/ajpcell.2001.280.3.C637 - DOI - PubMed
    1. Alli N. S., Yang E. C., Miyake T., Aziz A., Collins-Hooper H., Patel K. and McDermott J. C. (2013). Signal-dependent fra-2 regulation in skeletal muscle reserve and satellite cells. Cell Death Dis. 4, e692 10.1038/cddis.2013.221 - DOI - PMC - PubMed

Publication types