. 2020 Apr 9;202(9):e00746-19.
doi: 10.1128/JB.00746-19. Print 2020 Apr 9.

The Impact of Leadered and Leaderless Gene Structures on Translation Efficiency, Transcript Stability, and Predicted Transcription Rates in Mycobacterium smegmatis

Affiliations

The Impact of Leadered and Leaderless Gene Structures on Translation Efficiency, Transcript Stability, and Predicted Transcription Rates in Mycobacterium smegmatis

Tien G Nguyen et al. J Bacteriol. .

Abstract

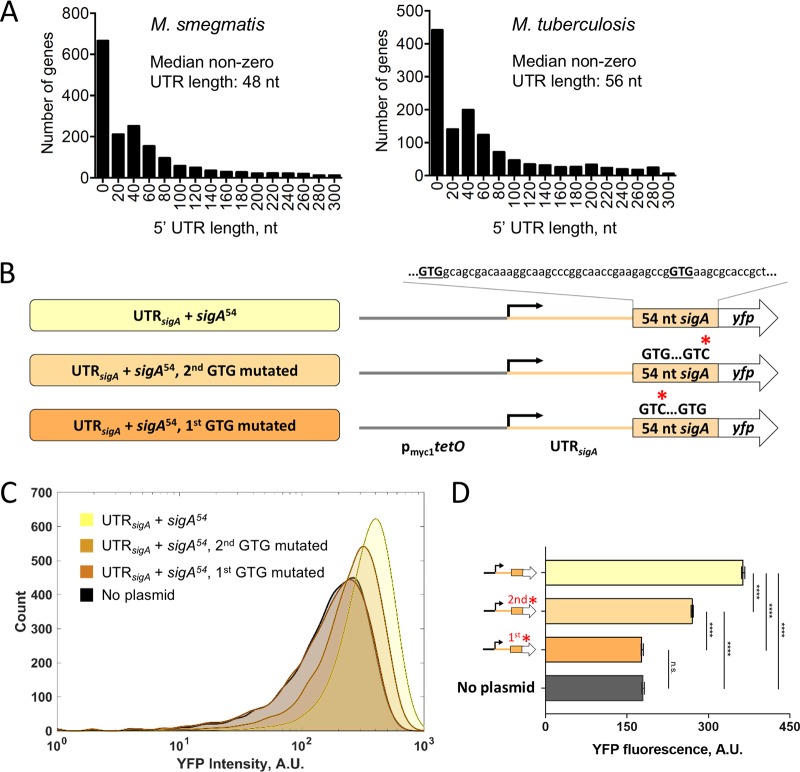
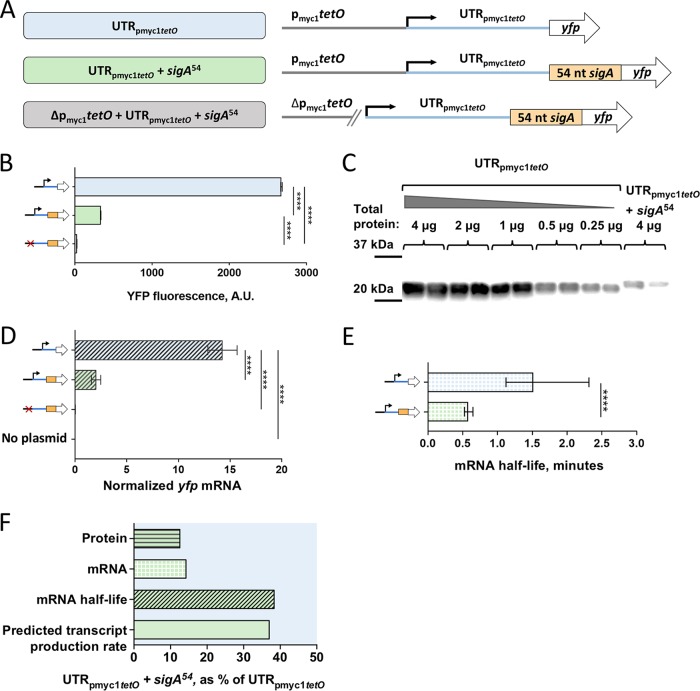
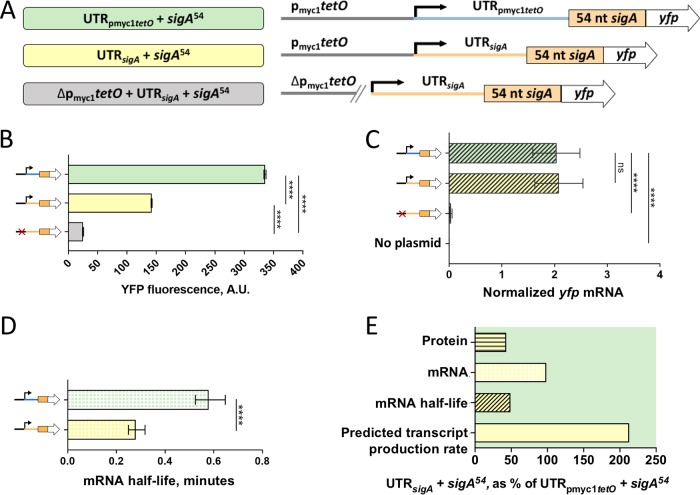
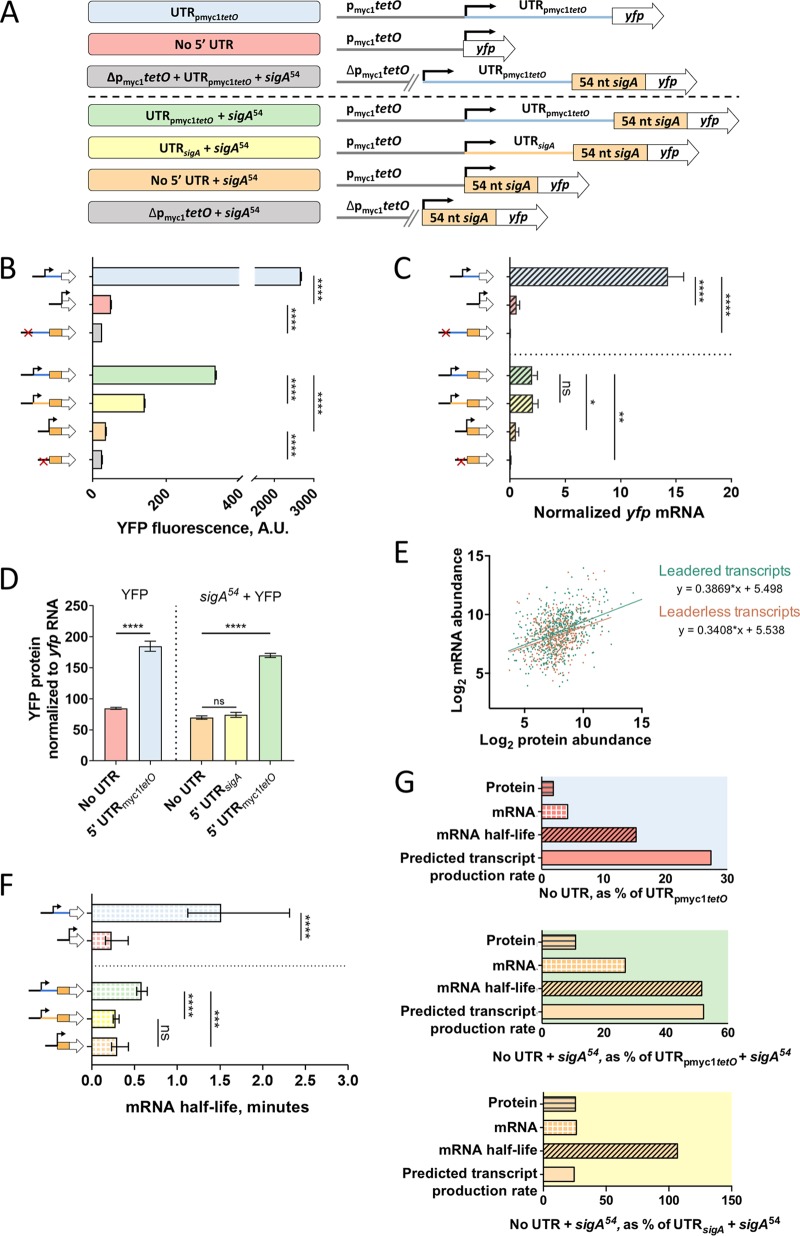
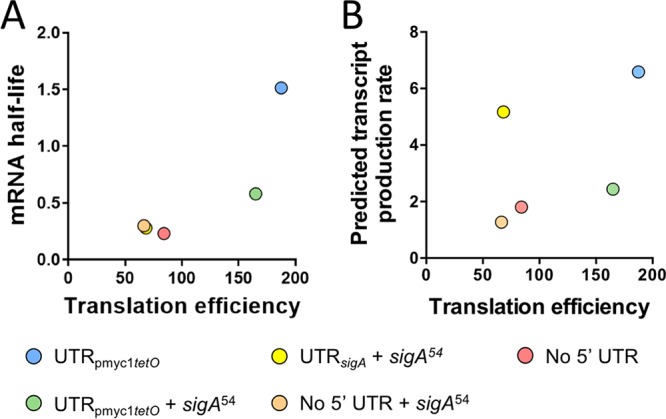
Regulation of gene expression is critical for Mycobacterium tuberculosis to tolerate stressors encountered during infection and for nonpathogenic mycobacteria such as Mycobacterium smegmatis to survive environmental stressors. Unlike better-studied models, mycobacteria express ∼14% of their genes as leaderless transcripts. However, the impacts of leaderless transcript structures on mRNA half-life and translation efficiency in mycobacteria have not been directly tested. For leadered transcripts, the contributions of 5' untranslated regions (UTRs) to mRNA half-life and translation efficiency are similarly unknown. In M. tuberculosis and M. smegmatis, the essential sigma factor, SigA, is encoded by a transcript with a relatively short half-life. We hypothesized that the long 5' UTR of sigA causes this instability. To test this, we constructed fluorescence reporters and measured protein abundance, mRNA abundance, and mRNA half-life and calculated relative transcript production rates. The sigA 5' UTR conferred an increased transcript production rate, shorter mRNA half-life, and decreased apparent translation rate compared to a synthetic 5' UTR commonly used in mycobacterial expression plasmids. Leaderless transcripts appeared to be translated with similar efficiency as those with the sigA 5' UTR but had lower predicted transcript production rates. A global comparison of M. tuberculosis mRNA and protein abundances failed to reveal systematic differences in protein/mRNA ratios for leadered and leaderless transcripts, suggesting that variability in translation efficiency is largely driven by factors other than leader status. Our data are also discussed in light of an alternative model that leads to different conclusions and suggests leaderless transcripts may indeed be translated less efficiently.IMPORTANCE Tuberculosis, caused by Mycobacterium tuberculosis, is a major public health problem killing 1.5 million people globally each year. During infection, M. tuberculosis must alter its gene expression patterns to adapt to the stress conditions it encounters. Understanding how M. tuberculosis regulates gene expression may provide clues for ways to interfere with the bacterium's survival. Gene expression encompasses transcription, mRNA degradation, and translation. Here, we used Mycobacterium smegmatis as a model organism to study how 5' untranslated regions affect these three facets of gene expression in multiple ways. We furthermore provide insight into the expression of leaderless mRNAs, which lack 5' untranslated regions and are unusually prevalent in mycobacteria.

Keywords: 5′ UTR; Mycobacterium tuberculosis; leaderless translation; mRNA stability; posttranscriptional control mechanisms; sigma factors; smegmatis; transcription.


Figures

FIG 1
FIG 1
The M. smegmatis sigA gene has a longer-than-typical 5′ UTR. (A) Distributions of 5′ UTR lengths for M. smegmatis and M. tuberculosis genes reported to be transcribed from a single TSS (41, 42). (B) Constructs to confirm the predicted sigA translation start site. pmyc1tetO was described in reference . UTRsigA denotes the 123-nt sequence between the experimentally determined TSS (41) and the annotated translation start site. (C) Flow cytometry with YFP-expressing constructs diagrammed in panel B. (D) Median fluorescence intensities determined by flow cytometry. Error bars denote 95% confidence interval (CI). Fluorescence intensities were compared by Kruskal-Wallis test followed by Dunn’s multiple-comparison test. ****, P < 0.0001; ns, P > 0.05.
FIG 2
FIG 2
The first 54 nt of the sigA coding sequence affects transcript production rate and mRNA half-life. (A) Constructs transformed into M. smegmatis to determine the impact of the first 54 nt of the sigA coding sequence (sigA54) on expression of a YFP reporter. (B) Median YFP fluorescence of strains bearing the constructs in panel A, determined by flow cytometry. Error bars denote 95% CI. Strains were compared by Kruskal-Wallis test followed by Dunn’s multiple-comparison test. (C) Lysates from strains bearing constructs with and without sigA54 were subject to Western blotting to detect the C-terminal 6×His tag on the YFP. The mass of total protein loaded per lane is stated. (D) yfp mRNA abundance for strains bearing the indicated constructs, determined by qPCR and normalized to expression of endogenous sigA. Error bars denote standard deviation. Strains were compared by analysis of variance (ANOVA) with Tukey’s honestly significant difference (HSD) test. (E) The half-lives of yfp mRNA produced from the indicated constructs were measured. Error bars denote 95% CI. Half-lives were compared using linear regression analysis (n = 3). (F) Protein abundance, mRNA abundance, mRNA half-life, and calculated transcript production rate for the construct containing sigA54 are shown as a percentage of the values produced by a construct that lacks sigA54 but is otherwise identical. ****, P < 0.0001.
FIG 3
FIG 3
The sigA 5′ UTR affects translation efficiency, mRNA half-life, and transcript production rate. (A) Constructs transformed into M. smegmatis to determine the impact of the sigA 5′ UTR on expression of a YFP reporter. (B) Median YFP fluorescence of strains bearing the constructs in panel A, determined by flow cytometry. Error bars denote 95% CI. Strains were compared by Kruskal-Wallis test followed by Dunn’s multiple-comparison test. (C) yfp mRNA abundance for strains bearing the indicated constructs, determined by qPCR and normalized to expression of endogenous sigA. Error bars denote standard deviation. Strains were compared by ANOVA with Tukey’s HSD. (D) The half-lives of yfp mRNA produced from the indicated constructs were measured. Error bars denote 95% CI. Half-lives were compared using linear regression analysis (n = 3). (E) Protein abundance, mRNA abundance, mRNA half-life, and calculated transcript production rate for the construct containing the sigA 5′ UTR are shown as a percentage of the values produced by a construct that contains the pmyc1tetO-associated 5′ UTR. Note that some data shown in Fig. 2 are reproduced here to facilitate comparisons. ****, P < 0.0001; ns, P > 0.05.
FIG 4
FIG 4
Leaderless transcripts have altered translation efficiencies, mRNA half-lives, and predicted transcript production rates compared to those of leadered controls. (A) Constructs transformed into M. smegmatis to compare leaderless versus leadered gene structures. (B) Median YFP fluorescence of strains bearing the constructs in panel A, determined by flow cytometry. Error bars denote 95% CI. Strains were compared by Kruskal-Wallis test followed by Dunn’s multiple-comparison test. (C) yfp mRNA abundance for strains bearing the indicated constructs, determined by qPCR and normalized to expression of endogenous sigA. Error bars denote standard deviation. Strains were compared by ANOVA with Tukey’s HSD. (D) Transcripts containing the pmyc1tetO-associated 5′ UTR are translated more efficiently than leaderless transcripts or those containing the sigA 5′ UTR. (E) Published M. tuberculosis mRNA abundance (42) and protein abundance (62) levels for genes that have a single TSS and are leaderless or have 5′ UTRs of ≥15 nt. Protein and mRNA abundance were significantly correlated for both gene structures (P < 0.0001, Spearman’s ρ). Linear regression analysis revealed that the slopes were statistically indistinguishable (P = 0.44). (F) The half-lives of yfp mRNA produced from the indicated constructs were measured. Error bars denote 95% CI. Half-lives were compared using linear regression analysis (n = 3). (G) Protein abundance, mRNA abundance, mRNA half-life, and calculated transcript production rate for leaderless transcripts compared to transcripts with 5′ UTRs. Note that some data shown in Fig. 2 and 3 are reproduced here to facilitate comparisons. ****, P < 0.0001; ***, P < 0.001; ns, P > 0.05.
FIG 5
FIG 5
Translation efficiency is poorly correlated with mRNA half-life and predicted transcript production rate. Translation efficiency was defined as the ratio of protein abundance to mRNA abundance (arbitrary units). (A) Variability in mRNA half-life is largely not explained by variability in translation efficiency. (B) Variability in predicted transcript production rate is uncorrelated with translation efficiency.

References

    1. Shine J, Dalgarno L. 1974. The 3′-terminal sequence of Escherichia coli 16S ribosomal RNA: complementarity to nonsense triplets and ribosome binding sites. Proc Natl Acad Sci U S A 71:1342–1346. doi:10.1073/pnas.71.4.1342. - DOI - PMC - PubMed
    1. Ringquist S, Shinedling S, Barrick D, Green L, Binkley J, Stormo GD, Gold L. 1992. Translation initiation in Escherichia coli: sequences within the ribosome-binding site. Mol Microbiol 6:1219–1229. doi:10.1111/j.1365-2958.1992.tb01561.x. - DOI - PubMed
    1. Chen H, Bjerknes M, Kumar R, Jay E. 1994. Determination of the optimal aligned spacing between the Shine-Dalgarno sequence and the translation initiation codon of Escherichia coli mRNAs. Nucleic Acids Res 22:4953–4957. doi:10.1093/nar/22.23.4953. - DOI - PMC - PubMed
    1. Sterk M, Romilly C, Wagner E. 2018. Unstructured 5′-tails act through ribosome standby to override inhibitory structure at ribosome binding sites. Nucleic Acids Res 46:4188–4199. doi:10.1093/nar/gky073. - DOI - PMC - PubMed
    1. Habib NF, Jackson MP. 1993. Roles of a ribosome-binding site and mRNA secondary structure in differential expression of Shiga toxin genes. J Bacteriol 175:597–603. doi:10.1128/jb.175.3.597-603.1993. - DOI - PMC - PubMed

Publication types

MeSH terms

LinkOut - more resources