. 2020 Mar 10;117(10):5486-5493.
doi: 10.1073/pnas.1920631117. Epub 2020 Feb 24.

HIV-1 uncoats in the nucleus near sites of integration

Affiliations

HIV-1 uncoats in the nucleus near sites of integration

Ryan C Burdick et al. Proc Natl Acad Sci U S A. .

Abstract

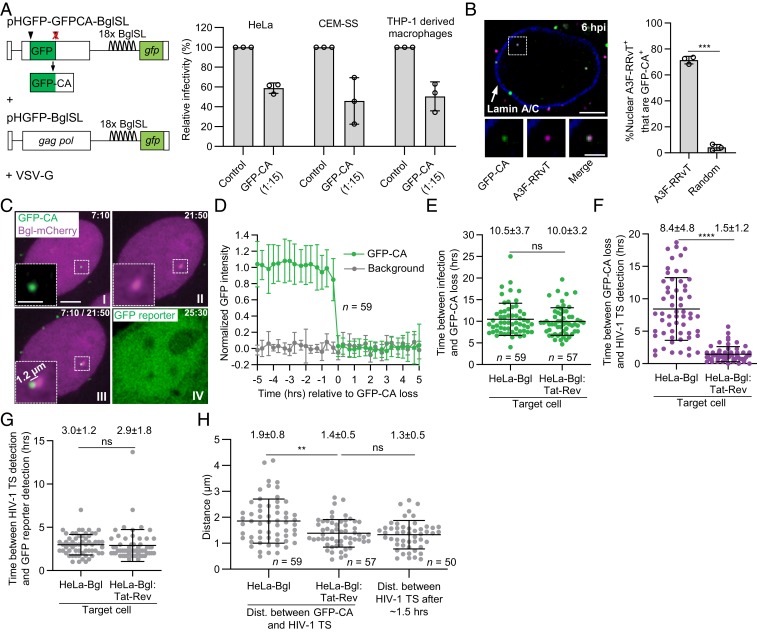
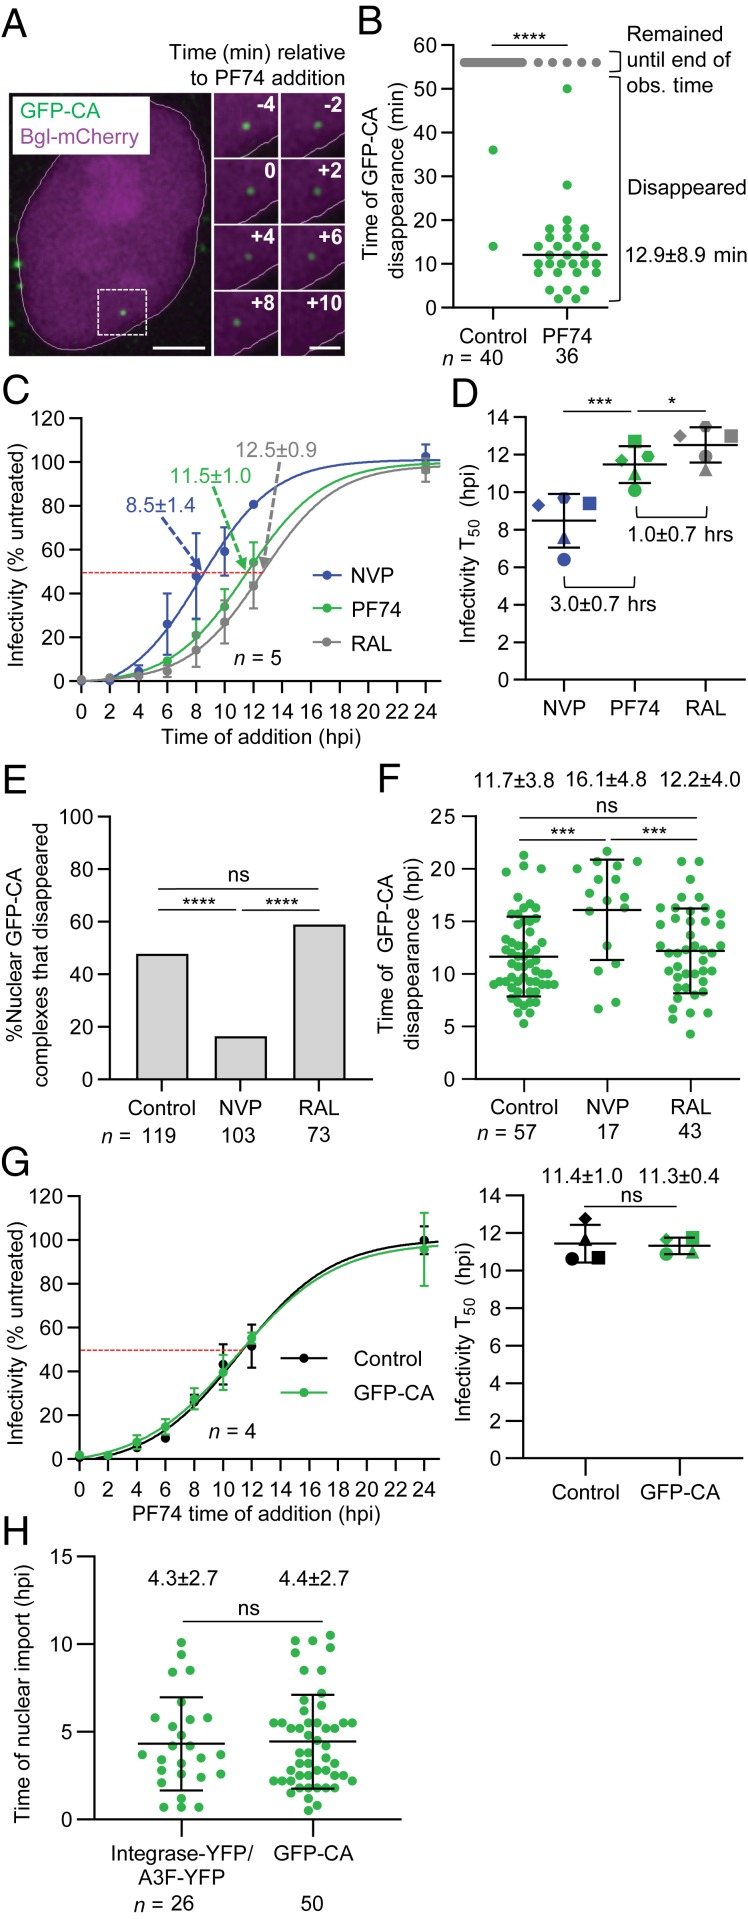
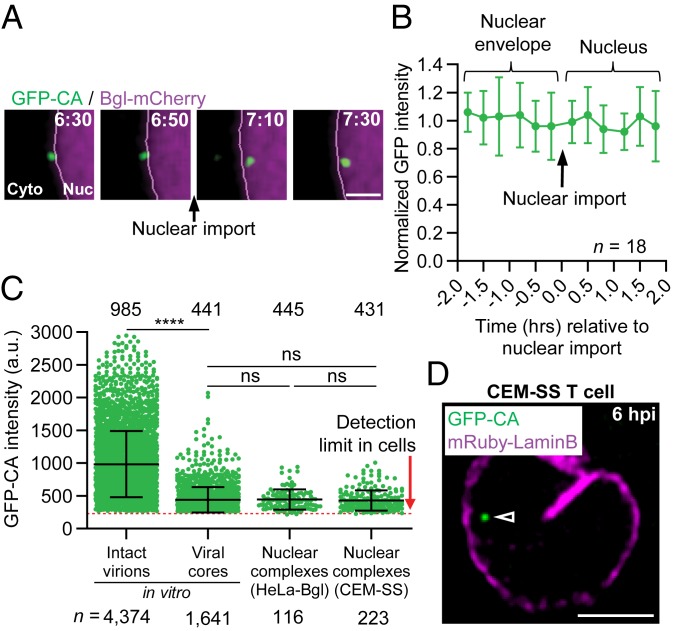
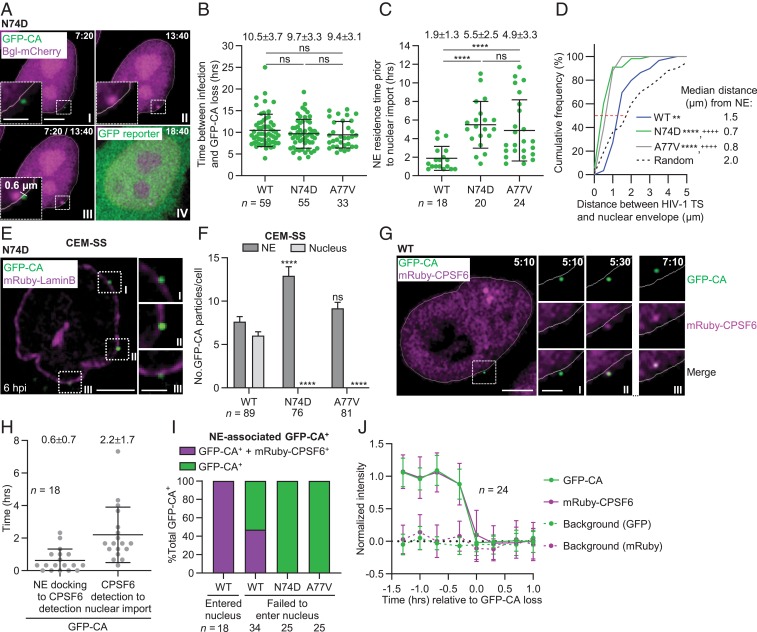
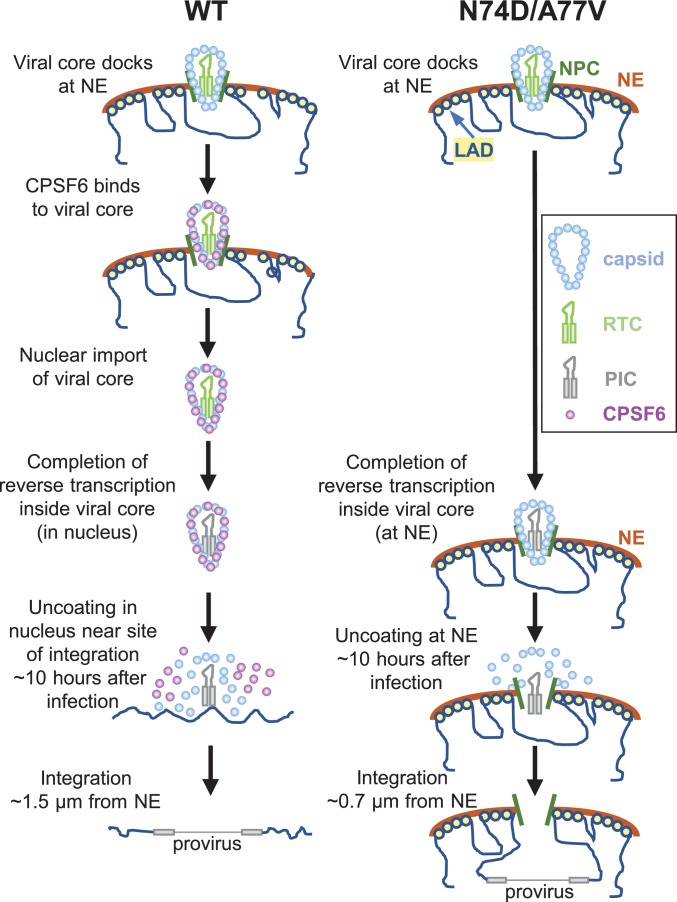
HIV-1 capsid core disassembly (uncoating) must occur before integration of viral genomic DNA into the host chromosomes, yet remarkably, the timing and cellular location of uncoating is unknown. Previous studies have proposed that intact viral cores are too large to fit through nuclear pores and uncoating occurs in the cytoplasm in coordination with reverse transcription or at the nuclear envelope during nuclear import. The capsid protein (CA) content of the infectious viral cores is not well defined because methods for directly labeling and quantifying the CA in viral cores have been unavailable. In addition, it has been difficult to identify the infectious virions because only one of ∼50 virions in infected cells leads to productive infection. Here, we developed methods to analyze HIV-1 uncoating by direct labeling of CA with GFP and to identify infectious virions by tracking viral cores in living infected cells through viral DNA integration and proviral DNA transcription. Astonishingly, our results show that intact (or nearly intact) viral cores enter the nucleus through a mechanism involving interactions with host protein cleavage and polyadenylation specificity factor 6 (CPSF6), complete reverse transcription in the nucleus before uncoating, and uncoat <1.5 h before integration near (<1.5 μm) their genomic integration sites. These results fundamentally change our current understanding of HIV-1 postentry replication events including mechanisms of nuclear import, uncoating, reverse transcription, integration, and evasion of innate immunity.

Keywords: HIV-1; capsid; integration; transcription; uncoating.


Figures

Fig. 1.
Fig. 1.
GFP-CA–labeled viral complexes uncoat in the nucleus within ∼1.5 µm of HIV-1 transcription sites. (A) HIV-1 vectors (Left) used to produce GFP-CA–labeled virions with high infectivity in HeLa, CEM-SS, and THP-1–derived macrophages (Right) compared to unlabeled control virions (set to 100%). (B) Nucleus of a HeLa cell infected with virions colabeled with GFP-CA + A3F-RRvT and immunostained with anti-Lamin A/C antibody (Left). Most nuclear A3F-RRvT viral complexes (∼70%) have detectable GFP-CA signals 6-h postinfection (hpi) compared to random locations in the nucleus (Right). (C) Representative live-cell microscopy images of a HeLa-Bgl cell infected with GFP-CA–labeled virions. A GFP-CA–labeled nuclear viral complex uncoated and lost the GFP-CA signal 7:10 hpi (I) and HIV-1 TS appeared near the site of GFP-CA disappearance 21:50 hpi (II). The HIV-1 TS appeared 1.2 µm from the GFP-CA signal (III). GFP reporter expression detected 25:30 hpi (IV). (D) Average normalized GFP-CA intensities are stable before abrupt GFP-CA loss within a single frame (<20 min). (E) Time between infection and nuclear GFP-CA loss, (F) nuclear GFP-CA loss and HIV-1 TS appearance, and (G) HIV-1 TS appearance and gfp reporter detection for 59 and 57 infectious GFP-CA–labeled viral complexes in HeLa-Bgl cells and HeLa-Bgl:Tat-Rev cells, respectively. (H) Distance between GFP-CA signal (time point prior to GFP-CA loss) and HIV-1 TS (first time point of detection) in HeLa-Bgl cells (∼8.4 h) and HeLa-Bgl:Tat-Rev cells (∼1.5 h) compared to HIV-1 TS movements in ∼1.5 h. (Scale bars, 5 µm; Inset, 2 µm.) For A and B, data are mean ± SD from three independent experiments; P values are from paired t tests. For (EH), lines are mean ± SD; P values are from Welch’s t tests. ****P < 0.0001; ***P < 0.001; **P < 0.01; *P < 0.05; ns, not significant (P > 0.05).
Fig. 2.
Fig. 2.
Determination of the sensitivity of nuclear GFP-CA–labeled viral complexes to capsid, reverse transcriptase and integrase inhibitors. (A) Representative live-cell microscopy images of a nuclear GFP-CA–labeled viral complex before and after addition of PF74 (10 µM). Numbers in white indicate time (min) relative to the time of PF74 addition. (Scale bar, 5 µm; Inset, 2 µm.) (B) Time of disappearance of GFP-CA–labeled viral complexes in untreated control cells and PF74-treated cells during ∼1-h observation time. (C) Time-of-addition assays with NVP, PF74, or RAL. The numbers indicate the time at which 50% of the viral complexes became resistant to the inhibitors (infectivity T50). (D) Comparison of average infectivity T50 for NVP, PF74, and RAL from five independent experiments. (E) Proportion of nuclear GFP-CA–labeled complexes that disappeared during the observation time (21.6 hpi). (F) Average time of GFP-CA disappearance. Lines are mean ± SD; P values are from Welch’s t tests. (G) PF74 time-of-addition assays with GFP-CA–labeled and unlabeled virions. Comparison of average time at which 50% of the viral complexes became resistant to PF74 (infectivity T50) from four independent experiments (Right). (H) Comparison of the time of nuclear import previously determined for integrase-YFP- or A3F-YFP-labeled viral complexes (14) and GFP-CA–labeled viral complexes. For B and E, P values are from Fisher’s exact tests comparing the proportion nuclear GFP-CA complexes that disappeared. For D and G, lines are mean ± SD; P values are from paired t tests. ****P < 0.0001; ***P < 0.001; *P < 0.05; ns, not significant (P > 0.05).
Fig. 3.
Fig. 3.
Nuclear viral complexes retain most of the GFP-CA associated with in vitro viral cores. (A) Live-cell microscopy images of a GFP-CA–labeled viral complex docked at the NE and in the nucleus after import. Numbers in white indicate time postinfection. (Scale bar, 2 µm.) (B) Normalized mean GFP-CA intensities of six frames before and after nuclear import indicate no significant loss of GFP-CA. (C) Comparison of the mean GFP-CA intensities (arbitrary units; a.u.) of intact virions, in vitro viral cores, and nuclear viral complexes in infected HeLa and CEM-SS T cells. Intact virions and in vitro viral cores with GFP-CA intensities below the detection limit (<265 a.u.) in HeLa and CEM-SS cell nuclei were removed. Lines are mean ± SD; P values are from Welch’s t tests. ****P < 0.0001; ns, not significant (P > 0.05). (D) Representative image of a GFP-CA–labeled nuclear complex in an infected CEM-SS T cell expressing mRuby-LaminB 6 hpi. (Scale bar, 5 µm.)
Fig. 4.
Fig. 4.
CA-CPSF6 interaction at the NE facilitates nuclear import of viral complexes, the location of their uncoating, and the location of HIV-1 TS. (A) Representative live-cell microscopy images of a HeLa-Bgl cell infected with GFP-CA–labeled virions of CA mutant N74D. A GFP-CA–labeled viral complex uncoated at the edge of the nuclear Bgl-mCherry signal, 7:20 hpi (I) and HIV-1 TS appeared near the site of GFP-CA disappearance 13:40 hpi (II). The HIV-1 TS appeared 0.6 µm from the GFP-CA signal (III). GFP reporter expression detected 18:40 hpi (IV). (B) Time between infection and GFP-CA loss; data for WT the same as in Fig. 1E. Lines are mean ± SD; P values are from Welch’s t tests. (C) NE residence time of GFP-CA–labeled viral complexes prior to nuclear import. For N74D/A77V mutants, the time of nuclear import was assumed to occur at the time of GFP-CA loss (i.e., uncoating). (D) Cumulative frequency distribution of distances (µm) between HIV-1 TS and NE and random sites in the nuclei to NE; median distances are indicated by the red dotted line. P values are from Kolmogorov–Smirnov tests. **P < 0.01 compared to random; ****P < 0.0001 compared to random; ++++P < 0.0001 compared to WT. (E) N74D GFP-CA–labeled viral complexes localize to the NE but not in the nuclei of CEM-SS cells. (F) Quantitation of GFP-CA–labeled viral complexes at the NE and in the nucleus. Data are pooled from three independent infections (n = number of cells analyzed); P values are from paired t tests. ****P < 0.0001; ns, not significant (P > 0.05). (G) Representative live-cell microscopy images of infected HeLa:mRuby-CPSF6 cells show mRuby-CPSF6 recruitment to a GFP-CA–labeled viral complex located at or near the NE (I and II); dual-labeled GFP-CA and mRuby-CPSF6 complexes are imported into the nucleus (III). (H) Time between NE docking to CPSF6 detection and CPSF6 detection to nuclear import for 18 GFP-CA–labeled viral complexes. Lines are mean ± SD (I) Proportion of NE-associated GFP-CA+ viral complexes that are CPSF6+. The viral complexes that entered the nucleus during the observation time and those that were docked at the NE but failed to enter the nucleus were analyzed. (J) Simultaneous disappearance of intranuclear GFP-CA and mRuby-CPSF6 signals. (Scale bars, 5 µm; Inset, 2 µm.)
Fig. 5.
Fig. 5.
Model for nuclear import and uncoating of HIV-1. WT and N74D/A77V viral cores dock at the NE. CPSF6 is recruited to the WT viral cores at the NE but not to the N74D/A77V viral cores. WT viral cores are imported into the nucleus ∼1.9 h after docking at the NE; the N74D/A77V GFP-CA–labeled viral cores remain associated with the NE and are not imported into the nucleus. Reverse transcription is completed inside the intact (or nearly intact) viral core for WT (in the nucleus) and N74D/A77V mutants (at NE). The nuclear WT viral complexes and NE-associated N74D/A77V viral complexes uncoat ∼10 h after infection. WT PIC integrates into chromatin near the sites of uncoating ∼1.5 µm from the NE; the N74D/A77V PIC integrates into chromatin associated with lamina-associated domains (LADs) ∼0.7 to 0.8 µm from the NE. In addition to the localization of transcriptionally active WT and N74D/A77V proviruses to the nuclear periphery in these studies, localization of WT viral DNA (50, 51) and N74D/A77V DNA (23, 25) to the nuclear periphery was previously reported.

References

    1. Gres A. T., et al. , STRUCTURAL VIROLOGY. X-ray crystal structures of native HIV-1 capsid protein reveal conformational variability. Science 349, 99–103 (2015). - PMC - PubMed
    1. Mattei S., Glass B., Hagen W. J., Kräusslich H. G., Briggs J. A., The structure and flexibility of conical HIV-1 capsids determined within intact virions. Science 354, 1434–1437 (2016). - PubMed
    1. Zhao G., et al. , Mature HIV-1 capsid structure by cryo-electron microscopy and all-atom molecular dynamics. Nature 497, 643–646 (2013). - PMC - PubMed
    1. Aboud M., Shoor R., Salzberg S., Adsorption, penetration, and uncoating of murine leukemia virus studied by using its reverse transcriptase. J. Virol. 30, 32–37 (1979). - PMC - PubMed
    1. Briggs J. A., Wilk T., Welker R., Kräusslich H. G., Fuller S. D., Structural organization of authentic, mature HIV-1 virions and cores. EMBO J. 22, 1707–1715 (2003). - PMC - PubMed

Publication types

Substances