. 2020 Feb 24;10(1):74.
doi: 10.1038/s41398-020-0758-1.

Contribution of common and rare variants to bipolar disorder susceptibility in extended pedigrees from population isolates

Affiliations

Contribution of common and rare variants to bipolar disorder susceptibility in extended pedigrees from population isolates

Jae Hoon Sul et al. Transl Psychiatry. .

Abstract

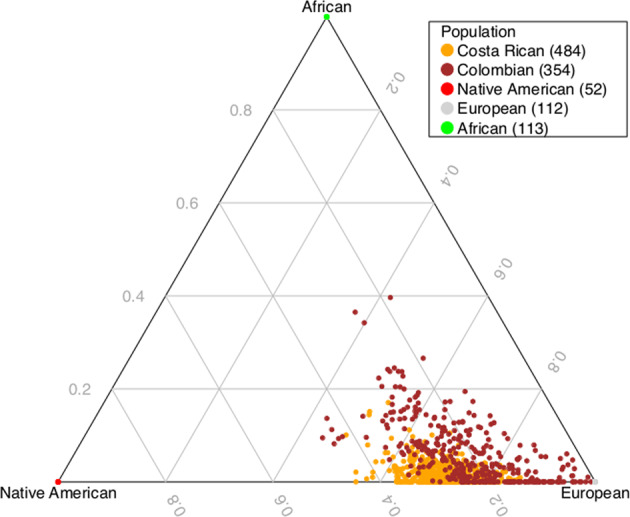
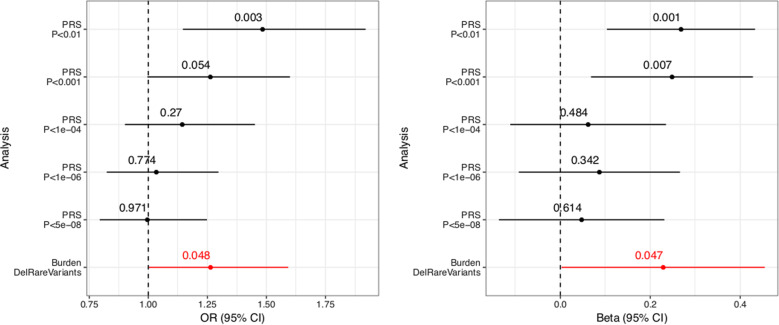
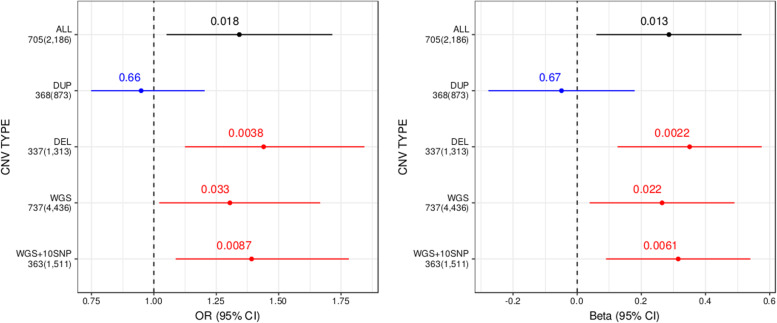
Current evidence from case/control studies indicates that genetic risk for psychiatric disorders derives primarily from numerous common variants, each with a small phenotypic impact. The literature describing apparent segregation of bipolar disorder (BP) in numerous multigenerational pedigrees suggests that, in such families, large-effect inherited variants might play a greater role. To identify roles of rare and common variants on BP, we conducted genetic analyses in 26 Colombia and Costa Rica pedigrees ascertained for bipolar disorder 1 (BP1), the most severe and heritable form of BP. In these pedigrees, we performed microarray SNP genotyping of 838 individuals and high-coverage whole-genome sequencing of 449 individuals. We compared polygenic risk scores (PRS), estimated using the latest BP1 genome-wide association study (GWAS) summary statistics, between BP1 individuals and related controls. We also evaluated whether BP1 individuals had a higher burden of rare deleterious single-nucleotide variants (SNVs) and rare copy number variants (CNVs) in a set of genes related to BP1. We found that compared with unaffected relatives, BP1 individuals had higher PRS estimated from BP1 GWAS statistics (P = 0.001 ~ 0.007) and displayed modest increase in burdens of rare deleterious SNVs (P = 0.047) and rare CNVs (P = 0.002 ~ 0.033) in genes related to BP1. We did not observe rare variants segregating in the pedigrees. These results suggest that small-to-moderate effect rare and common variants are more likely to contribute to BP1 risk in these extended pedigrees than a few large-effect rare variants.


Conflict of interest statement

The authors declare that they have no conflict of interest.

Figures

Fig. 1
Fig. 1. A de Finetti diagram showing global estimates of admixture proportions among African, European, and Native American ancestries in the CO/CR pedigrees.
The global estimates were calculated using microarray data with ADMIXTURE software.
Fig. 2
Fig. 2. Forest plot displaying the mean and confidence interval of regression coefficients of PRS analysis and rare variant burden analysis for SNVs.
We compared the quantile-normal transformed PRS estimated from PGC BP1 GWAS summary statistics between BP1 individuals and controls and also compared the burden of rare deleterious SNVs between BP1 individuals and controls in the 8,237 genes relevant to BP. PRS is computed at different GWAS p value thresholds of the PGC BP1 GWAS. The burden score was regressed on the burden of all rare variants in the 8,237 genes, and the residuals were quantile-normal transformed. The black lines indicate results of the PRS analysis while the red line indicates results of the rare variant burden analysis. The association between PRS and BP1 status and between the rare variant burden and BP1 status was assessed using a generalized linear mixed model (left) and a linear mixed model (right) that took into account relatedness.
Fig. 3
Fig. 3. Forest plot displaying the mean and confidence interval of regression coefficients of rare variant burden analysis for CNVs.
We compared the burden of genes affected by rare CNVs in the BP1-related gene set between BP1 individuals and controls, stratified by a detection method (microarray or WGS) and a CNV type. The total number of CNVs detected and the number of CNVs affecting BP1-related genes are displayed for each category. The black line indicates results of all microarray CNVs, the blue line indicates results of duplications from microarray, red lines indicate results of deletions from microarray (DEL) and WGS (WGS and WGS + 10SNP) data. WGS + 10SNP is results of WGS deletions covered by at least 10 SNPS on the microarray. To correct for individual relatedness and other potential confounders (see Methods), enrichment was assessed using a generalized linear mixed model (left) and a linear mixed model (right).

References

    1. Merikangas KR, Low NC. The epidemiology of mood disorders. Curr. Psychiatry Rep. 2004;6:411–421. - PubMed
    1. Stahl E. A., et al. Genome-wide association study identifies 30 loci associated with bipolar disorder. Nat. Genet.51, 793–803 (2019). - PMC - PubMed
    1. Manolio TA, et al. Finding the missing heritability of complex diseases. Nature. 2009;461:747–753. - PMC - PubMed
    1. Georgi B, et al. Genomic view of bipolar disorder revealed by whole genome sequencing in a genetic isolate. PLoS Genet. 2014;10:e1004229. - PMC - PubMed
    1. Cruceanu C, et al. Family-based exome-sequencing approach identifies rare susceptibility variants for lithium-responsive bipolar disorder. Genome. 2013;56:634–640. - PubMed

Publication types