. 2020 Feb 24;10(1):3226.
doi: 10.1038/s41598-020-59084-2.

High HIV-1 diversity in immigrants resident in Italy (2008-2017)

Collaborators, Affiliations

High HIV-1 diversity in immigrants resident in Italy (2008-2017)

Maria Teresa Maggiorella et al. Sci Rep. .

Abstract

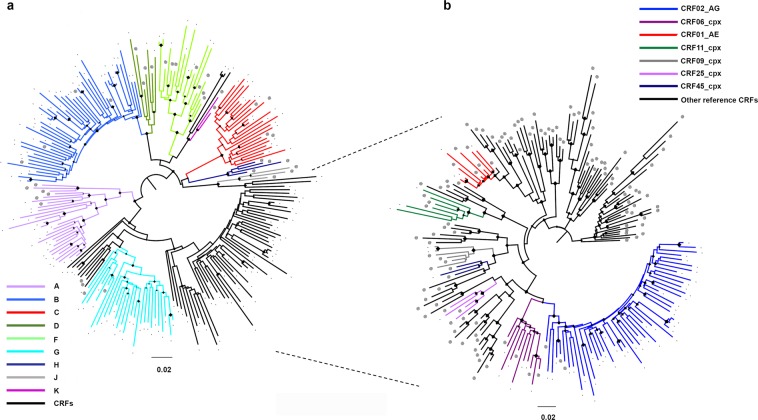
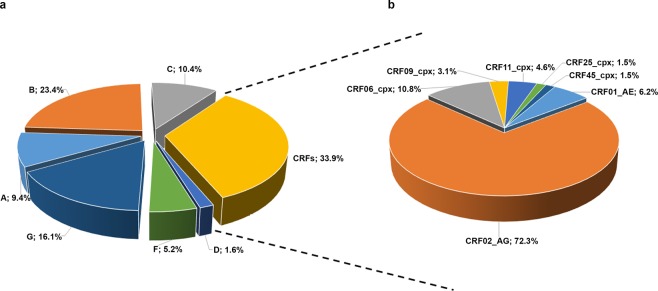
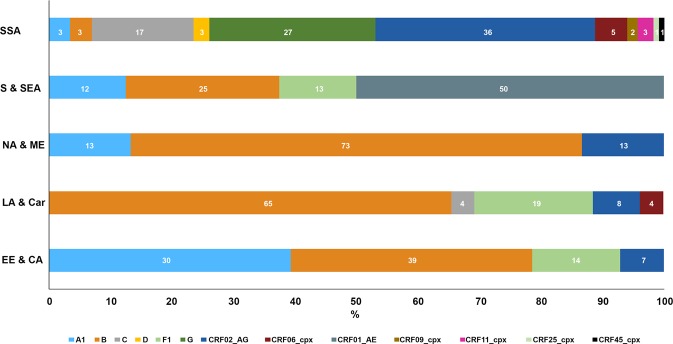
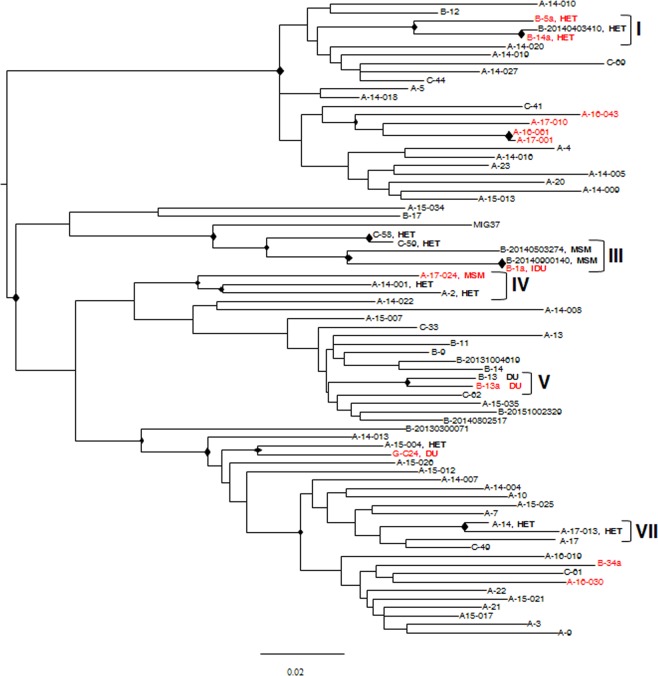
The proportion of new diagnoses of HIV infection in immigrants residing in Italy raised from 11% in 1992 to 29.7% in 2018. To investigate the HIV clades circulating in this community a retrospective study was performed in 557 HIV-infected immigrants living in 12 Italian cities. Immigrants originated from East-Europe and Central-Asia (11.7%), North Africa and Middle East (7.3%), South and South-East Asia (7.2%), Latin America and the Caribbean (14.4%), and sub-Saharan Africa (59.4%). More than 87% of immigrants were on antiretroviral therapy (ART), although 26.6% of them were viremic. A 22.0% of immigrants had hepatitis (HBV and/or HCV) and/or tuberculosis. HIV phylogenetic analysis on sequences from 192 immigrants showed the presence of clades B (23.4%), G (16.1%), C (10.4%), A1 (9.4%), F1 (5.2%), D (1.6%) and Circulating Recombinant Forms (CRFs) (33.9%). CRF02_AG represented 72.3% of the total CRFs. Clusters between immigrants and Italian natives were also present. Drug resistance mutations to NRTI, NNRTI, and PI drug classes occurred in 29.1% of ART-treated and in 12.9% of ART-naïve individuals. These data highlight the need for tailored public health interventions in immigrants to avoid spreading in Italy of HIV genetic forms and ART-resistant variants, as well as HIV co-morbidities.


Conflict of interest statement

The authors declare that the research was conducted in the absence of any commercial or financial relationships that could be construed as a potential conflict of interest.

Figures

Figure 1
Figure 1
ML phylogenetic tree inferred for HIV-1 genetic forms from 192 HIV-1-infected immigrants. Panel a: ML tree including all the 192 HIV-1 sequences plus pure HIV subtype reference sequences. Panel b: zoom of the ML tree including CRF sequences from our study and CRF reference sequences. “Other CRF reference sequences” are those reference sequences that do not cluster with our sequences. The different subtypes and CRFs are shown in colour, according to the legends present on the top left for panel a, and top right for panel b, respectively. Sequences from our study are indicated with “-“. Reference sequences are indicated with “@”.The diamond (♦) located in the nodes represents significant statistical support for the clade subtending that branch (bootstrap support > 70%). The scale bar indicates 0.02 nucleotide sequence difference. Frequency of each pure subtype and CRF is shown at the bottom of panel a and b, respectively.
Figure 2
Figure 2
Prevalence of HIV-1 subtypes and recombinant forms in 192 immigrants resident in Italy. The prevalence of the genetic forms is expressed as the percentage of the total number.
Figure 3
Figure 3
Distribution of HIV-1 subtypes and recombinant forms by geographical area of origin of 192 immigrants resident in Italy. Each subtype and CRF is identified by a colour according to the legend reported at the bottom of the figure. The prevalence of each genetic form is reported as the percentage of the total number for each region.
Figure 4
Figure 4
Clustering analysis of HIV-1 sequences from 108 Italians and 25 immigrants infected by HIV-1 subtype B, according to HIV risk behaviour and demographical data. ML trees are shown. The diamond (♦) located in the nodes represents significant statistical support for the clade subtending that branch (bootstrap support > 70%). Roman numbers indicate clusters. Names include the city one-letter code, and an internal patient code. The risk factor (DU: Drug User; HET: Heterosexual) is reported only for patients included in a cluster. Italian natives are indicated in red, immigrants in black. The scale bar indicates 0.02 nucleotide sequence difference.
Figure 5
Figure 5
Clustering analysis of HIV-1 sequences from 12 Italians and 63 immigrants infected by HIV-1 non-B subtypes, according to HIV risk behaviour and demographical data. ML trees are shown. The diamond (♦) located in the nodes represents significant statistical support for the clade subtending that branch (bootstrap support > 70%). Roman numbers indicate clusters. Names in the cluster include the city one-letter code and an internal patient code. The risk factor (DU: Drug User; HET: Heterosexual; MSM: Male-to-Male Sex) is reported only for patients included in a cluster. Italian natives are indicated in red, immigrants in black. The scale bar indicates 0.02 nucleotide sequence difference.
Figure 6
Figure 6
Clustering analysis of HIV-1 sequences from 16 Italians and 31 immigrants infected by HIV-1 CRFs, according to HIV risk behaviour and demographical data. ML trees are shown. The diamond (♦) located in the nodes represents significant statistical support for the clade subtending that branch (bootstrap support > 70%). Roman numbers indicate clusters. Names in the cluster include the city one-letter code and an internal patient code. The risk factor (HET: Heterosexual) is reported only for patients included in a cluster. Italian natives are indicated in red, immigrants in black. The scale bar indicates 0.02 nucleotide sequence difference.
Figure 7
Figure 7
Relative frequency of patients with DRMs according to the genotype. The relative frequency of patients with DRMs is indicated for subtypes A1, B, C, G and for all CRFs. The number of sequences included in the analysis is indicated in brackets at the top of each clade. Blue bar: total frequency of DRMs; red bar: frequency of DRMs to NRTIs; yellow bar: frequency of DRMs to NNRTIs; green bar: frequency of DRMs to PIs; grey bar: frequency of each single mutation.

References

    1. ECDC (European Centre for Disease Prevention and Control). Thematic report: Migrants. Monitoring implementation of the Dublin Declaration on Partnership to Fight HIV/AIDS in Europe and Central Asia: 2014 progress report. Stockholm: ECDC, 10.2900/628779 (2015).
    1. ECDC (European Centre for Disease Prevention and Control). HIV and migrants. Monitoring implementation of the Dublin Declaration on Partnership to Fight HIV/AIDS in Europe and Central Asia: 2017 progress report Stockholm: ECDC., 10.2900/063985 (2017).
    1. News Bulletin of Istituto Superiore di Sanità (ISS), Oct, Suppl.1,Vol. 32, N°10, http://old.iss.it/binary/publ/cont/AGGIORNAMENTO_HIV_2018.pdf (2019).
    1. Lai A, et al. What is changed in HBV molecular epidemiology in Italy? J. Med. Virol. 2018;90:786–795. doi: 10.1002/jmv.25027. - DOI - PubMed
    1. Coppola N, et al. Hepatitis B virus, hepatitis C virus and human immunodeficiency virus infection in undocumented migrants and refugees in Southern Italy, January 2012 to June 2013. Euro Surveill. 2015;20:pii=30009. doi: 10.2807/1560-7917.ES.2015.20.35.30009. - DOI - PubMed

Publication types