. 2020 Feb 24;10(1):3259.
doi: 10.1038/s41598-020-59982-5.

Oligomers of the lipodystrophy protein seipin may co-ordinate GPAT3 and AGPAT2 enzymes to facilitate adipocyte differentiation

Affiliations

Oligomers of the lipodystrophy protein seipin may co-ordinate GPAT3 and AGPAT2 enzymes to facilitate adipocyte differentiation

M F Michelle Sim et al. Sci Rep. .

Abstract

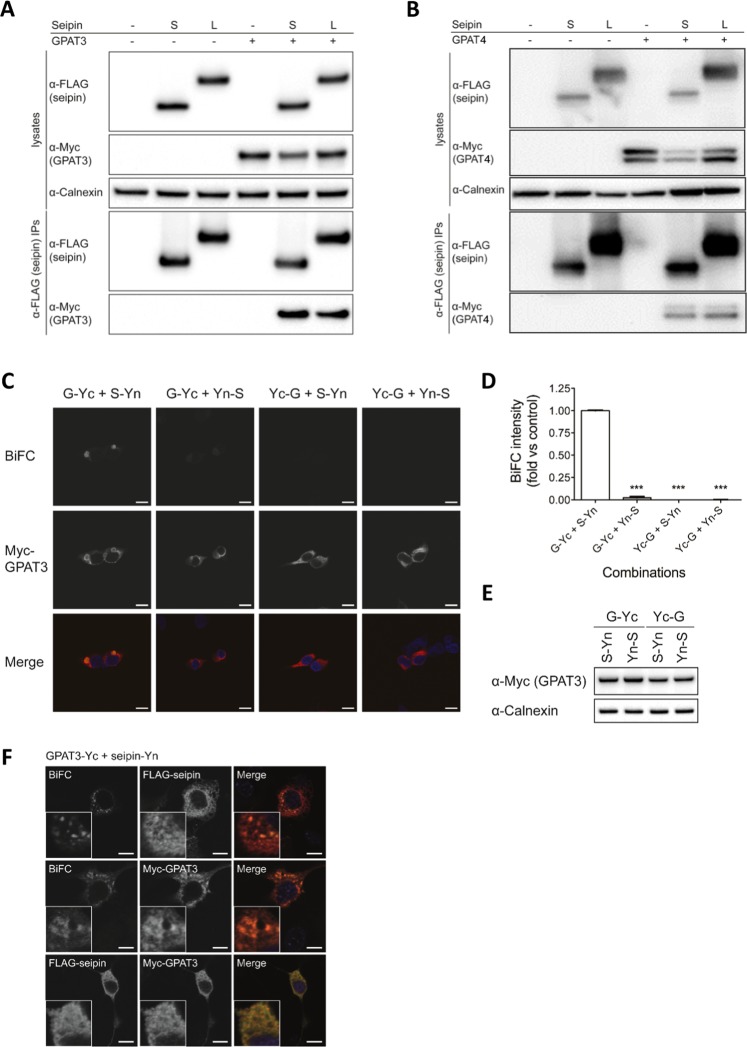
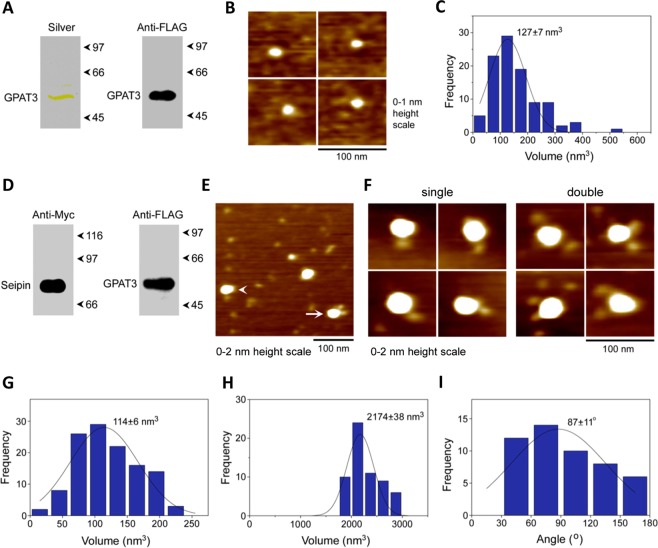
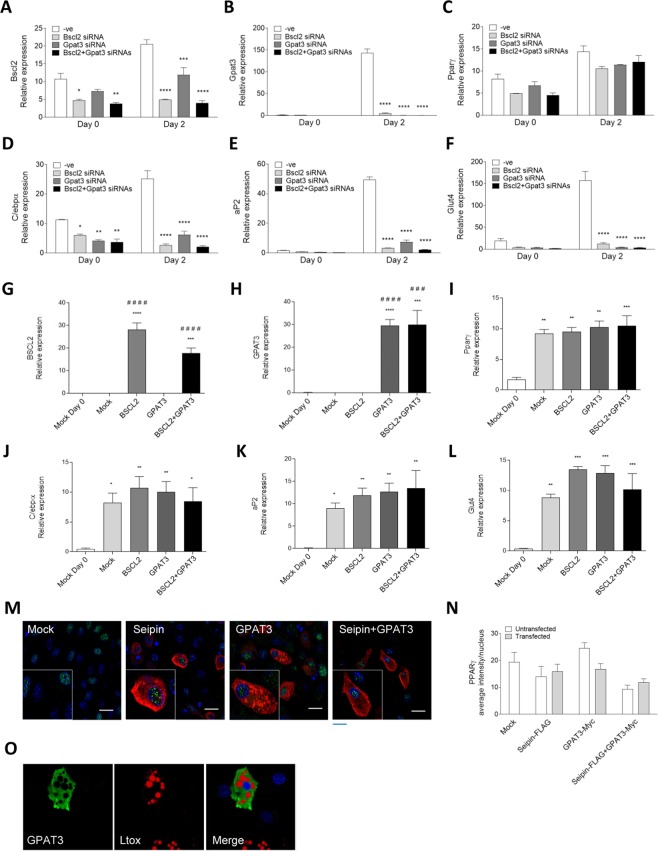
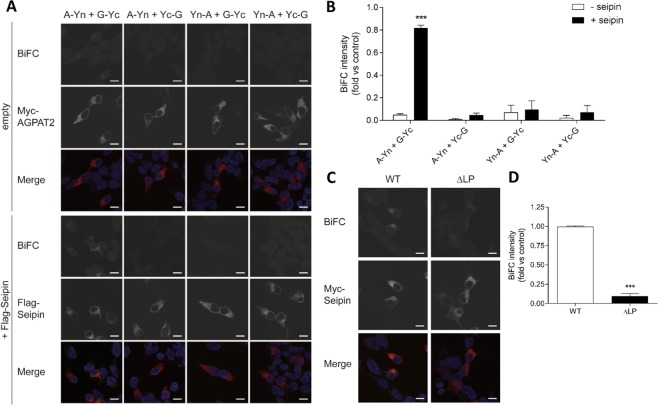
Seipin deficiency causes severe congenital generalized lipodystrophy (CGL) and metabolic disease. However, how seipin regulates adipocyte development and function remains incompletely understood. We previously showed that seipin acts as a scaffold protein for AGPAT2, whose disruption also causes CGL. More recently, seipin has been reported to promote adipogenesis by directly inhibiting GPAT3, leading to the suggestion that GPAT inhibitors could offer novel treatments for CGL. Here we investigated the interactions between seipin, GPAT3 and AGPAT2. We reveal that seipin and GPAT3 associate via direct interaction and that seipin can simultaneously bind GPAT3 and AGPAT2. Inhibiting the expression of seipin, AGPAT2 or GPAT3 led to impaired induction of early markers of adipocyte differentiation in cultured cells. However, consistent with normal adipose mass in GPAT3-null mice, GPAT3 inhibition did not prevent the formation of mature adipocytes. Nonetheless, loss of GPAT3 in seipin-deficient preadipocytes exacerbated the failure of adipogenesis in these cells. Thus, our data indicate that GPAT3 plays a modest positive role in adipogenesis and argue against the potential of GPAT inhibitors to rescue white adipose tissue mass in CGL2. Overall, our study reveals novel mechanistic insights regarding the molecular pathogenesis of severe lipodystrophy caused by mutations in either seipin or AGPAT2.


Conflict of interest statement

The authors declare no competing interests.

Figures

Figure 1
Figure 1
Seipin can associate with GPAT3 and GPAT4. HEK293 cells were transfected with GPAT3-Myc (A) or GPAT4-Myc (B) in the absence or presence of either the short (S) or long (L) forms of FLAG-tagged seipin. Lysates and anti-FLAG immunoprecipitates were analysed by SDS-PAGE and immunoblotting with antibodies to FLAG or Myc to detect tagged proteins or calnexin as a loading control. (C) HEK293 cells were transfected with constructs in which the N-terminal fragment of YFP was fused to the C or N terminus of seipin (S-Yn or Yn-S, respectively), and constructs in which the C-terminal fragment of YFP was fused to either the C or N terminus of GPAT3-Myc (G-Yc and Yc-G, respectively). A temperature shift was used to induce the formation of reconstituted YFP then cells were fixed and stained for GPAT3-Myc (red) and DAPI to label nuclei. The presence of a YFP signal (yellow) indicates an interaction between GPAT3 and seipin. Scale bars, 10 μm. (D) Quantified BiFC signal intensity. Errors are SEM (n = 3). ***Indicates a difference in YFP fluorescence compared with G-Yc/S-Yn (p < 0.001). (E) Anti-Myc immunoblot showing GPAT3-Yc and Yc-GPAT3 expression and calnexin as a loading control. (F) 3T3-L1 preadipocytes were co-transfected with FLAG-seipin-Yn and Myc-GPAT3-Yc immediately after the induction of differentiation. Three days later cells were fixed and anti-FLAG or anti-Myc antibodies were used to detect FLAG-seipin-Yn or Myc-GPAT3-Yc, respectively. Identically transfected cells were co-immunostained for FLAG-seipin-Yn and Myc-GPAT3-Yc (lower panels). However these latter cells were not temperature shifted so as to prevent the formation of YFP which would otherwise confound the use of Alexa Fluor488 labelled secondary antibodies in order to detect the FLAG epitope. Scale bars, 10 μm.
Figure 2
Figure 2
The conserved transmembrane and ER luminal loop regions of seipin are required for its interaction with GPAT3. (A) HEK293 cells were transfected with empty vector (−), wild-type Myc-seipin (WT) or mutant seipin lacking the N-terminus (ΔNT), the first transmembrane domain (ΔTM1), the ER luminal loop region (Δloop), the second transmembrane domain (ΔTM2) or the C-terminus (ΔCT) in the absence or presence of FLAG-tagged GPAT3 as indicated. Cell lysates or anti-FLAG immunoprecipitates were separated by SDS-PAGE and immunoblotted with antibodies to FLAG, Myc and calnexin. (B) Quantification analysis of the binding of WT or mutant forms of seipin to FLAG-GPAT3. Data represent means ± SEM (n = 3), normalized to expression levels and expressed as a fold of that observed with wild-type seipin. * indicates p < 0.05, ** indicates p < 0.01 and *** indicates p < 0.001 versus co-immunoprecipitation with wild-type seipin. (C) HEK293 cells were transfected with empty vector (−), N-terminal FLAG-tagged wild-type seipin (WT) or identically-tagged T78A, L91P and A212P forms of seipin in the presence or absence of Myc-tagged GPAT3. Cell lysates or anti-FLAG immunoprecipitates were separated by SDS-PAGE and immunoblotted with antibodies to FLAG, Myc and calnexin. (D) Quantification analysis of the binding of WT or mutant forms of seipin to Myc-GPAT3. Data represent the means ± SEM (n = 3), normalized to expression levels and expressed as a fold of that observed with wild-type seipin. * indicates p < 0.05, ** indicates p < 0.01 versus co-immunoprecipitation with wild-type seipin.
Figure 3
Figure 3
Seipin interacts with GPAT3 via direct physical contacts. (A) FLAG-GPAT3 was expressed in tsA 201 cells and isolated using anti-FLAG beads. Following SDS-PAGE, isolated protein was analysed by either silver staining (left panel) or immunoblotting using an anti-FLAG antibody (right panel). (B) Zoomed images from AFM analysis of immunoisolated GPAT3 showing individual GPAT3 particles. (C) Frequency distribution of volumes of the GPAT3 particles. The curve indicates the fitted Gaussian function. The peak of the distribution (±SEM) is indicated. (D) tsA 201 cells were co-transfected with FLAG-GPAT3 and Seipin-Myc and proteins were isolated using anti-Myc beads. Proteins were separated by SDS-PAGE followed by immunoblotting using either anti-Myc (left panel) or anti-FLAG (right panel) antibodies. (E) Low-magnification image from AFM analysis of isolated proteins. The arrowhead indicates a large particle (seipin) decorated by one smaller (GPAT3) particle; the arrow indicates a seipin particle decorated by two GPAT3 particles. (F) Gallery of zoomed images showing seipin particles decorated by either one (left panels) or two (right panels) GPAT3 particles. (G) Frequency distribution of volumes of the smaller (GPAT3) particles with the curve indicating the fitted Gaussian function. The peak of the distribution (±SEM) is indicated. (H) Frequency distribution of volumes of the larger (seipin) particles. (I) Frequency distribution of angles between pairs of bound GPAT3 particles.
Figure 4
Figure 4
Inhibition of Gpat3 expression fails to rescue adipogenesis in seipin-deficient cells, while GPAT3 overexpression does not impair this process. C3H10T1/2 cells were transfected with control siRNA (−ve) or siRNA targeting seipin (Bscl2), Gpat3 or both seipin (Bscl2) and Gpat3 as indicated at day -2 and day 0 of differentiation. RNA was extracted at day 0 or day 2 of differentiation and expression of Bscl2/seipin (A) Gpat3 (B) Pparγ (C) C/ebpα (D) aP2 (E) and Glut4 (F) was determined by qPCR. Data are presented as relative mRNA expression (means ± SEM, n = 4), normalized to the stable housekeeping gene Ywhaz. Statistically significant differences compared to control siRNA at each time point are indicated: * indicates p < 0.5, **p < 0.01, ***p < 0.001, ****p < 0.0001. Alternatively, cells were transfected at day -2 and day 0 of differentiation with empty vector or plasmids encoding seipin (BSCL2), GPAT3, or co-transfected with both seipin (BSCL2) and GPAT3, as indicated. RNA was isolated at day 0 or day 2 of differentiation and expression of BSCL2/seipin (G), GPAT3 (H), Pparγ (I), C/ebpα (J), aP2 (K) and Glut4 (L) determined by qPCR. Data are presented as means ± SEM, (n = 4), normalized to Ywhaz. Statistical analysis was made by one-way ANOVA followed by Dunnett’s multiple comparison post-hoc test. Statistically significant differences compared to control day 0 (Mock Day 0) are indicated by *p < 0.05, **p < 0.01, ***p < 0.001, ****p < 0.0001. Statistically significant differences compared to control (Mock day 2) samples are indicated by ###p < 0.001, ####p < 0.0001. (M) Identically transfected cells were also differentiated for 3 days, fixed and immunostained to detect FLAG-seipin/BSCL2 (red) or Myc-GPAT3 (red), anti-PPARγ (green) and DAPI for nuclei (blue). Co-transfected cells were immunostained for myc-GPAT3. (N) Quantified PPARγ signal intensity in the nuclei of untransfected and transfected cells in 50 nuclei per group in two independent experiments. Scale bar, 20 µm. Data represent means ± SEM. (O) Representative image of C3H10T1/2 overexpressing GPAT3 fixed at day 5 of differentiation and immunostained with antibodies to Myc-GPAT3 (green) and LipidTox to visualize lipid droplets.
Figure 5
Figure 5
Seipin potentiates the interaction between AGPAT2 and GPAT3. (A) HEK293 cells were co-transfected with constructs in which the N terminus of YFP was fused to the N terminus (Yn-A) or C terminus (A-Yn) of AGPAT2-Myc, and with constructs in which the C-terminus of YFP was fused to the N terminus (Yc-G) or C terminus (G-Yc) of GPAT3, in the absence or presence of FLAG-tagged seipin. Following a temperature shift to induce the formation of reconstituted YFP, cells were fixed and immunostained for Myc (AGPAT2) or FLAG (seipin), and DAPI to label nuclei. The interaction between AGPAT2 and GPAT3 is indicated by the presence of a YFP signal. Individual images are shown in grayscale and merged images show overlay of YFP (yellow) and AGPAT2-Myc or FLAG-seipin (red). Scale bars, 10 μm. (B) Quantified total BiFC signal intensity per image in 20 random images each of 3 separate experiments, normalized against a BiFC positive control, where cells were transfected with GPAT3-Yc and seipin-Yn. Data represent means ± SEM (n = 3). *** indicates p < 0.01 versus co-immunoprecipitation in the absence of seipin. (C) HEK293 cells were co-transfected with AGPAT2-Yn and GPAT3-Yc constructs in the presence of wild-type Myc-tagged seipin or identically-tagged mutant seipin lacking the loop domain (ΔLP). Following a temperature shift to induce the formation of reconstituted YFP, cells were fixed and stained for Myc-seipin and DAPI to label nuclei. The indirect interaction between AGPAT2 and GPAT3 in the presence of seipin is indicated by the presence of YFP signal. Individual images are shown in grayscale, and merged images show overlay of YFP (yellow) and Myc-seipin (red). Scale bars, 10 μm. (D) Quantified total BiFC signal intensity per image in 20 random images, each of 3 separate experiments. Data shown represent the means ± SEM (n = 3). *** indicates p < 0.001 versus BiFC signal observed in the presence of wild-type seipin.
Figure 6
Figure 6
Inhibition of either seipin, Gpat3 or Agpat2 expression similarly inhibits adipogenesis. C3H10T1/2 cells were transfected with control siRNA (−ve) or siRNA targeting seipin (Bscl2), Agpat2 or Gpat3 as indicated at day -2 and day 0 of differentiation. RNA was extracted at various time points and expression of seipin (Bscl2) (A) Agpat2 (B) and Gpat3 (C) C/ebpα (D) aP2 (E) and Glut4 (F) was determined by qPCR. Data represent means ± SEM (n = 4), normalized to Ywhaz. Statistical analysis was made with one-way ANOVA followed by Dunnett’s multiple comparison test. At each time point, significant differences between Bscl2 siRNA samples versus control siRNA samples are indicated by *p < 0.05, **p < 0.01, ***p < 0.001, ****p < 0.0001; between Gpat3 siRNA samples versus control siRNA samples by #p < 0.05, ##p < 0.01, ####p < 0.0001; and between Agpat2 siRNA samples versus control siRNA samples by °p < 0.05, °°p < 0.01, °°°p < 0.001, °°°°p < 0.0001. (G) Identically-transfected cells were lysed and analysed for total and phospho-Akt (Ser-473) levels by immunoblotting at either day 0 or day 2 of differentiation as indicated. Calnexin was used as a loading control. Full blots are shown in Fig. S4. (H) Quantification of the ratio of phosho-Akt to total Akt protein. Data represent means ± SEM (n = 3); expression is relative to total Akt levels in the same samples. Statistically significant differences from expression in control siRNA transfected cells (-ve) are indicated by *p < 0.05, **p < 0.01, ***p < 0.001.

References

    1. Akinci B, Meral R, Oral EA. Phenotypic and Genetic Characteristics of Lipodystrophy: Pathophysiology, Metabolic Abnormalities, and Comorbidities. Curr. diabetes Rep. 2018;18:143. doi: 10.1007/s11892-018-1099-9. - DOI - PubMed
    1. Magre J, et al. Identification of the gene altered in Berardinelli-Seip congenital lipodystrophy on chromosome 11q13. Nat. Genet. 2001;28:365–370. doi: 10.1038/ng585. - DOI - PubMed
    1. Chen W, et al. Berardinelli-seip congenital lipodystrophy 2/seipin is a cell-autonomous regulator of lipolysis essential for adipocyte differentiation. Mol. Cell. Biol. 2012;32:1099–1111. doi: 10.1128/MCB.06465-11. - DOI - PMC - PubMed
    1. Chen W, et al. The human lipodystrophy gene product Berardinelli-Seip congenital lipodystrophy 2/seipin plays a key role in adipocyte differentiation. Endocrinol. 2009;150:4552–4561. doi: 10.1210/en.2009-0236. - DOI - PMC - PubMed
    1. Liu L, et al. Adipose-specific knockout of SEIPIN/BSCL2 results in progressive lipodystrophy. Diabetes. 2014;63:2320–2331. doi: 10.2337/db13-0729. - DOI - PubMed

Publication types

Substances