. 2020 Feb 24;10(1):3254.
doi: 10.1038/s41598-020-59952-x.

Physical Biomarkers of Disease Progression: On-Chip Monitoring of Changes in Mechanobiology of Colorectal Cancer Cells

Affiliations

Physical Biomarkers of Disease Progression: On-Chip Monitoring of Changes in Mechanobiology of Colorectal Cancer Cells

Fern J Armistead et al. Sci Rep. .

Abstract

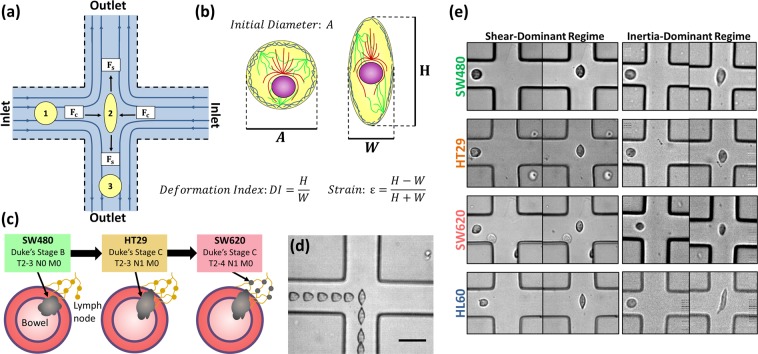
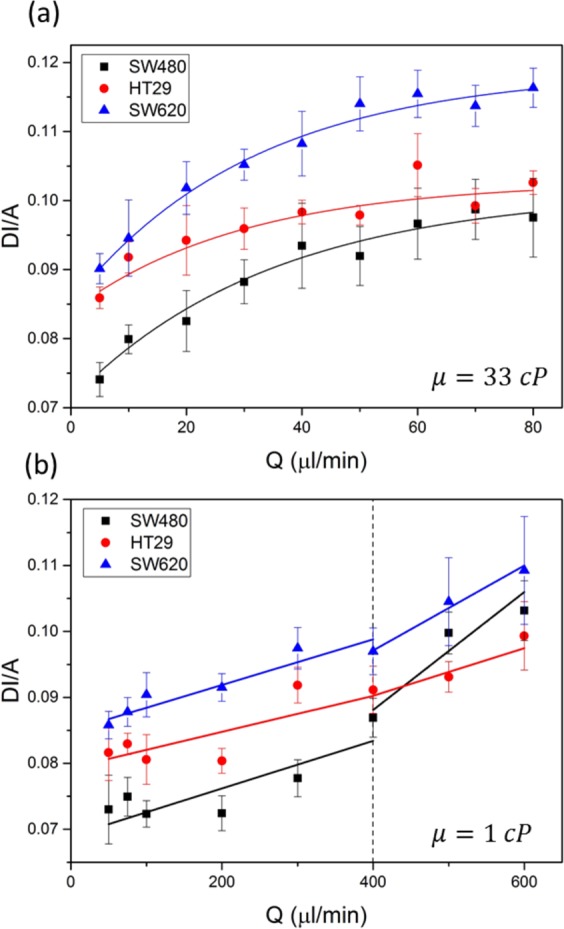
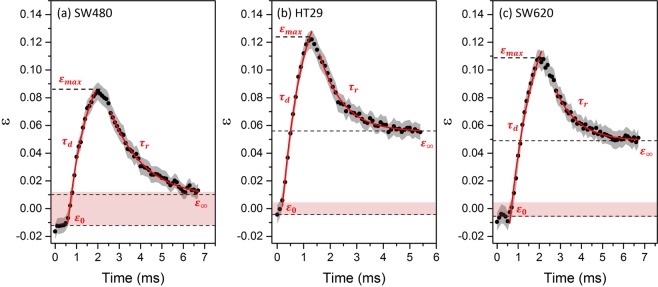
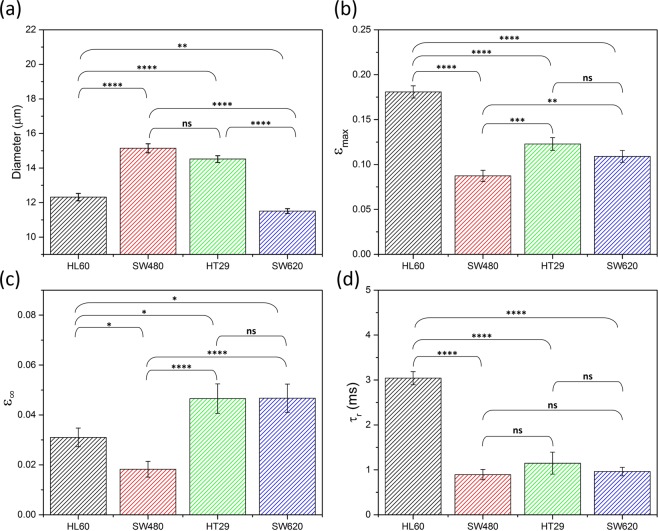
Disease can induce changes to subcellular components, altering cell phenotype and leading to measurable bulk-material mechanical properties. The mechanical phenotyping of single cells therefore offers many potential diagnostic applications. Cells are viscoelastic and their response to an applied stress is highly dependent on the magnitude and timescale of the actuation. Microfluidics can be used to measure cell deformability over a wide range of flow conditions, operating two distinct flow regimes (shear and inertial) which can expose subtle mechanical properties arising from subcellular components. Here, we investigate the deformability of three colorectal cancer (CRC) cell lines using a range of flow conditions. These cell lines offer a model for CRC metastatic progression; SW480 derived from primary adenocarcinoma, HT29 from a more advanced primary tumor and SW620 from lymph-node metastasis. HL60 (leukemia cells) were also studied as a model circulatory cell, offering a non-epithelial comparison. We demonstrate that microfluidic induced flow deformation can be used to robustly detect mechanical changes associated with CRC progression. We also show that single-cell multivariate analysis, utilising deformation and relaxation dynamics, offers potential to distinguish these different cell types. These results point to the benefit of multiparameter determination for improving detection and accuracy of disease stage diagnosis.


Conflict of interest statement

The authors declare no competing interests.

Figures

Figure 1
Figure 1
(a) Schematic of cross-flow region. (b) Schematic of a cell including the nucleus and cytoskeletal filaments (actin, microtubules and intermediate filaments) which are the main contributors of cell stiffness. Also included are parameters extracted from high speed videos of cell deformation: A is the initial diameter of the cell before it deforms, H is the height of the cell and W is the width of the cell. (c) Schematic describing the model for colorectal cancer progression using the three cell lines: SW480, HT29 and SW620. (d) Superimposed bright field images showing a single cell entering (from left) the stagnation point (SP) of an extensional flow device and exiting to the bottom of the chamber. (e) Example images of deformation events of SW480, HT29, SW620 and HL60 cell lines. Including an image before the cell is deformed and an image of deformation at the SP, for a shear-dominant and inertia-dominant-flow regime. Images from the shear-dominant regime were at a flow rate of Q = 50 µl/min with suspension buffer viscosity of µ = 33 cP, and in the inertia dominant regime Q = 600 µl/min and µ ≈ 1 cP.
Figure 2
Figure 2
Size normalized deformation index (DI/A) for three colorectal cancer cell lines over a range of flow rates (µl/min). DI/A was averaged from datasets from 3 separate experiments combined. (a) The flow regime was shear dominant, the viscosity of the cell suspension buffer was 33 cP. The total number of events measured was: 93 < n < 931 for SW480, 160 < n < 596 for HT29 and 280 < n < 734 for SW620. (b) The flow regime was inertia dominant, the viscosity of the cell suspension buffer was 1 cP. The total number of events measured was: 30 < n < 603 for SW480, 47 < n < 619 for HT29 and 30 < n < 450 for SW620.
Figure 3
Figure 3
Strain ε was tracked for the three CRC cell types as a function of time, with the standard error shown by the grey shaded areas. Q was fixed at 5 µl/min and the suspension medium viscosity was 33 cP. The final strain is marked by dashed lines (ε), found by extrapolation of a exponential fit to the relaxation (red line). (a) The averaged deformation trace of N = 56 SW480 cells. (b) The averaged deformation trace of N = 49 HT29 cells. (c) The averaged deformation trace of N = 50 SW620 cells.
Figure 4
Figure 4
Multiparameter analysis of HL60, SW480, SW620 and HT29 cell populations. The error bars denote the standard error SE, statistical t-tests were done to determine the level of significance. (a) Initial cell diameter, (b) The maximum strain εmax, (c) the final strain ε and (d) the relaxation time τr were extracted from deformation traces of single cells deforming at 5 µl/min in a shear dominant regime (~33 cP).
Figure 5
Figure 5
Linear discriminant analysis of the four cell lines; HL60, SW480, HT29 and SW620. Where the bar plot indicates the loadings for each of the linear discriminats (LD) (a), and the box plots and beeswarm plots on the right correspond to the scores on each of the LDs (b i-vi).

References

    1. Zheng Y, Nguyen J, Wei Y, Sun Y. Recent advances in microfluidic techniques for single-cell biophysical characterization. Lab. Chip. 2013;13(13):2464–83. doi: 10.1039/c3lc50355k. - DOI - PubMed
    1. Baskurt OK, Gelmont D, Meiselman HJ. Red blood cell deformability in sepsis. Am J. Respir. Crit. Care Med. 1998;157(2):421–7. doi: 10.1164/ajrccm.157.2.9611103. - DOI - PubMed
    1. Guo Q, Reiling SJ, Rohrbach P, Ma H. Microfluidic biomechanical assay for red blood cells parasitized by Plasmodium falciparum. Lab. Chip. 2012;12(6):1143. doi: 10.1039/c2lc20857a. - DOI - PubMed
    1. McMillan DE, Utterback NG, La Puma J. Reduced erythrocyte deformability in diabetes. Diabetes. 1978;27(9):895–901. doi: 10.2337/diab.27.9.895. - DOI - PubMed
    1. Stuart J, Nash GB. Red cell deformability and haematological disorders. Blood Rev. 1990;4(3):141–147. doi: 10.1016/0268-960X(90)90041-P. - DOI - PubMed

Publication types