. 2020 Feb 24;10(1):3318.
doi: 10.1038/s41598-020-60150-y.

Low Protein-High Carbohydrate Diets Alter Energy Balance, Gut Microbiota Composition and Blood Metabolomics Profile in Young Pigs

Affiliations

Low Protein-High Carbohydrate Diets Alter Energy Balance, Gut Microbiota Composition and Blood Metabolomics Profile in Young Pigs

Shelby Spring et al. Sci Rep. .

Abstract

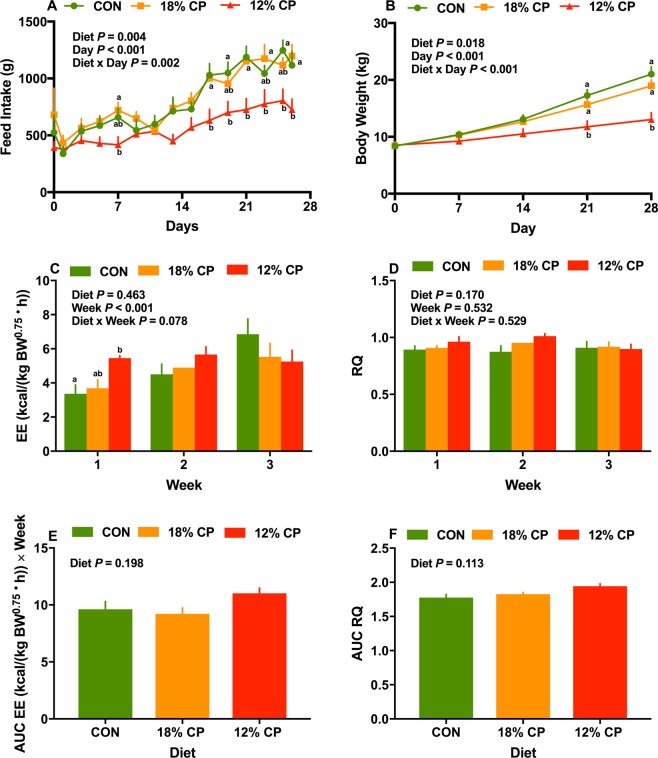
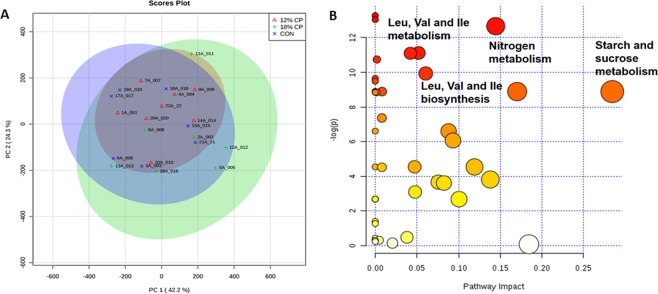
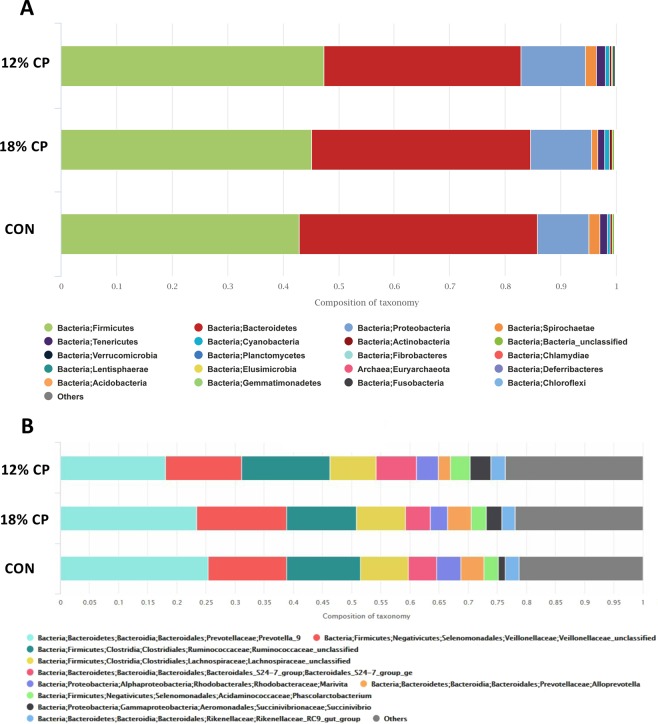
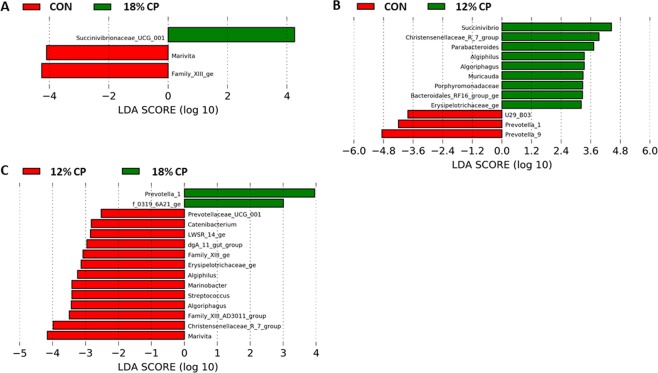
Reducing dietary crude protein (CP) beyond a certain threshold leads to poor growth performance in pigs; however, the underlying mechanisms are not well understood. Following an adaption period, thirty-seven weaned pigs were weight matched (8.41 ± 0.14 kg), housed individually and randomly assigned into three groups with different dietary CP levels: 24% CP (CON; n = 12), 18% CP (n = 12) and 12% CP (n = 13) for 28 days. The body weight was not different between the CON and 18% CP diets, but 12% CP significantly decreased body weight after day 21. Compared to the CON, pigs fed with 12% CP decreased feed intake day 17 onwards. The 12% CP diet increased the energy expenditure during week 1 compared to the CON. The 12% CP influenced starch and sucrose, nitrogen, and branched-chain amino acids metabolism pathways. The feces of pigs fed with 12% CP were less enriched in Prevotella, but had higher relative abundance of Christensenedilaceae, Aligiphilus and Algoriphagus than CON and 18% CP. Overall, reducing dietary CP by 50%, but not by 25%, significantly influenced the physiological responses in nursery pigs. The pigs fed with low or standard protein diets had differential bacterial communities in their feces as well as serum metabolomics profile.


Conflict of interest statement

The authors declare no competing interests.

Figures

Figure 1
Figure 1
The effect of low protein diets on energy balance. (A) feed intake, (B) body weight, (C) mean energy expenditure (EE), (D) mean respiratory quotient (RQ), (E) area under curve (AUC) for EE, (F) AUC for RQ. CON, control diet with 24% crude protein (CP); 18% CP, low protein diet with 18% CP; 12% CP, low protein diet with 12% CP. Among groups, values with different superscripts are significantly different (P < 0.05). The values are means ± standard errors of means. n = 12, n = 12, n = 13 for CON, 18% CP and 12% CP groups, respectively for feed intake and body weight data; n = 7, n = 7, n = 8 for CON, 18% CP and 12% CP groups, respectively for EE and RQ data.
Figure 2
Figure 2
Principle component analysis (PCA) score plots and the pathway analysis map of serum metabolites in piglets fed with low protein diets. (A) PCA score plots of serum metabolites. Each node represents an individual pig. (B) The map of pathway analysis for the metabolites detected in the blood serum. Each circle represents a metabolic pathway with the scores obtained from topology analysis (pathway impact; the x-axis) and the pathway enrichment analysis (y-axis). The color of each circle is based on its p-value, while the size of each circle is based on its impact values. Therefore, larger size circles are indicative of higher pathway impact, while darker colors circles are suggestive of more significant changes of metabolites and higher pathway enrichment. No difference in pathway enrichment was found between CON and 18% crude protein (CP) or between 18% CP and 12% CP. Therefore, the data for both CON and 18% CP were combined and compared with 12% CP for pathway enrichment. CON, control diet with 24% CP; 18% CP, low protein diet with 18% CP; 12% CP, low protein diet with 12% CP. n = 7, n = 7, n = 8 for CON, 18% CP and 12% CP groups, respectively.
Figure 3
Figure 3
Beta diversity of the fecal bacterial community in nursery pigs fed with different levels of dietary protein at genus level. Principle coordinates analysis (PCoA) of fecal microbiota for (A) CON vs. 18% crude protein (CP), (B) CON vs. 12% CP, (C) 12% CP vs. 18% CP, (D) 12% CP vs. 18% CP vs. CON. Pigs are grouped based on their dietary treatments, i.e. CON, control diet with 24% CP; 18% CP, low protein diet with 18% CP; 12% CP, low protein diet with 12% CP. Each node represents an individual pig. Differences were considered significant at P < 0.05. The PERMANOVA P values for CON vs. 18% CP, CON vs. 12% CP, 12% CP vs. 18% CP and 12% CP vs. 18% CP vs. CON were 0.38, 0.07, 0.02 and 0.04, respectively. n = 7, n = 7, n = 8 for CON, 18% CP and 12% CP groups, respectively.
Figure 4
Figure 4
The effect of low protein diets on fecal bacterial community at phylum and genus level. (A) The relative abundance of bacterial community composition at phylum level in fecal samples of pigs fed with different levels of dietary protein. Only the top 20 phyla are depicted for clarity. (B) The relative abundance of bacterial community composition at genus level in fecal samples of pigs fed with different levels of dietary protein. Only the top 10 genera are depicted for clarity. CON, control diet with 24% crude protein (CP); 18% CP, low protein diet with 18% CP; 12% CP, low protein diet with 12% CP. n = 7, n = 7, n = 8 for CON, 18% CP and 12% CP groups, respectively.
Figure 5
Figure 5
Effect of low protein diets on fecal microbiota composition at genus level using linear discriminant analysis (LDA) with effect size (LEfSe). (A) CON vs. 18% crude protein (CP), (B) CON vs. 12% CP, (C) 12% CP vs. 18% CP. CON, control diet with 24% CP; 18% CP, low protein diet with 18% CP; 12% CP, low protein diet with 12% CP. n = 7, n = 7, n = 8 for CON, 18% CP and 12% CP groups, respectively.

References

    1. Webb J, Broomfield M, Jones S, Donovan B. Ammonia and odour emissions from UK pig farms and nitrogen leaching from outdoor pig production. A review. Sci. Total Environ. 2014;470-471:865–75. doi: 10.1016/j.scitotenv.2013.09.091. - DOI - PubMed
    1. Groenestein CM, et al. Comparison of ammonia emissions related to nitrogen use efficiency of livestock production in Europe. J Clean Prod. 2019;211:1162–1170. doi: 10.1016/j.jclepro.2018.11.143. - DOI - PMC - PubMed
    1. Wang Y, et al. Advances in low-protein diets for swine. J. Anim. Sci. Biotechnol. 2018;9:60. doi: 10.1186/s40104-018-0276-7. - DOI - PMC - PubMed
    1. Li DF, et al. Measuring suitability of soybean products for early-weaned pigs with immunological criteria. J. Anim. Sci. 1991;69:3299–307. doi: 10.2527/1991.6983299x. - DOI - PubMed
    1. Pluske JR, Pethick DW, Hopwood DE, Hampson DJ. Nutritional influences on some major enteric bacterial diseases of pig. Nutr. Res. Rev. 2002;15:333–71. doi: 10.1079/NRR200242. - DOI - PubMed

Publication types

Substances