. 2020 Apr;5(4):570-583.
doi: 10.1038/s41564-020-0674-4. Epub 2020 Feb 24.

A MORC-driven transcriptional switch controls Toxoplasma developmental trajectories and sexual commitment

Affiliations

A MORC-driven transcriptional switch controls Toxoplasma developmental trajectories and sexual commitment

Dayana C Farhat et al. Nat Microbiol. 2020 Apr.

Abstract

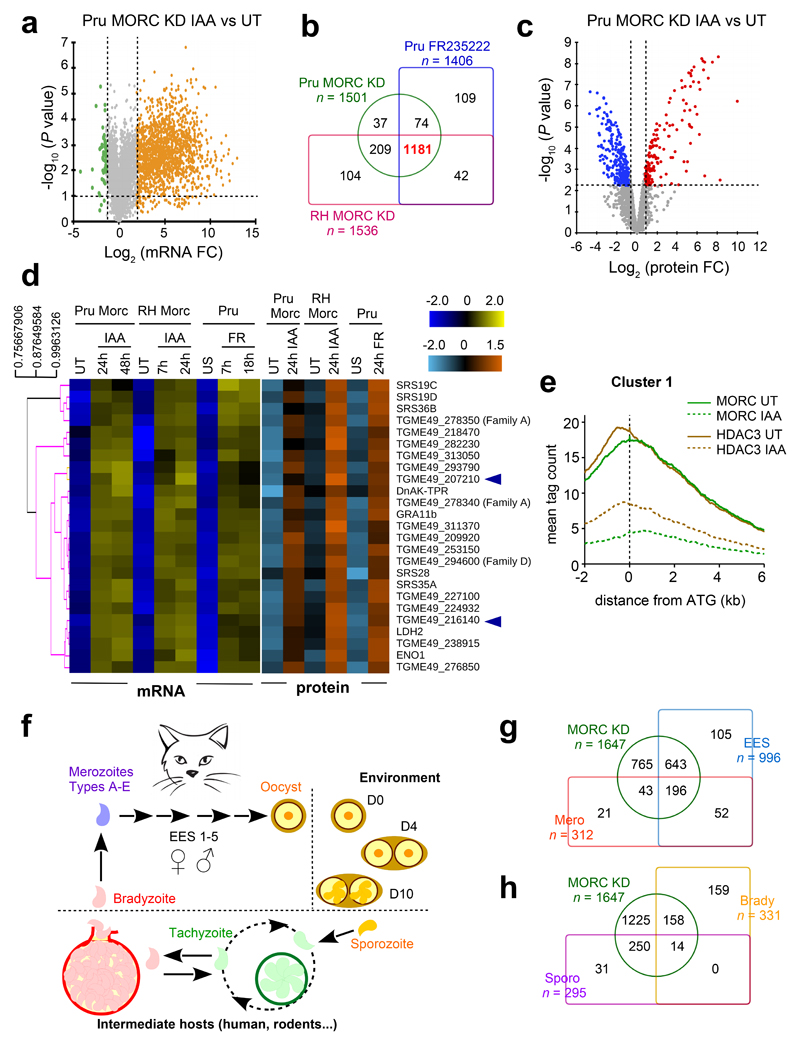
Toxoplasma gondii has a complex life cycle that is typified by asexual development that takes place in vertebrates, and sexual reproduction, which occurs exclusively in felids and is therefore less studied. The developmental transitions rely on changes in the patterns of gene expression, and recent studies have assigned roles for chromatin shapers, including histone modifications, in establishing specific epigenetic programs for each given stage. Here, we identified the T. gondii microrchidia (MORC) protein as an upstream transcriptional repressor of sexual commitment. MORC, in a complex with Apetala 2 (AP2) transcription factors, was shown to recruit the histone deacetylase HDAC3, thereby impeding the accessibility of chromatin at the genes that are exclusively expressed during sexual stages. We found that MORC-depleted cells underwent marked transcriptional changes, resulting in the expression of a specific repertoire of genes, and revealing a shift from asexual proliferation to sexual differentiation. MORC acts as a master regulator that directs the hierarchical expression of secondary AP2 transcription factors, and these transcription factors potentially contribute to the unidirectionality of the life cycle. Thus, MORC plays a cardinal role in the T. gondii life cycle, and its conditional depletion offers a method to study the sexual development of the parasite in vitro, and is proposed as an alternative to the requirement of T. gondii infections in cats.


Conflict of interest statement

Declaration of Interests

The authors declare no competing interests.

Figures

Extended Data Fig. 1
Extended Data Fig. 1. Domain architectures and expression levels during the life cycle of MORC and partners.
a, Representative domain architectures of T. gondii MORC and partners identified by mass spectrometry-based proteomic are shown. Domains were predicted by SMART and PFAM: ELM2 (Egl-27 and MTA1 homology 2), PHD (plant homeodomain), and AP2 (APETALA2) b, Heatmap representation of MORC and partners gene expression in different life cycle stages (source: ToxoDB). Gene expression values were mean log2 transformed and median centered for clustering. Transcriptomic data from tachyzoite, merozoite, longitudinal studies on enteroepithelial stages (EES1 to EES5), immature (day 0), maturing (day 4) and mature (day 10) stages of oocyst development and cysts from chronically infected mice were used. c, Mapping of domains and identified phosphorylation and ubiquitination sites detected by mass-spectrometry (source: ToxoDB).
Extended Data Fig. 2
Extended Data Fig. 2. mAID-based MORC inducible KD system successfully ablated its expression on the protein post-translational level in both type I (RH) and type II (Pru) strains.
a, Auxin-inducible degradation system for controlling protein stability in T. gondii. We first engineered RH and Pru strains ectopically expressing the plant auxin receptor called transport inhibitor response 1 (TIR1). We chose the UPRT locus to integrate TIR1 under the control of a promoter allowing a mild expression of the protein tagged to Ty. We utilized a mini-AID (mAID) tagging LIC system for conditional MORC depletion. The resulting cell lines are referred to as MORC-KD hereafter. Conditional depletion of MORC-mAID-HA is reliant on auxin (IAA), TIR1, and the proteasome. b, Depletion of MORC-mAID-HA, upon addition of IAA for 16 hours, was measured by IFA in cells infected with Pru MORC KD. Fixed and permeabilized parasites were probed with MORC-mAID-HA (red) and GAP45 (green). MORC-depleted cells displayed strong inhibition of proliferation when compared to untreated cells. Yet, this growth defect phenotype was completely reversed upon IAA washout, indicating that MORC depletion while impeding the cell cycle progression does not kill the parasites. Graph on the right, in situ quantification of nuclear MORC-mAID-HA using IFA. The horizontal bars represent the mean ± s.d. of the nuclear MORC intensity from three independent experiments (n = 50 nuclei per dot). The p-values were calculated using one-way ANOVA. Scale bar, 10 μm. c, in situ quantification (related to Fig. 2c) of nuclear MORC-mAID-HA using IFA in RH MORC KD as described above. d, Smoothed and background-subtracted tag density profiles are displayed over representative regions of Chr. V (top) and X (bottom). The ChIP-seq profiles were obtained with antibodies directed against pan-acetylated histone H4, HDAC3 and HA (MORC detection) from chromatin sampled from a Pru MORC KD strain left untreated (UT) and or treated with IAA for 24 hours. The experiment was repeated independently twice with similar results.
Extended Data Fig. 3
Extended Data Fig. 3. MORC protein depletion, and HDAC3 inhibition induces gene expression.
a, Volcano plots showing gene expression differences identified from comparison of UT versus FR235222 in Pru MORC KD (left graph) and of UT versus IAA (24 hours) in RH MORC KD (right graph) (n=8914 genes, SI Table 3). The orange and green dots indicate the number of significantly up- and down-regulated genes, respectively, using adjusted p < 0.01 (Bonferroni-corrected) and ± 2-fold change as the cut-off threshold corresponding to each comparison. X-axis showing log2 fold change, Y-axis showing -log10(p value). b, Volcano plots illustrating changes in protein expression between UT versus FR235222 in Pru MORC KD (left graph, n=2566 proteins, Benjamini-Hochberg FDR = 1 %, p-value ≤ 0.00794) and of UT versus IAA (24 hours) in RH MORC KD (right graph, n=2139 proteins, Benjamini-Hochberg FDR = 1.01%, p-value ≤ 0.00501). Overexpressed proteins upon MORC depletion are indicated in red and under-expressed ones in blue. c, Pru strains were engineered to endogenously epitope tag with HA two MORC-regulated genes, TGME49_207210 and TGME49_216140. Expression was monitored following HDAC3 chemical inactivation by FR235222 and HA staining. Scale bars, 10 μm. Experiments were conducted more than three times and representative images are displayed.
Extended Data Fig. 4
Extended Data Fig. 4. MORC alongside HDAC3 represses the expression of sexual stages-specific genes.
a, A type II (ME49) strain was engineered to endogenously expressed a HA tag version of the merozoite gene TGME49_238915. Genetic inactivation of HDAC3, MORC and AP2-XII-1 promote TGME49_243940 protein expression (in red). The efficiency of genetic disruption in Cas9-expressing parasites was monitored by cas9-GFP expression (in green). Scale bar, 5 μm. b, Expression of TGME49_243940 was monitored following HDAC3 chemical inactivation by FR235222 and HA staining (in red). Scale bar, 10 μm. c, Heatmap showing hierarchical clustering analysis of selected MORC-regulated genes from cluster 1 through different strain/induction combinations, including the abundance of their transcripts in the various stages of development, namely tachyzoite, bradyzoite/cyst, merozoite, enteroepithelial stages (EES) and oocyst stages. The color scale bar indicates log2 fold changes. d, Expression of TGME49_316130 was monitored following HDAC3 chemical inactivation by FR235222 and HA staining (in red). Scale bar, 10 μm. Experiments in a, b and d were conducted more than three times and representative images are displayed.
Extended Data Fig. 5
Extended Data Fig. 5. MORC KD derepresses proteins involved in merozoite and fertilization.
a, Smoothed and background-subtracted tag density profiles are displayed over Chr. VI. The ChIP-seq profiles were obtained with antibodies directed against various histone marks, HDAC3 and HA (MORC detection) from chromatin sampled from a Pru MORC KD strain left untreated (UT) and or treated with IAA for 24 hours. RNA-seq data through different strain/induction combinations are shown in black. The y-axis depicts read density from ChIP-seq and RPKM values for RNA-seq data. The merozoite-specific gene TGME49_238915 is shown in dark blue. b, Pru strain was engineered to endogenously expressed HA epitope-tagged TGME49_238915. Expression was monitored following HDAC3 chemical inactivation by FR235222 and HA staining. Scale bar, 10 μm. Experiment was conducted more than three times and representative images are displayed. c, Density profiles are displayed on Chromosome V at the TgHAP2 (TGME49_285940) locus. d, Density profiles are displayed on Chromosome X around a merozoite-specific cluster of tandemly repeated genes (SRS48 family). (a, c-d) The experiment was repeated independently twice with similar results. Chromosomal positions are indicated on x-axis.
Extended Data Fig. 6
Extended Data Fig. 6. MORC regulates microgamete related genes including those coding for flagella components.
Heatmap representation of RNA-seq data portraying the number of genes involved in microgamete biology, alongside their levels of expression upon MORC depletion/HDAC3 inhibition through different strain/induction combinations. The abundance of their transcripts in the various stages of development, namely tachyzoite, bradyzoite/cyst, merozoite, enteroepithelial stages (EES) and oocyst stages was displayed. The color scale bar indicates log2 fold changes. The genes were divided in sets grouping together genes involved in axonemal cytoskeleton, and genes that harbor potential domains involved in intraflagellar transportation.
Extended Data Fig. 7
Extended Data Fig. 7. MORC depletion induces the expression of genes involved in oocyst wall formation and coding for sporozoite-specific markers.
a, Density profiles are displayed on Chromosome VIIb at the SporoSAG/SRS28 (TGME49_258550) locus, encoding for the hallmark surface antigen in sporozoite. The ChIP-seq profiles were obtained with antibodies directed against various histone PTMs, HDAC3 and HA (MORC detection) from chromatin sampled from a Pru MORC KD strain left UT and or treated with IAA for 24 hours. RNA-seq data through different strain/induction combinations are shown in black. The y-axis depicts read density from ChIP-seq and RPKM values for RNA-seq data. b, Density profiles are displayed on Chromosome XI at the TgHowp1 (TGME49_316890) locus. TgHOWP1 is a representative example of proteins expressed in the early stages of wall formation as revealed by the accumulation of its transcripts in both late developmental EES5 and in immature (D0) oocyst (ToxoDB data). c, Density profiles are displayed on Chromosome VIIb at the TGME49_262110 locus. Expression of TGME49_262110 was monitored following HDAC3 chemical inactivation by FR235222 and HA staining (in green). Experiments was conducted more than three times and representative images are displayed. Scale bar, 5 μm. (a-c) The experiment was repeated independently twice with similar results. Chromosomal positions are indicated on x-axis.
Extended Data Fig. 8
Extended Data Fig. 8. MORC depletion derepresses partly bradyzoite-specific genes.
a, Heatmap showing hierarchical clustering analysis of selected bradyzoite-specific and MORC-regulated genes from cluster 1 through different strain/induction combinations. The abundance of their transcripts in the various stages of development, namely tachyzoite, bradyzoite/cyst, merozoite, enteroepithelial stages (EES) and oocyst stages was displayed. The color scale bar indicates log2 fold changes. b, Density profiles are displayed on Chromosome VIIb at the Bag1 (TGME49_259020) locus, encoding for the hallmark surface antigen in bradyzoite. The ChIP-seq profiles were obtained with antibodies directed against various histone PTMs, HDAC3 and HA (MORC detection) from chromatin sampled from a Pru MORC KD strain left UT and or treated with IAA for 24 hours. RNA-seq data through different strain/induction combinations are shown in black. The y-axis depicts read density from ChIP-seq and RPKM values for RNA-seq data. The experiment was repeated independently twice with similar results. Chromosomal positions are indicated on x-axis.
Extended Data Fig. 9
Extended Data Fig. 9. MORC depletion causes indirect repression of tachyzoites specific genes.
a-b, Density profiles are displayed at the tachyzoite-specific ROP16 (a) and RON2 (b) genes. The ChIP-seq profiles were obtained with antibodies directed against various histone marks, HDAC3 and HA (MORC detection) from chromatin sampled from a Pru MORC KD strain left UT and or treated with IAA for 24 hours. RNA-seq data through different strain/induction combinations are shown in black. The y-axis depicts read density from ChIP-seq and RPKM values for RNA-seq data. The experiment was repeated independently twice with similar results. Chromosomal positions are indicated on x-axis.
Extended Data Fig. 10
Extended Data Fig. 10. MORC regulates the expression of AP2IV-3, a Plasmodium falciparum AP2-G homologous protein.
a, Density profiles are displayed at the merozoite-specific AP2IV-3 gene. The ChIP-seq profiles were obtained with antibodies directed against various histone marks, HDAC3 and HA (MORC detection) from chromatin sampled from a Pru MORC KD strain left UT and or treated with IAA for 24 hours. RNA-seq data through different strain/induction combinations are shown in black. The y-axis depicts read density from ChIP-seq and RPKM values for RNA-seq data. The experiment was repeated independently twice with similar results. Chromosomal positions are indicated on x-axis. b, Representative domain architectures of T. gondii AP2IV-3 and P. falciparum AP2-G, displaying the approximate AP2 domain position within the protein sequence. c, Protein alignment of the AP2IV-3 and AP2-G respective AP2 domains, with the amino acid homology shown in red.
Fig. 1
Fig. 1. MORC, a highly conserved ATPase protein, interacts with HDAC3 in T. gondii.
a, MORC withholds 3 predicted structured domains: KELCH motifs, a conserved HATPase catalytic domain and a C-terminal CW type zinc finger domain, all displayed using cartoon secondary structures in blue, red and orange respectively. Structural predictions were modeled using the Phyre2 server and are represented by an enclosed surface cartoon diagram using UCSF Chimera. b, Schematic circular phylogram showing the relationships between MORC proteins (detailed in SI Fig. 1). The MORC domains have arisen early in eukaryotic evolution before the divergence of plants and animals. In this context, apicomplexan MORC family shares its speciation event with metazoans but not with land plants. Apicomplexan parasites have only one gene copy coding for MORC, while other species have expanded family. c, Representative domain architectures of T. gondii MORC domains and of related proteins are shown. MORC is encoded by the gene TGME49_305340. d, Nuclear location of MORC (green) and HDAC3 (red) in HFF cells infected with parasites expressing an HA-Flag (HF)-tagged copy of MORC. Cells were co-stained with Hoechst DNA-specific dye. Scale bar, 5 μm. e, MORC forms a partnership with HDAC3. Size-exclusion chromatography of MORC-containing complexes after FLAG-affinity selection. The fractions were analyzed on silver-stained SDS–PAGE gels (top) and processed with Western blots to detect MORC–HF (anti-HA) and HDAC3 (bottom). f, Mass spectrometry-based proteomic analysis of Flag elution identified MORC and its partners. The identities of the proteins are indicated on the right. g-h, the purification was repeated using HFF cells infected with a type II (Pru) strain expressing a HF-tagged copy of MORC. Flag-affinity eluates were analyzed by western blot to detect MORC–HA–FLAG and HDAC3 and by mass spectrometry-based proteomic to identify shared complexes between the type I (RH) and type II (Pru) strains. d-h All data are representative of three independent biological experiments.
Fig. 2
Fig. 2. HDAC3’s recruitment to the chromatin is mediated by MORC.
a, Scatterplot comparing the enrichment levels between MORC and HDAC3. ChIP-seq data from HFF cells infected with Pru MORC-HF (left) and Pru MORC-mAID-HA_KD (right) left untreated (UT) were analyzed. The x- and y-axis show the average tag count of the enrichment (n=8322 genes). Pairwise correlations were calculated using Pearson correlation coefficient (r). b, Distribution of MORC-, HDAC3- and PTM-occupied regions relatively to the T. gondii reference genome annotation. c, MORC-mAID-HA protein expression levels upon 7 hours of adding IAA, displayed by IFA on cells infected with RH MORC-mAID-HA. Fixed and permeabilized parasites were probed with MORC-mAID-HA (red) and GAP45 (green). d, Time course analysis of the expression levels of MORC-mAID-HA. Samples were taken at the indicated time periods after addition of IAA and probed with antibodies to HA and HDAC3. IAA-treated (3 days) parasites were also washed, incubated with fresh media in the absence of IAA (2 days) and subjected to a western analysis. Same experiment was repeated three times and a representative blot is displayed. e, Coexpression of MORC-mAID-HA (green) and HDAC3 (red) in RH MORC KD left untreated (UT) or treated with IAA for 16 hours. On the right, nuclear areas marked by HDAC3 and MORC at a higher magnification. f, Genome-wide MORC and HDAC3 occupancy profiles in Pru MORC KD left UT and treated with IAA for 30 hours. The average signals profiles of each protein were plotted across a -2 kb to +6 kb region with respect to T. gondii genes ATG. The y-axis shows the average tag count of the enrichment. g, IGB view of MORC and HDAC3 enrichment across T. gondii Chromosome X before and after MORC degradation, assessing the extent of the effect of MORC on the HDAC3 chromatin occupancy. The y-axis depicts read density. Experiment in c and e were conducted three times and representative images are displayed. Scale bar, 10 μm.
Fig. 3
Fig. 3. MORC’s protein depletion phenocopies HDAC3’s inhibition by inducing the expression of sexual stage-specific genes.
a, Volcano plot displaying gene expression variations between the contexts of untreated (UT) versus IAA-treated (24 hours) Pru MORC KD parasites (n=8914, SI Table 3). The orange and green dots indicate the number of significantly up- and down-regulated genes, respectively, using adjusted p < 0.01 (Bonferroni-corrected) and ± 2-fold change as the cut-off threshold corresponding to each comparison. b, Venn diagram comparing upregulated mRNAs upon MORC depletion in RH and Pru strains as well as in the context of HDAC3 inhibition by FR235222. c, Volcano plot illustrating changes in protein expression between Pru MORC KD left UT and treated with IAA for 24 hours (n=1673 proteins, SI Table 5). Overexpressed proteins upon MORC depletion are indicated in red and under-expressed ones in blue. Benjamini-Hochberg FDR = 1.02 % (p-value ≤ 0.00631). d, Heatmap showing hierarchical clustering analysis (Pearson correlation) of the selected cluster 1 genes and their corresponding proteins differentially regulated upon MORC depletion through different strain/induction combinations. Parasites were left unstimulated (US) or treated with FR235222 to inhibit HDAC3. The color scale bar indicates log2 fold changes. e, Genome-wide MORC and HDAC3 occupancy profiles at cluster 1 genes in Pru MORC KD left UT and treated with IAA for 30 hours. The average signal profiles of each protein were plotted over a -2 kb to +6 kb region with respect to T. gondii genes ATG. The y-axis shows the average tag count of the enrichment. f, Scheme of T. gondii life cycle presenting the different stages of the lytic asexual cycle in bottom and of the sexual stages on the top left, with the differentiation events occurring in the corresponding hosts and environments. g-h, Venn diagrams illustrating the overlap between the MORC-regulated cluster 1 genes (n = 1647) and the RNAs detected in the different life cycle stages (data source: ToxoDB).
Fig. 4
Fig. 4. MORC’s degradation, the same as HDAC3’s inhibition induce the expression of merozoite-restricted transcripts.
a, Venn diagram illustrating the overlap between the MORC-regulated genes in RH and in Pru strains, and the 312 genes whose expression were reported to be exclusive to merozoite. b, Heatmap showing mRNA hierarchical clustering analysis (Pearson correlation) of selected merozoite-specific genes and their corresponding proteins differentially regulated upon MORC depletion through different strain/induction combinations. The color scale bar indicates log2 fold changes. c, IFA of HFF infected with parasites harboring an mCherry endogenously tagged merozoite specific reporter gene (TGME49_243940) within the lineage RH MORC-mAID-HA. Fixed and permeabilized parasites were probed with HA (green) and mCherry (red). Scale bar, 10 μm. d, Genome-wide occupancy profiles of MORC and HDAC3 at merozoite-specific genes (n=268) in Pru MORC KD left UT and treated with IAA for 30 hours. e-f, Density profiles are displayed over representative regions of Chromosomes VI and (e) and II (f). Chromosomal positions are indicated on x-axis. The ChIP-seq profiles were obtained using antibodies directed against various histone marks, HDAC3 and HA (MORC detection) and chromatin sampled from a Pru MORC KD strain left untreated (UT) and or treated with IAA for 24 hours. RNA-seq data through different strain/induction combinations are shown in black. The y-axis depicts read density from ChIP-seq and RPKM (Reads Per Kilobase of transcript per Million mapped reads) values for RNA-seq data. The merozoite- and axonemal-specific genes TGME49_243940 (e) and TgPF16 (TGME49_297820; f) are shown in dark blue, respectively. The experiment was repeated independently twice with similar results. g, IFA of HFF infected with parasites harboring an endogenously FLAG-tagged axonemal-specific reporter gene (TgPF16) within the lineage RH MORC-mAID-HA. Fixed and permeabilized parasites were co-stained with FLAG (red) and Hoechst DNA-specific dye (blue). Scale bar, 5 μm. Experiments in c and g were conducted more than three times and representative images are displayed.
Fig. 5
Fig. 5. MORC regulates developmental transitions at multiple checkpoints.
a, Heatmap showing mRNA hierarchical clustering analysis (Pearson correlation) of selected oocyst/sporozoite-specific genes and their corresponding proteins differentially regulated upon MORC depletion through different strain/induction combinations. The abundance of their transcripts in the various stages of development, namely tachyzoite, bradyzoite/cyst, merozoite, EES and oocyst was displayed. The color scale bar indicates log2 fold changes. b, Expression of a sporozoite-specific protein upon MORC depletion in RH strain was measured by IFA. Parasites were probed with G1/19 mAb-reactive sporozoite-specific protein (in red) and GAP45 (green). c, Genome-wide MORC and HDAC3 occupancy profiles at sporozoite-specific genes (n=264) in Pru MORC KD left UT and treated with IAA for 30 hours. d, Expression levels of bradyzoite- and cyst-specific markers upon MORC depletion in RH strain were measured by IFA. Fixed and permeabilized parasites were probed with CC2, BCLA or BAG1 (green) along with Dolichos biflorus Agglutinin (DBA) lectin (red). e, Time course analysis of expression levels of bradyzoite (BCLA and BAG1)- and merozoite (TGME49_243940)-specific markers after MORC-mAID-HA depletion. Samples were taken at the indicated time periods after addition of IAA and probed with antibodies against HA, BCLA, BAG1 and mCherry. The experiment was repeated three times and a representative blot is presented. f-g, IFA of HFF infected with MORC-HA-mAID RH parasites expressing a targeted knock-in merozoite specific gene (TGME49_243940). Immunofluorescence analysis of individual vacuoles upon MORC depletion, with a co-staining using a bradyzoite marker (BCLA, green) or a merozoite marker (red, TGME49_243940-mCherry). h, the differential expression of the two markers was assessed by counting the number of vacuoles (n= 100) labeling one or the other markers or both, over a time course. Experiments in b, d, f and g were conducted more than three times and representative images are displayed. Scale bars, 10 μm for b and g and 5 μm for d and f.
Fig. 6
Fig. 6. MORC guides developmental trajectories by employing downstream regulating pathways.
a, Heatmap showing mRNA hierarchical clustering analysis (Pearson correlation) of AP2 transcription factors shown to be regulated by MORC depletion. The abundance of their transcripts in the various stages of development, namely tachyzoite, bradyzoite/cyst, merozoite, enteroepithelial stages (EES) and oocyst stages is displayed. The color scale bar indicates log2 fold changes. The AP2 factors were color coded correspondingly with the color of the life stage during which they are the most expressed. b, IFA of HFF infected with parasites harboring an endogenously FLAG tagged merozoite-specific AP2IV-3 within the lineage RH MORC-mAID-HA. Fixed and permeabilized parasites were probed with FLAG (red) and Hoechst DNA-specific dye (blue). Scale bar, 10 μm. The experiment was conducted more than three times and representative images are displayed. c, Heatmap showing mRNA hierarchical clustering analysis (Pearson correlation) of selected MORC-regulated genes through different strain/induction combinations. The presented genes belong to the set predefined as exclusively expressed in tachyzoites and repressed in merozoites. The color scale bar indicates log2 fold changes. d, Genome-wide H4K31me1 enrichment profiles at cluster 1 genes in Pru MORC KD left UT and treated with IAA for 30 hours. e, Average nucleosome occupancy plotted based on the relative distance to the nearest annotated ATG, using Danpos250 to define the most likely position of nucleosomes. Nucleosomes occupancy at all T. gondii genes (on top) or on the MORC-regulated cluster 1 genes (in bottom) in the context of MORC depletion are shown. f, Density profiles are displayed at the merozoite-specific TGME49_238915 gene. MORC’s and HDAC3’s occupancies, the H4K31 methylation enrichment, the corresponding transcript level (black), are all displayed before and after MORC’s depletion. Similarly, the surrounding nucleosome occupancy and distribution (in purple) are displayed based on the MNase-seq data that were conducted before and after MORC degradation. Chromosomal positions are indicated on x-axis. The experiment was repeated independently twice with similar results. g, A proposed model describing the mechanism underlying the MORC complex-mediated modulations of the T. gondii life cycle.

Comment in

  • Mastering Toxoplasma sex and sleep.
    Sullivan WJ Jr. Sullivan WJ Jr. Nat Microbiol. 2020 Apr;5(4):533-534. doi: 10.1038/s41564-020-0696-y. Nat Microbiol. 2020. PMID: 32218508 No abstract available.

References

    1. Dubey JP, Lindsay DS, Speer CA. Structures of Toxoplasma gondii Tachyzoites, Bradyzoites, and Sporozoites and Biology and Development of Tissue Cysts. Clin Microbiol Rev. 1998;11:267–299. - PMC - PubMed
    1. Balaji S. Discovery of the principal specific transcription factors of Apicomplexa and their implication for the evolution of the AP2-integrase DNA binding domains. Nucleic Acids Research. 2005;33:3994–4006. - PMC - PubMed
    1. Kim K. The Epigenome, Cell Cycle, and Development in Toxoplasma. 2018:21. - PubMed
    1. Saksouk N, et al. Histone-modifying complexes regulate gene expression pertinent to the differentiation of the protozoan parasite Toxoplasma gondii. Mol Cell Biol. 2005;25:10301–10314. - PMC - PubMed
    1. Bougdour A, et al. Drug inhibition of HDAC3 and epigenetic control of differentiation in Apicomplexa parasites. J Exp Med. 2009;206:953–966. - PMC - PubMed

Publication types

MeSH terms