. 2020 Apr;38(4):460-470.
doi: 10.1038/s41587-020-0430-6. Epub 2020 Feb 24.

Targeting the cytoskeleton to direct pancreatic differentiation of human pluripotent stem cells

Affiliations

Targeting the cytoskeleton to direct pancreatic differentiation of human pluripotent stem cells

Nathaniel J Hogrebe et al. Nat Biotechnol. 2020 Apr.

Abstract

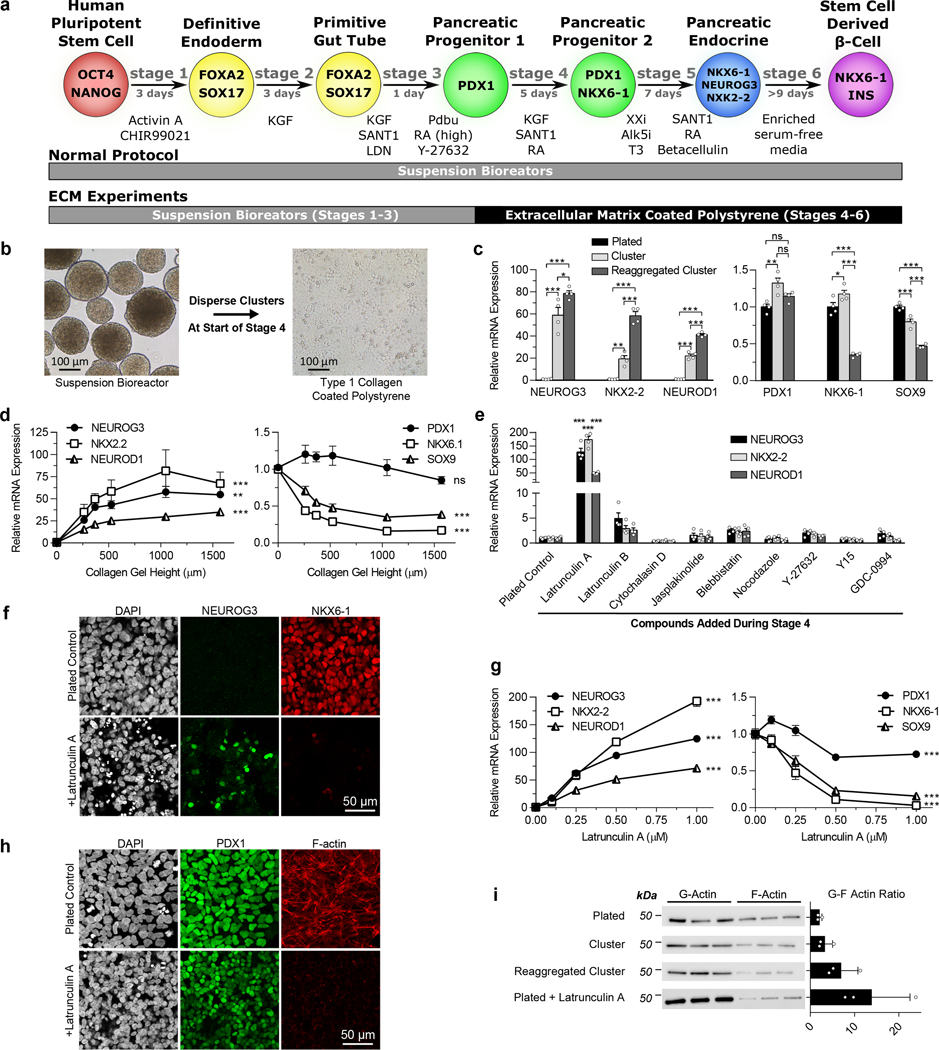
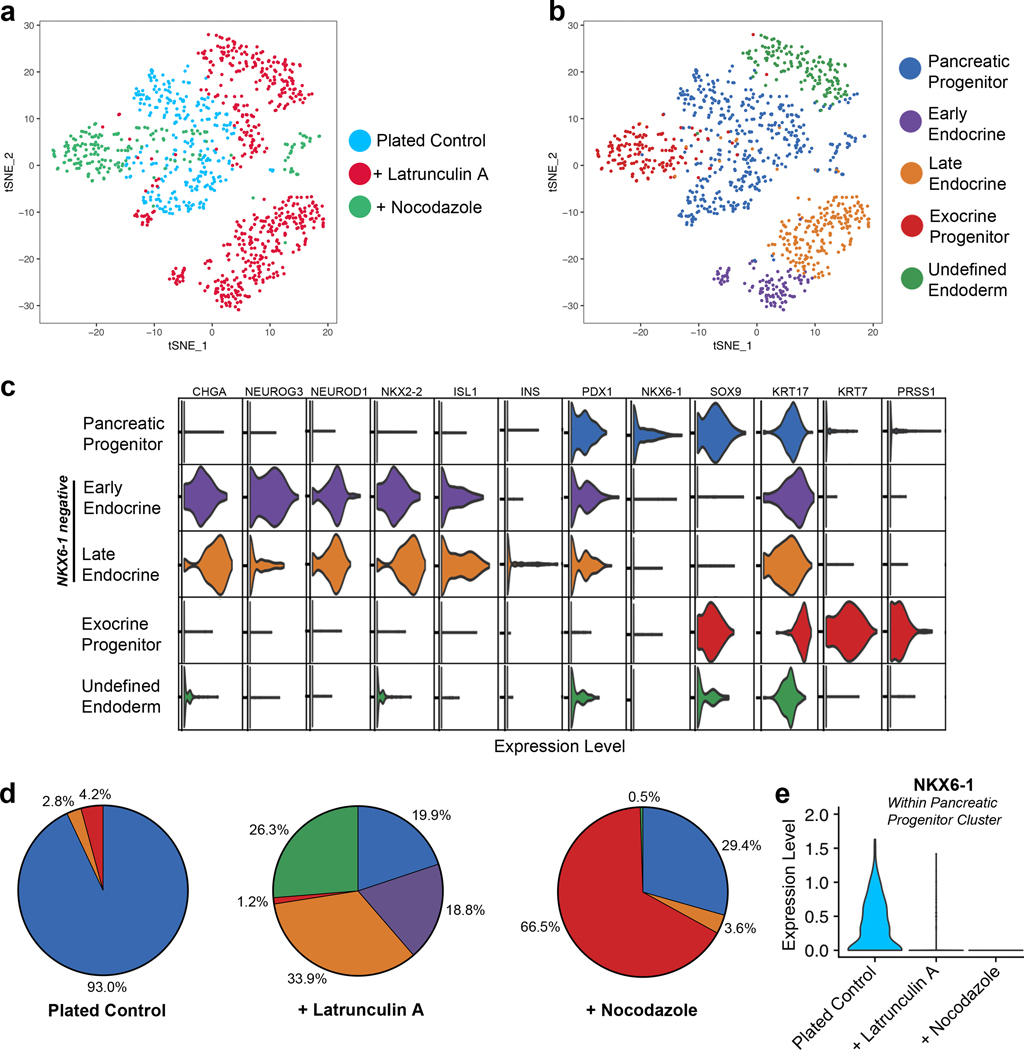
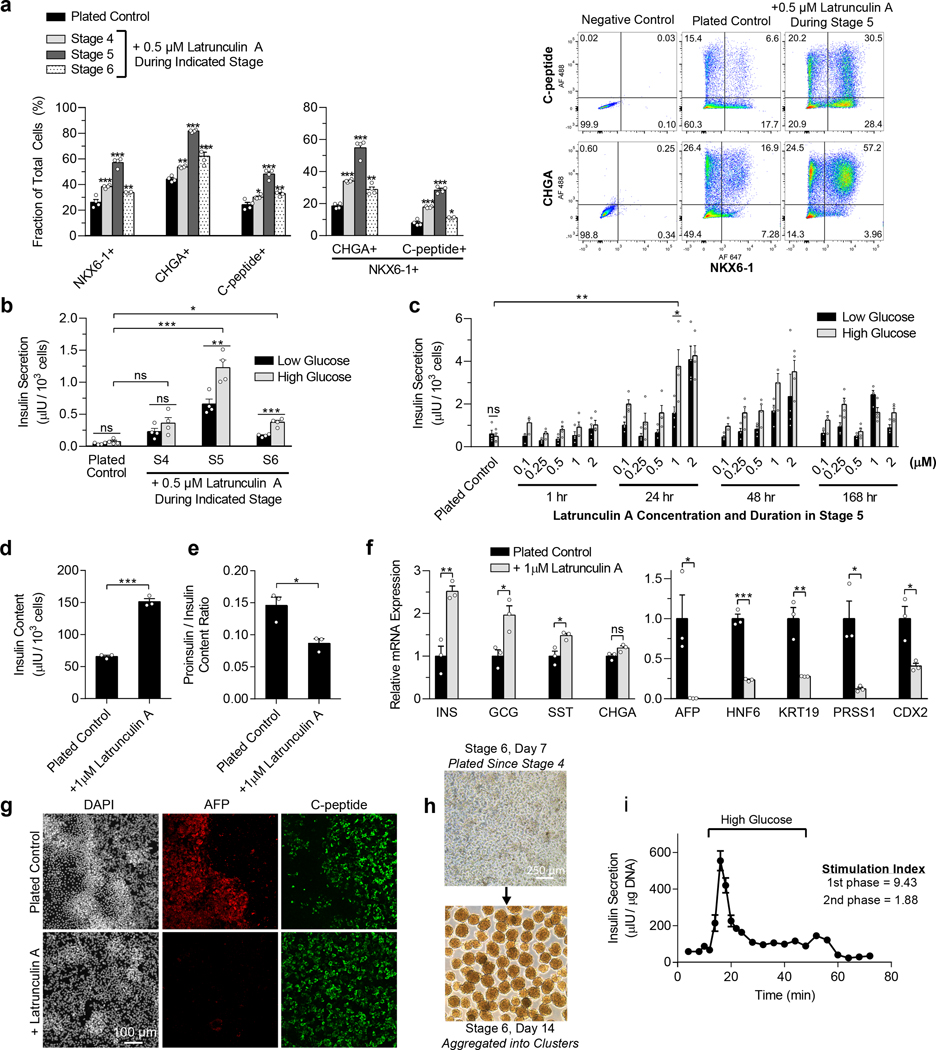
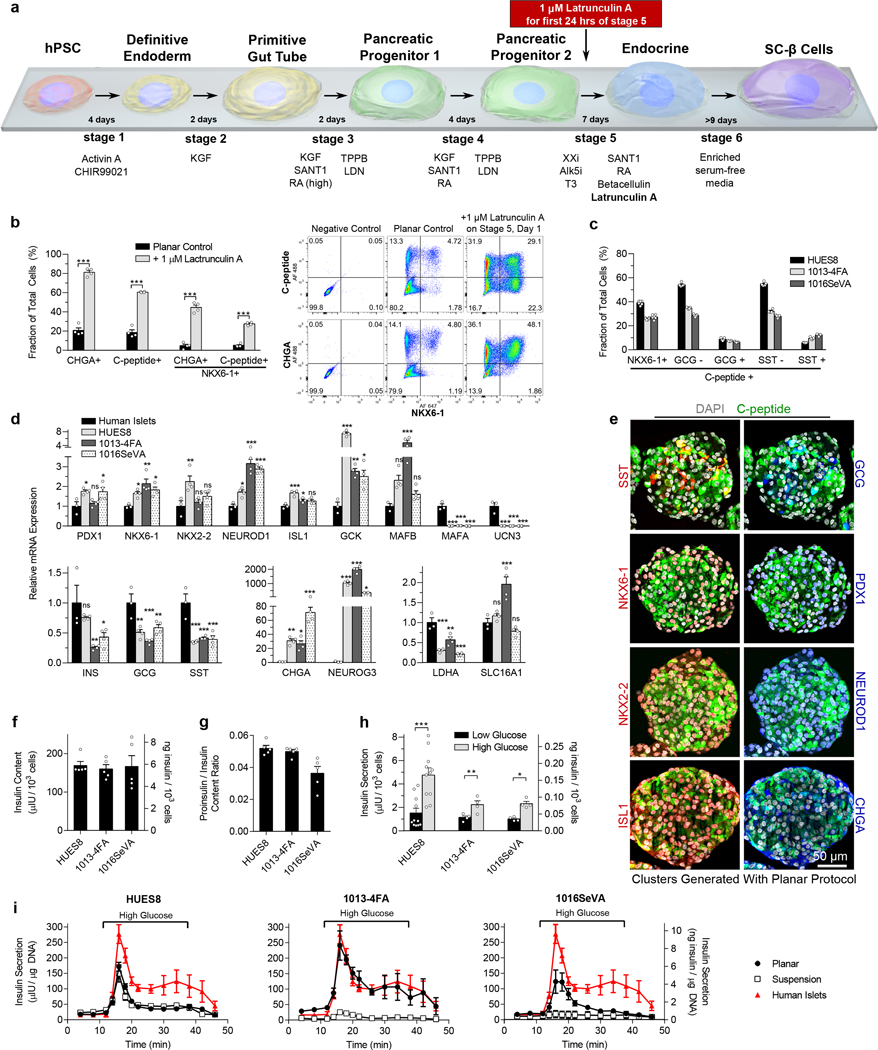
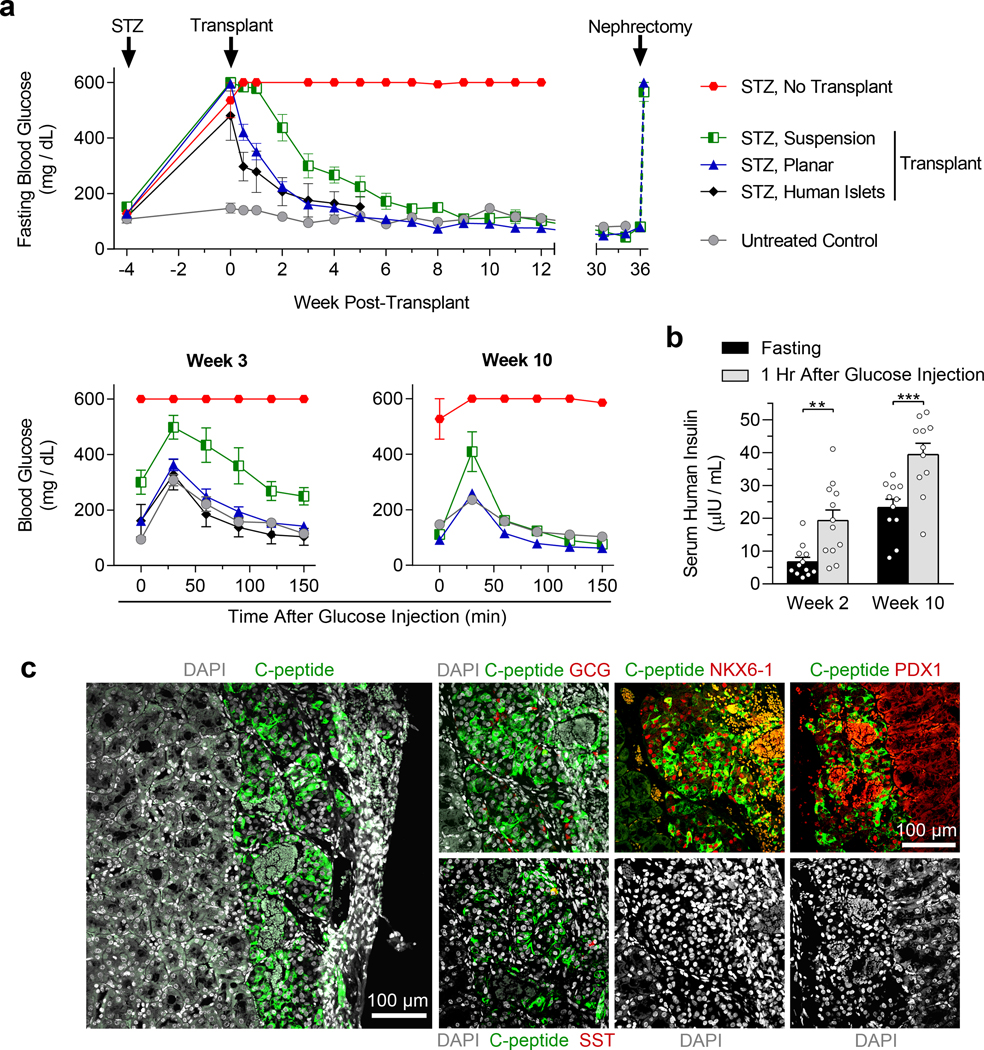
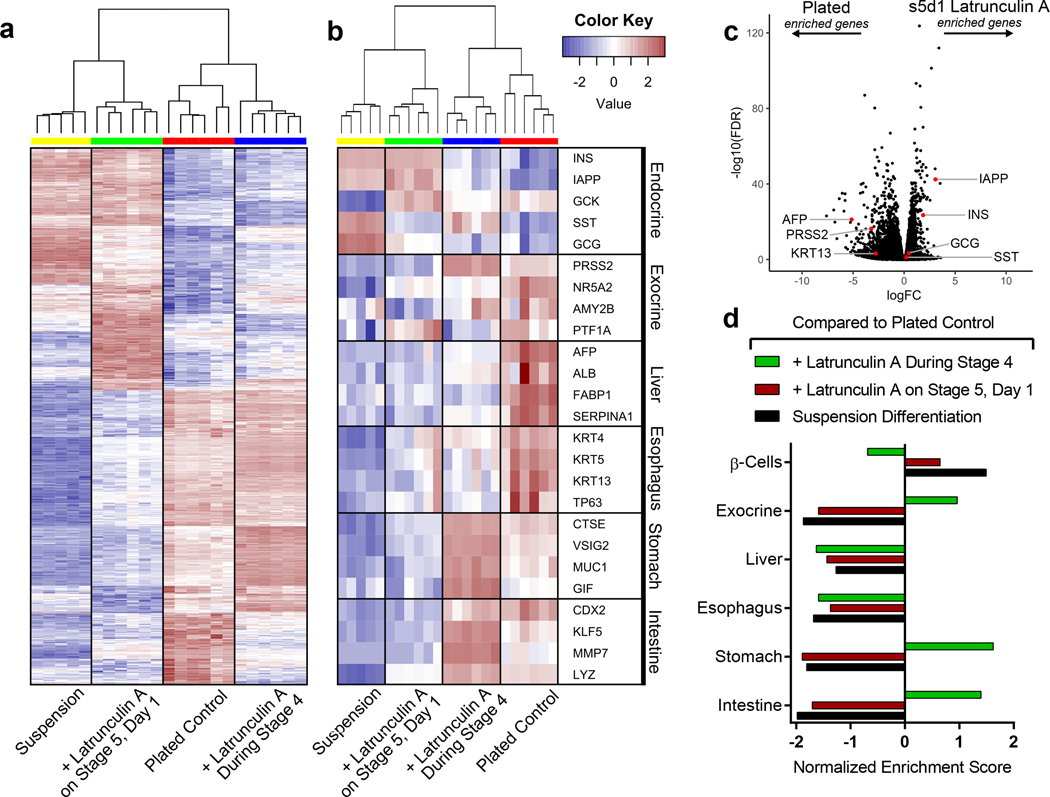
Generation of pancreatic β cells from human pluripotent stem cells (hPSCs) holds promise as a cell replacement therapy for diabetes. In this study, we establish a link between the state of the actin cytoskeleton and the expression of pancreatic transcription factors that drive pancreatic lineage specification. Bulk and single-cell RNA sequencing demonstrated that different degrees of actin polymerization biased cells toward various endodermal lineages and that conditions favoring a polymerized cytoskeleton strongly inhibited neurogenin 3-induced endocrine differentiation. Using latrunculin A to depolymerize the cytoskeleton during endocrine induction, we developed a two-dimensional differentiation protocol for generating human pluripotent stem-cell-derived β (SC-β) cells with improved in vitro and in vivo function. SC-β cells differentiated from four hPSC lines exhibited first- and second-phase dynamic glucose-stimulated insulin secretion. Transplantation of islet-sized aggregates of these cells rapidly reversed severe preexisting diabetes in mice at a rate close to that of human islets and maintained normoglycemia for at least 9 months.


Figures

Figure 1.
Figure 1.. The state of the cytoskeleton controls expression of the transcription factors NEUROG3 and NKX6–1 in pancreatic progenitors.
(a) Schematic of the differentiation protocol used for suspension differentiations and plate down studies. (b) Images of clusters at the beginning of stage 4 dispersed and plated onto ECM-coated TCP for the remainder of the protocol. Scale bar = 100 μm. (c) qRT-PCR of pancreatic genes at the end of stage 4 of cells plated on collagen I at the beginning of stage 4 compared to regular suspension clusters or clusters reaggregated after dispersion (Tukey’s HSD test, n = 4). (d) qRT-PCR of pancreatic genes at the end of stage 4 of cells plated on collagen I gels of varying heights at the beginning of stage 4. Increasing the height of collagen I gels fixed to TCP correlates with decreasing the effective stiffness experienced by cells (ANOVA, n = 4). (e) qRT-PCR of plated stage 4 cells treated with some commonly used cytoskeletal-modulating compounds to identify latrunculin A as a potent endocrine inducer (Dunnett’s multiple comparisons test, n = 4). (f) Immunostaining of plated cells at the end of stage 4 demonstrating that a 1 μM latrunculin A treatment increased NEUROG3+ cells and decreased NKX6–1+ cells when administered during stage 4. Scale bar = 50 μm. (g) Latrunculin A dose response of pancreatic gene expression added during stage 4 measured with qRT-PCR (ANOVA, n = 4). (h) Immunostaining of plated stage 4 cells treated for 24 hours with 1 μM latrunculin A, demonstrating depolymerization of F-actin but maintenance of PDX1 expression. (i) Western blot quantification of the G/F actin ratio within cells under different culture formats and treated with latrunculin A (n = 3). All data was generated with HUES8. All data is represented as the mean, and all error bars represent SEM. Individual data points are shown for all bar graphs. ns = not significant, * = p < 0.05, ** = p < 0.01, *** = p < 0.001.
Figure 2.
Figure 2.. Single-cell RNA sequencing demonstrates that cytoskeletal state directs pancreatic progenitor fate.
(a-b) tSNE projections of single-cell RNA sequencing performed on plated stage 4 cells either untreated (n = 286 cells), treated with 0.5 μM latrunculin A (n = 579 cells), or treated with 5 μM nocodazole (n = 197 cells). Unsupervised clustering of the combined cell population from all three conditions revealed five separate clusters. (c) Violin plots indicating the relative expression of important pancreatic genes in each cluster. (d) The percentage of cells from the indicated treatment condition that were within each of the five clusters. (e) Violin plot of NKX6–1 expression within the pancreatic progenitor cluster. All data was generated with HUES8.
Figure 3.
Figure 3.. Latrunculin A treatment during stage 5 increases the efficiency of SC-β cell specification of plated pancreatic progenitors.
(a) Flow cytometry two weeks into stage 6 for NKX6–1, CHGA, and C-peptide of plated cells as per Fig. 1a, untreated or treated with 0.5 μM latrunculin A throughout stage 4, 5, or 6 (Dunnett’s multiple comparisons test, n = 4). (b) Static GSIS two weeks into stage 6 of plated cells, untreated or treated with 0.5 μM latrunculin A throughout stage 4, 5, or 6 (paired two-sided t-test compares between low and high glucose for a particular sample, Dunnett’s test compares insulin secretion at high glucose to the control, n = 4). (c) Optimization of latrunculin A concentration and timing during stage 5 for plated cells. Static GSIS was performed after 2 weeks of stage 6 (paired two-sided t-test compares low and high glucose, unpaired two-sided t-test compares high glucose of plated control and 24 hour 1 μM latrunculin A treatment, n = 4). (d) Insulin content of plated cells two weeks into stage 6, untreated or treated 24 hours with 1μM latrunculin A on the first day of stage 5 (unpaired two-sided t-tests, n = 3). (e) Proinsulin/insulin ratio of plated cells two weeks into stage 6, untreated or treated for 24 hours on the first day of stage 5 with 1 μM latrunculin A (unpaired two-sided t-tests, n = 3). (f) qRT-PCR measuring endocrine (left) and non-endocrine (right) gene expression of plated cells two weeks into stage 6, untreated or treated for 24 hours on the first day of stage 5 with 1 μM latrunculin A (unpaired two-sided t-tests, n = 3). (g) Immunostaining for AFP and c-peptide of plated cells two weeks into stage 6, untreated or treated for 24 hours on the first day of stage 5 with 1 μM latrunculin A. Scale bar = 100 μm. (h) Images of aggregating plated cells after one week in stage 6. Scale bar = 250 μm. (i) Dynamic glucose-stimulated insulin secretion of stage 6 cells exhibiting first and second phase insulin release (n = 3). All data was generated with HUES8. All data is represented as the mean, and all error bars represent SEM. Individual data points are shown for all bar graphs. ns = not significant, * = p < 0.05, ** = p < 0.01, *** = p < 0.001.
Figure 4.
Figure 4.. SC-β cells differentiated with the new planar protocol express β cell markers and function in vitro.
(a) Schematic of the new planar protocol for making SC-β cells incorporating a 1 μM latrunculin A treatment for the first 24 hour of stage 5. The cells were plated onto Matrigel-coated TCP throughout this differentiation process. (b) Flow cytometry after one week in stage 6 of planar cells from HUES8 with and without stage 5 latrunculin A treatment measuring endocrine induction (CHGA+) and SC-β cell specification (C-peptide+/NKX6–1+) (unpaired two-sided t-tests, n = 4). (c) Flow cytometry of islet and SC-β cells markers for stage 6 cells differentiated from HUES8, 1013–4FA, and 1016SeVA hPSC lines after being aggregated into clusters for one week (n = 4). (d) qRT-PCR of islet and disallowed (LDHA, SLC16A1) genes for stage 6 cells and human islets (Dunnett’s multiple comparisons test, n = 4 for SC-β cells, n = 3 for human islets). (e) Immunostaining of aggregated planar stage 6 cells from HUES8. (f) Insulin content of planar stage 6 cells (n = 4). (g) Proinsulin/insulin content ratio for planar stage 6 cells (n = 4). (h) Static GSIS for planar stage 6 cells (paired two-sided t-tests, n = 11 for HUES8, n = 4 for 1013–4FA and 1016SeVA). (i) Dynamic GSIS for planar stage 6 cells generated from HUES8 (n = 7), 1013–4FA (n = 3), and 1016SeVA (n = 4) compared with stage 6 cells generated with the suspension protocol (HUES8, n = 4; 1013–4FA, n = 4; 1016SeVA, n = 3) and with human islets (n = 4). Insulin units are shown in both μIU and ng. All data shown in this figure is of cells generated with the planar differentiation protocol unless otherwise noted. All data is represented as the mean, and all error bars represent SEM. Individual data points are shown for all bar graphs. ns = not significant, * = p < 0.05, ** = p < 0.01, *** = p < 0.001.
Figure 5.
Figure 5.. SC-β cells generated with the new planar protocol can rapidly cure pre-existing diabetes in mice.
(a) Diabetes was induced with STZ in a total of 30 mice. 4 weeks after injection, SC-β cells were transplanted underneath the kidney capsule of the mice (planar transplant, n = 12; suspension transplant, n = 6; human islet transplant, n = 5, no transplant, n = 7). Additionally, 5 non-STZ mice served as non-diabetic controls. Glucose tolerance tests were performed 3 and 10 weeks after transplantation. A nephrectomy was performed 36 weeks after transplantation on mice receiving planar and suspension SC-β cells. All STZ mice that did not receive a transplant died by week 29. (b) In vivo GSIS of mice receiving the planar SC-β cell transplants 2 and 10 weeks after transplantation measuring human insulin (paired two-sided t-tests, n = 12 for week 2, n = 11 for week 10). (c) Immunostaining of sectioned kidneys transplanted with SC-β cells generated with the planar protocol 3 weeks after transplantation showing endocrine cell markers. Scale bars = 100 μm. All data was generated with HUES8 using either the planar protocol outlined in Fig. 4a or the suspension protocol. All data is represented as the mean, and all error bars represent SEM. Individual data points are shown for all bar graphs. ns = not significant, * = p < 0.05, ** = p < 0.01, *** = p < 0.001.
Figure 6.
Figure 6.. The state of the cytoskeleton influences endodermal cell fate.
(a) Suspension (n = 5) and plated pancreatic progenitors differentiated to stage 6 as per Fig. 1a either untreated (n = 6), treated with 0.5 μM latrunculin A throughout stage 4 (n = 6), or treated with 1 μM latrunculin A for the first 24 hours of stage 5 (n = 6). Bulk RNA sequencing at two weeks into stage 6 was used to generate a heat map of the 1,000 most differentially expressed genes between the stage 5 latrunculin A treatment and plated control. (b) A heat map from bulk RNA sequencing of select genes from multiple endodermal lineages. (c) A volcano plot from bulk RNA sequencing data showing expression differences of select genes between untreated plated cells and stage 5 latrunculin A treated cells. (d) Gene enrichment analysis from bulk RNA sequencing of select gene sets from multiple endodermal lineages. All data was generated with HUES8.

Comment in

References

    1. Millman JR & Pagliuca FW Autologous pluripotent stem cell-derived β-like cells for diabetes cellular therapy. Diabetes 66, 1111–1120 (2017). - PubMed
    1. Tomei AA, Villa C & Ricordi C. Development of an encapsulated stem cell-based therapy for diabetes. Expert Opin. Biol. Ther 15, 1321–1336 (2015). - PMC - PubMed
    1. Jennings RE, Berry AA, Strutt JP, Gerrard DT & Hanley NA Human pancreas development. Development 142, 3126–3137 (2015). - PubMed
    1. Pagliuca FW et al. Generation of functional human pancreatic β cells in vitro. Cell 159, 428–439 (2014). - PMC - PubMed
    1. Velazco-Cruz L et al. Acquisition of Dynamic Function in Human Stem Cell-Derived β Cells. Stem Cell Reports 12, 351–365 (2019). - PMC - PubMed

Additional References

    1. Butler A, Hoffman P, Smibert P, Papalexi E & Satija R. Integrating single-cell transcriptomic data across different conditions, technologies, and species. Nat. Biotechnol. 36, 411–420 (2018). - PMC - PubMed
    1. McCarthy DJ, Chen Y & Smyth GK Differential expression analysis of multifactor RNA-Seq experiments with respect to biological variation. Nucleic Acids Res. 40, 4288–4297 (2012). - PMC - PubMed
    1. Robinson MD, McCarthy DJ & Smyth GK edgeR: A Bioconductor package for differential expression analysis of digital gene expression data. Bioinformatics 26, 139–140 (2009). - PMC - PubMed
    1. Subramanian A et al. Gene set enrichment analysis: a knowledge-based approach for interpreting genome-wide expression profiles. Proc. Natl. Acad. Sci. U. S. A. 102, 15545–50 (2005). - PMC - PubMed
    1. Mootha VK et al. PGC-1α-responsive genes involved in oxidative phosphorylation are coordinately downregulated in human diabetes. Nat. Genet. 34, 267–73 (2003). - PubMed

Publication types

MeSH terms