. 2020 Jul;17(7):427-450.
doi: 10.1038/s41569-020-0341-8. Epub 2020 Feb 24.

Clinical quantitative cardiac imaging for the assessment of myocardial ischaemia

Affiliations

Clinical quantitative cardiac imaging for the assessment of myocardial ischaemia

Marc Dewey et al. Nat Rev Cardiol. 2020 Jul.

Abstract

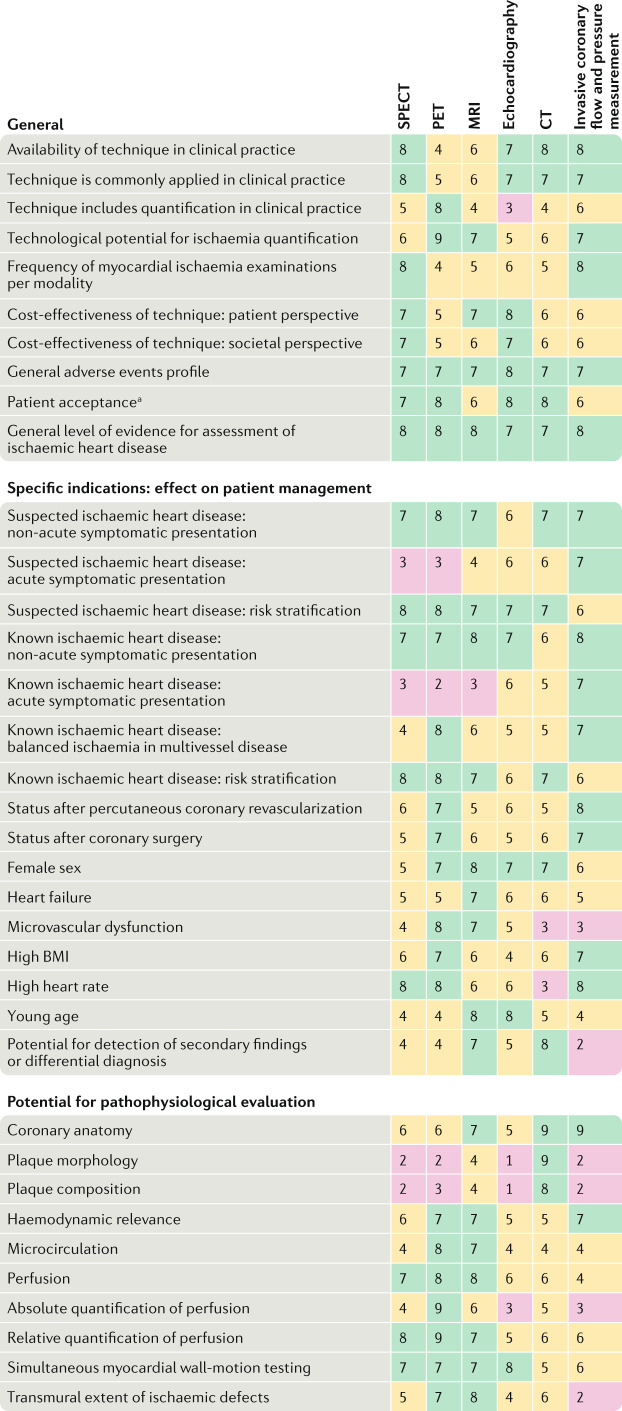
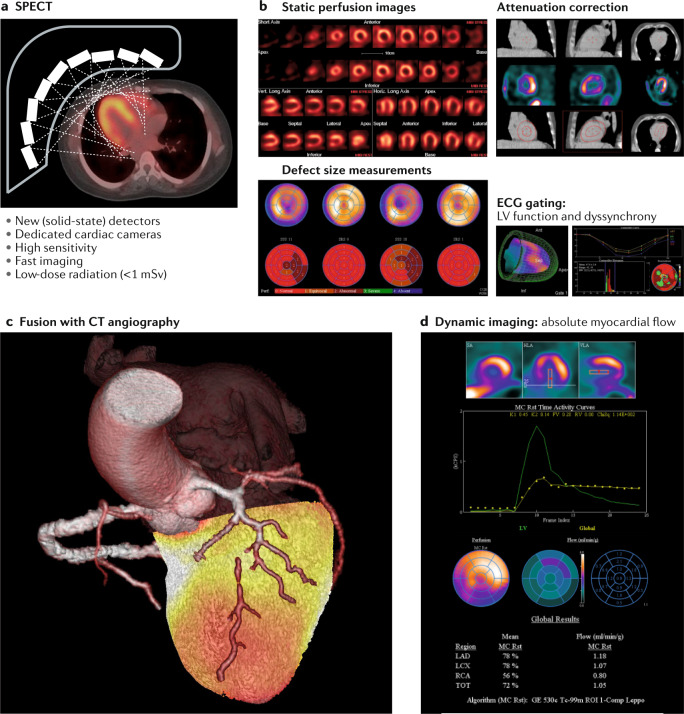
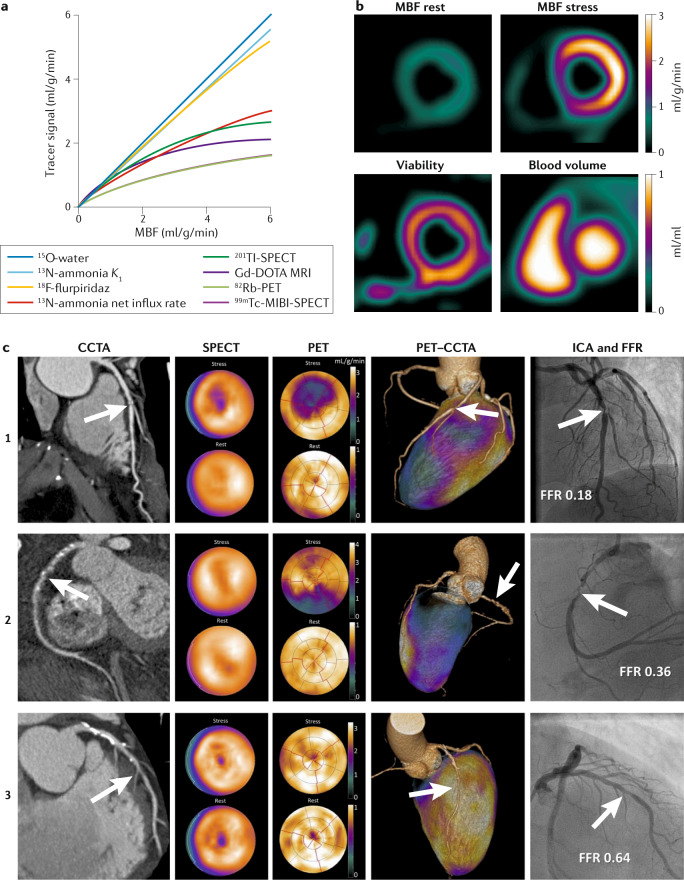
Cardiac imaging has a pivotal role in the prevention, diagnosis and treatment of ischaemic heart disease. SPECT is most commonly used for clinical myocardial perfusion imaging, whereas PET is the clinical reference standard for the quantification of myocardial perfusion. MRI does not involve exposure to ionizing radiation, similar to echocardiography, which can be performed at the bedside. CT perfusion imaging is not frequently used but CT offers coronary angiography data, and invasive catheter-based methods can measure coronary flow and pressure. Technical improvements to the quantification of pathophysiological parameters of myocardial ischaemia can be achieved. Clinical consensus recommendations on the appropriateness of each technique were derived following a European quantitative cardiac imaging meeting and using a real-time Delphi process. SPECT using new detectors allows the quantification of myocardial blood flow and is now also suited to patients with a high BMI. PET is well suited to patients with multivessel disease to confirm or exclude balanced ischaemia. MRI allows the evaluation of patients with complex disease who would benefit from imaging of function and fibrosis in addition to perfusion. Echocardiography remains the preferred technique for assessing ischaemia in bedside situations, whereas CT has the greatest value for combined quantification of stenosis and characterization of atherosclerosis in relation to myocardial ischaemia. In patients with a high probability of needing invasive treatment, invasive coronary flow and pressure measurement is well suited to guide treatment decisions. In this Consensus Statement, we summarize the strengths and weaknesses as well as the future technological potential of each imaging modality.


Conflict of interest statement

M.D. reports grants from the German Research Foundation’s (DFG) Heisenberg Program for the first Quantitative Cardiac Imaging meeting and Consensus Statement on quantitative assessment of myocardial ischaemia. M.D. reports further grant support from the Berlin Institute of Health’s Digital Health Accelerator program; F.M. is partially employed through this program. Institutional master research agreement grants with Siemens Healthineers, Philips Medical Systems and Canon Medical Systems exist at Charité, which are handled by the legal department. M.D. reports grants from the FP7 Program of the European Commission for the DISCHARGE project, grants from DFG and the German Ministry of Education and Research (BMBF) for individual patient data meta-analyses on cardiac imaging, honoraria for speaking from Bayer, Canon, Cardiac MR Academy Berlin and Guerbet, royalties as an editor of Cardiac CT published by Springer, and organization of Charité hands-on courses on cardiac CT imaging. M.D. and T.S. are also principal investigators of the BIOQIC graduate programme at Charité, which is funded by the DFG; A.K. is a PhD student in this graduate programme. M.S. received institutional support from the University of Texas Health Science Center at Houston for the DEFINE-FLOW project (NCT02328820). W.B. is supported by the SmartHeart EPSRC Program Grant (EP/P001009/1). T.S and A.C. report grant support from the EMPIR project 15HLT05 PerfusImaging. F.B. reports grant support and speaker honoraria from GE Healthcare and Siemens AG. S.N. receives research funding from the DFG, Horizon2020 and Siemens Healthineers. M.L. is supported by grants and speaker honoraria from GE Healthcare and is a co-founder of MedTrace Pharma AS. M.-X.T. reports grant support from the UK EPSRC (EP/M011933/1) and the British Heart Foundation (PG/16/95/32350). J.J.P. and T.v.d.H. report serving as speakers at educational events organized by Boston Scientific, Philips-Volcano and St. Jude Medical (now Abbott Vascular), which are manufacturers of sensor-equipped guide wires. J.M. and L.S. report grants from the BMBF (01EO1504, 01EO1504) and Siemens Healthineers, Germany. The other authors declare no competing interests.

Figures

Fig. 1
Fig. 1. Interaction between coronary anatomy and physiology in relation to tracer distribution.
a | Coronary arteries (left panel) penetrating the myocardium at the mid-ventricular level in a 3-mm-thick transverse section, as reconstructed from a 3D stack of cryomicrotome images. The middle panel shows a magnified portion of the transmural microvascular network, as indicated by the red square in the left panel. Terminal arterioles perfusing the capillary bed are shown in the right panel. b | 3D reconstruction of coronary arteries and arterioles perfusing the heart muscle. c | Schematic illustration of the coronary pressure–flow relationship. Autoregulation maintains coronary flow at rest (green line) over a wide pressure range at a level adapted to oxygen consumption, whereas maximal flow without control (blue line) depends on coronary perfusion pressure. The zero-flow intercept incorporates collateral flow and depends on heart rate and ventricular wall tension. In unobstructed vessels (black dashed line), flow increases with only negligible pressure loss at maximal vasodilatation. An epicardial stenosis induces progressive pressure loss with increasing flow (red dashed lines; stenosis severity increasing from top to bottom) and thereby raises minimal microvascular resistance. Stenosis resistance can be compensated at rest by lowering arterial tone, but limits maximal flow and compromises coronary flow reserve. d | Bolus-based perfusion methods such as MRI and CT typically obtain the arterial input function (AIF) from an easily visible anatomical region, such as the left ventricle (AIFLV). When tracer is transported along the epicardial vessels, the duration of the bolus increases (bolus dispersion). The upper part of the panel depicts a simulation of computational fluid dynamics that affect a vessel similar to that within the dashed rectangular region in part b. Here, the assumption of a DOTA chelate-based tracer is made, which is injected quickly. For visualization purposes, simulations for the upper panel were made with a bolus 100 times shorter than that typically used in patients. See Supplementary Videos 1 and 2 for the dynamics. The lower panel shows the results from simulations of a real bolus, as used in humans. Similar bolus dispersion effects are expected for other tracers, depending on their diffusivity. The lower panel demonstrates that different regions (outlets 1–4) are exposed to slightly different AIFs (colours denote the different outlets in the upper part of the panel). If the observed bolus dispersion effects are not accounted for, a systematic underestimation of myocardial blood flow (MBF) of up to 45% can occur at rest, even in normal epicardial vessels without a stenosis. The tissue curve is a typical concentration–time curve of the amount of tracer contained within a region of interest. For better visualization, the curve is scaled in amplitude by a factor of ten. The duration and shape of the curves depend on MBF. Tracer kinetic modelling of curves incorporates the AIF and results in a quantitative MBF value for that region. e | Tracer bolus broadening in a stenosed vessel. In addition to the bolus broadening in the normal epicardial vasculature, a stenosis increases the resistance and further disturbs bolus transport. Both effects depend on the shape and location of the stenosis (arrows), which results in additional bolus broadening and underestimation of MBF. Pa, aortic pressure; Pb, extrapolated back pressure. Part e adapted with permission from ref., Wiley-VCH.
Fig. 2
Fig. 2. Clinical characteristics and appropriateness of myocardial ischaemia assessment tools for different patient scenarios.
Consensus ratings were on a scale of 1–9, with 1–3 being inappropriate, 4–6 being uncertain and 7–9 being appropriate. A total of 16 investigators participated. A Delphi clinical consensus process was used, with ratings by eight participants (four cardiologists, two radiologists, one nuclear medicine physician and one methodologist). A separate development team of eight investigators (one dual cardiologist–radiologist, two radiologists and five methodologists) defined the questions and categories shown in the table but did not participate in the clinical appropriateness rating. aStudies discussed during the meeting showed higher patient acceptance for CT than for SPECT, MRI or invasive testing.
Fig. 3
Fig. 3. SPECT for quantification of myocardial ischaemia.
a | Design of a new, dedicated cardiac SPECT camera with static solid-state detectors focused on the heart, with the major characteristics summarized below the image. b | Representative images of current state-of-the-art SPECT measurements, including static images along the cardiac axes (top left), polar maps and segmental scores for quantification of defect size (bottom left), quality-control screens for CT-based attenuation correction of SPECT images (top right) and volumetric information on left ventricular (LV) function and synchrony from electrocardiogram (ECG)-gated images (bottom right). c | Advanced methodology for 3D fusion of a SPECT dataset with coronary CT angiography, enabling localization of ischaemia to a coronary artery territory. This image shows anterior wall ischaemia resulting from chronic occlusion of the left anterior descending coronary artery. d | Advanced analysis of dynamic SPECT images for absolute quantification of myocardial blood flow, including region-of-interest placement for myocardium and blood pool (top), derivation of time–activity curves (middle) and parametric display of flow parameters derived from compartmental modelling (bottom), including correction for tracer-specific nonlinear flow and extraction (see Fig. 4a).
Fig. 4
Fig. 4. PET for quantification of myocardial ischaemia.
a | Tracer signal versus myocardial blood flow (MBF), showing a constant 100% extraction for 15O-water, an almost 100% extraction for 13N-ammonia K1 and 18F-flurpiridaz, and a substantial roll-off phenomenon, resulting in underestimation of MBF that increases with MBF, for 13N-ammonia (when quantified using its net influx rate), 201Tl-SPECT, Gd-DOTA dynamic contrast-enhanced (DCE) MRI, 82Rb and 99mTc-MIBI-SPECT,–. Note that the 82Rb and 99mTc curves overlap. b | MBF images at rest and during stress, myocardial viability and blood volume from a single rest–stress 15O-water protocol. This protocol can be used to assess ventricular volumes and ejection fraction. c | Example images from the PACIFIC trial showing coronary CT angiography (CCTA), SPECT, PET and invasive coronary angiography (ICA) images, with corresponding fractional flow reserve (FFR), in three patients (numbered 1–3) with coronary artery stenosis (arrows).
Fig. 5
Fig. 5. MRI for myocardial perfusion imaging.
a | Imaging, processing and data analysis approaches in myocardial perfusion MRI. Standard multislice 2D MRI perfusion imaging yields image time series of dynamic myocardial signal change (Myo) during contrast agent bolus passage, allowing qualitative assessment of perfusion on the basis of eye-balling of hypoenhancing tissue (upper row). For semiquantitative analysis, the slopes of the dynamic magnetic resonance (MR) signal change during contrast passage are compared with the reduced slopes indicating ischaemic tissue (middle row). Using integrated arterial input function (AIF) measurements, which capture signal changes in the aortic outflow tract, and after conversion of dynamic MR signal changes to gadolinium (Gd) contrast agent concentrations, quantitative perfusion assessment can be performed, providing myocardial blood flow (MBF) values in units of millilitres per gram per minute. In conjunction with 3D MRI perfusion imaging, dynamic whole-heart coverage without slice gaps is possible (lower row). b | Comparison of qualitative cardiovascular MR perfusion analysis versus SPECT, demonstrating improved diagnostic performance of cardiovascular MR (CMR) versus SPECT in 425 patients in the MR-IMPACT II trial (left panel). Comparison of quantitative multislice 2D MR perfusion analysis versus PET in 41 patients (middle panel) and in 21 patients (right panel) showing a significant correlation between the modalities and providing evidence of the clinical utility of quantitative MR perfusion imaging,. c | Gradientogram analysis allows the measurement of radial extent, temporal persistence, area, peak and average intensity as well as strength of the transmural perfusion gradient (left panels) for detection of obstructive coronary artery disease. Fractal analysis enables pathophysiological differentiation of epicardial disease and microvascular disease (arrows; right panels). d | Examples of fully quantitative high-resolution MRI perfusion maps. From left to right: example of an individual with normal stress perfusion, with homogeneous perfusion values ranging from 3 to 4 ml/g/min; example of a patient with angina, smooth epicardial coronary arteries and diffusely reduced stress perfusion values and more severely impaired subendocardial perfusion; and example of a patient with two-vessel coronary artery disease, with severe transmural impaired stress perfusion in the right and left circumflex coronary artery perfusion territories. Part b left panel adapted from ref., CC BY 2.0 (https://creativecommons.org/licenses/by/2.0/). Part b middle panel adapted with permission from ref., Elsevier. Part b right panel adapted from ref., CC BY 4.0 (https://creativecommons.org/licenses/by/4.0/). Part c left panels adapted with permission from ref., Wiley-VCH. Part d courtesy of C. Scannell, King’s College London, UK.
Fig. 6
Fig. 6. Contrast echocardiography for myocardial perfusion imaging.
a | Principle of destruction–replenishment imaging with the destruction pulse causing a flash in the image intensity at time zero. b | Time–intensity analysis in the region of interest shown as a dashed square in part a to derive estimates of myocardial blood flow (MBF). c | Clinical image showing multiple perfusion defects in the mid-septum, apex and right wall (arrows). d | An example of suboptimal image quality, which is an important challenge of echocardiography. Other important challenges include time-consuming, manual region-of-interest analysis and the limited acoustic window. e | An example of high frame rate contrast echocardiography acquired in the same patient as in part a, demonstrating its potential to improve image quality. MBFR, myocardial blood flow reserve.
Fig. 7
Fig. 7. CT for myocardial perfusion imaging.
a | CT angiography showing a coronary stenosis in the left anterior descending coronary artery (top left) and the corresponding anterior myocardial perfusion defect during adenosine stress (top right). Time attenuation curve (bottom left) and left ventricular polar map of absolute myocardial blood flow (bottom right). b | Photon-counting energy-selective X-ray detectors show promise in improving quantification of tissue densities in CT and increased contrast-to-noise ratio (compared with standard CT perfusion). c | Machine learning using convolutional deep neural networks can generate high-quality images from low-dose CT acquisition and reduce image artefacts. FWHM, full-width at half-maximum.
Fig. 8
Fig. 8. Invasive coronary flow and pressure measurement.
a | Representation of the ratio of resting distal coronary pressure (Pd) to aortic pressure (Pa), instantaneous wave-free ratio (iFR), fractional flow reserve (FFR) and coronary flow reserve (CFR) calculation from invasively assessed coronary pressure or flow measurement. b | Agreement between coronary pressure (FFR or iFR) and CFR measurement. Discordance between FFR and CFR occurs in 30–40% of individuals, whereas better agreement can be observed between iFR and CFR. c | Interpretation of combined FFR and CFR measurement and its effect on clinical outcome. Four main quadrants can be identified by the clinical cut-off values for FFR and CFR, indicated by the dashed lines. Patients in the upper right area (blue) have normal FFR and CFR; patients in the lower left area (red) have abnormal FFR and CFR; patients in the upper left area (orange) have abnormal FFR and normal CFR; and patients in the lower right area (green) have normal FFR and abnormal CFR, which indicates predominant microvascular involvement or diffuse coronary artery disease. Patients in the small dark green region in the lower right have an FFR close to 1 and an abnormal CFR, indicating sole involvement of the coronary microvasculature. The prognostic value of FFR and CFR in terms of major adverse cardiovascular events (MACE) is shown on the right. Part c adapted with permission from ref., van de Hoef, T. P. et al. Physiological basis and long-term clinical outcome of discordance between fractional flow reserve and coronary flow velocity reserve in coronary stenoses of intermediate severity. Circ. Cardiovasc. Interv. 7(3), 301–311 (https://www.ahajournals.org/journal/circinterventions).

References

    1. Montalescot G, et al. 2013 ESC guidelines on the management of stable coronary artery disease: the Task Force on the management of stable coronary artery disease of the European Society of Cardiology. Eur. Heart. J. 2013;34:2949–3003. - PubMed
    1. Fihn SD, et al. 2012 ACCF/AHA/ACP/AATS/PCNA/SCAI/STS guideline for the diagnosis and management of patients with stable ischemic heart disease: a report of the American College of Cardiology Foundation/American Heart Association Task Force on Practice Guidelines, and the American College of Physicians, American Association for Thoracic Surgery, Preventive Cardiovascular Nurses Association, Society for Cardiovascular Angiography and Interventions, and Society of Thoracic Surgeons. J. Am. Coll. Cardiol. 2012;60:e44–e164. - PubMed
    1. Hoffmann U, et al. ACR appropriateness criteria acute nonspecific chest pain-low probability of coronary artery disease. J. Am. Coll. Radiol. 2015;12:1266–1271. - PubMed
    1. Knuuti J, et al. 2019 ESC guidelines for the diagnosis and management of chronic coronary syndromes. Eur. Heart J. 2020;41:407–477. - PubMed
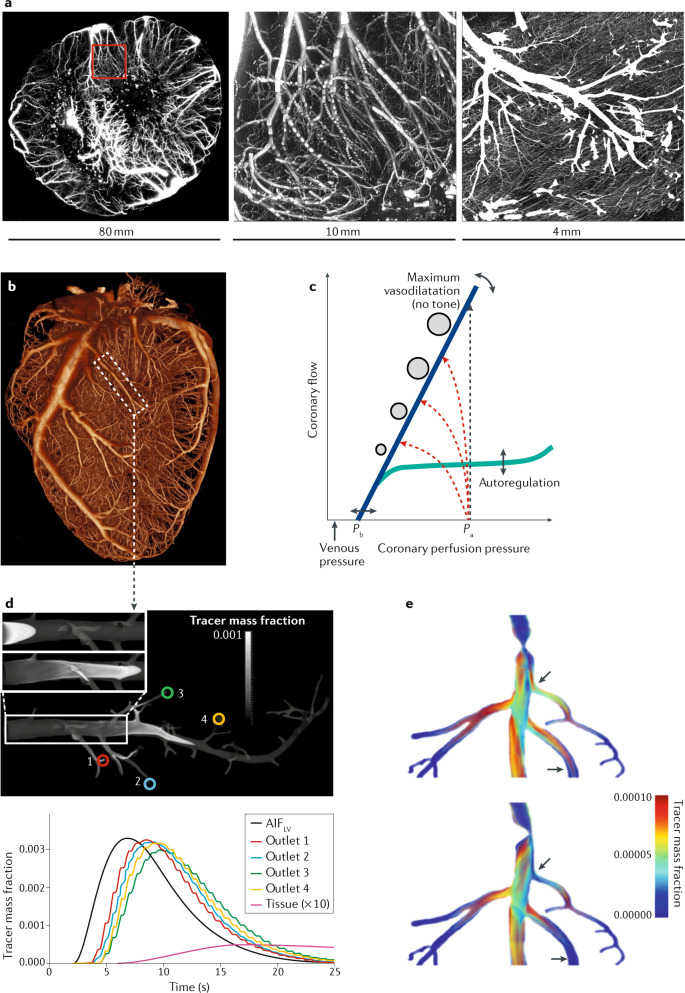
    1. van den Wijngaard JP, et al. 3D imaging of vascular networks for biophysical modeling of perfusion distribution within the heart. J. Biomech. 2013;46:229–239. - PubMed

Publication types

MeSH terms