. 2020 Mar;52(3):264-272.
doi: 10.1038/s41588-020-0581-x. Epub 2020 Feb 24.

Chromatin interaction analyses elucidate the roles of PRC2-bound silencers in mouse development

Affiliations

Chromatin interaction analyses elucidate the roles of PRC2-bound silencers in mouse development

Chew Yee Ngan et al. Nat Genet. 2020 Mar.

Abstract

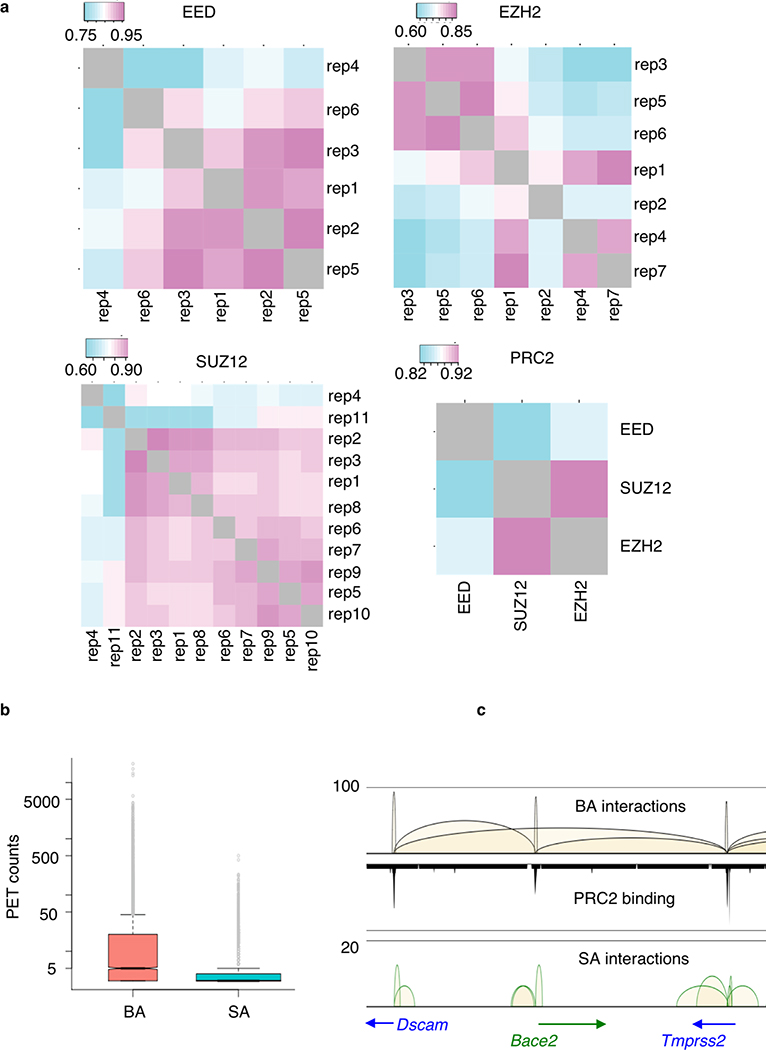
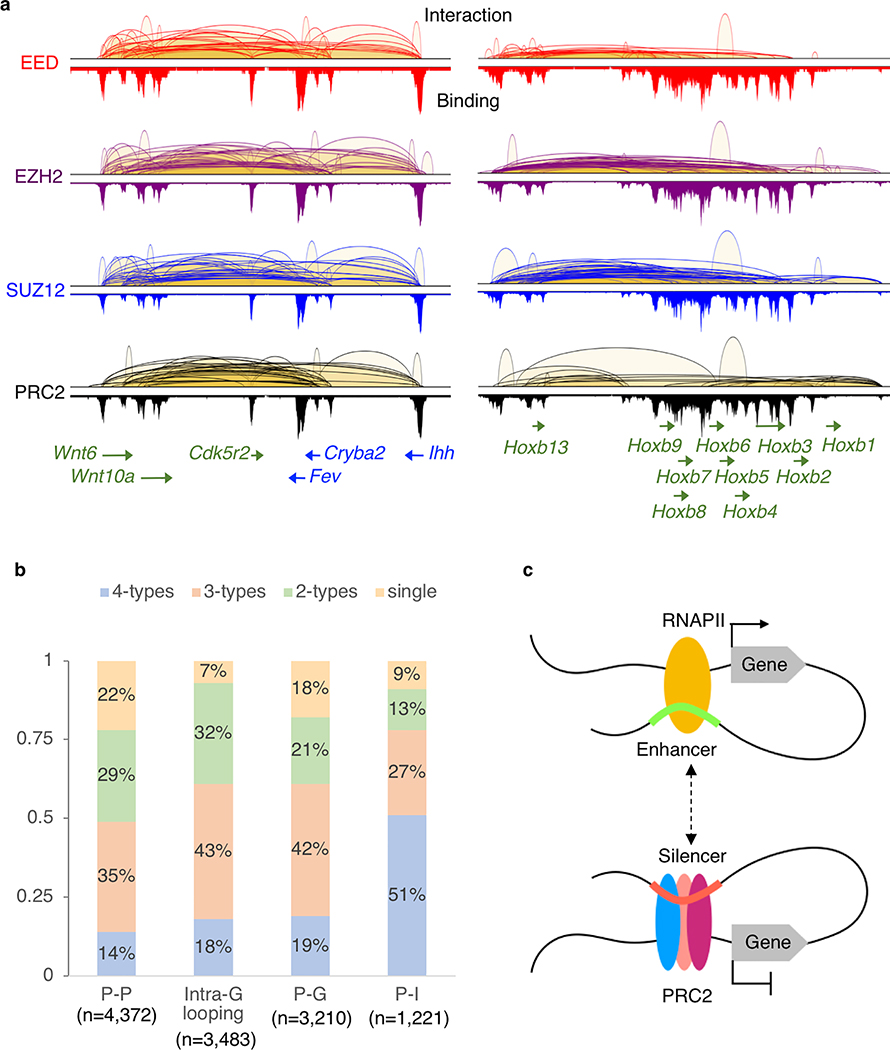
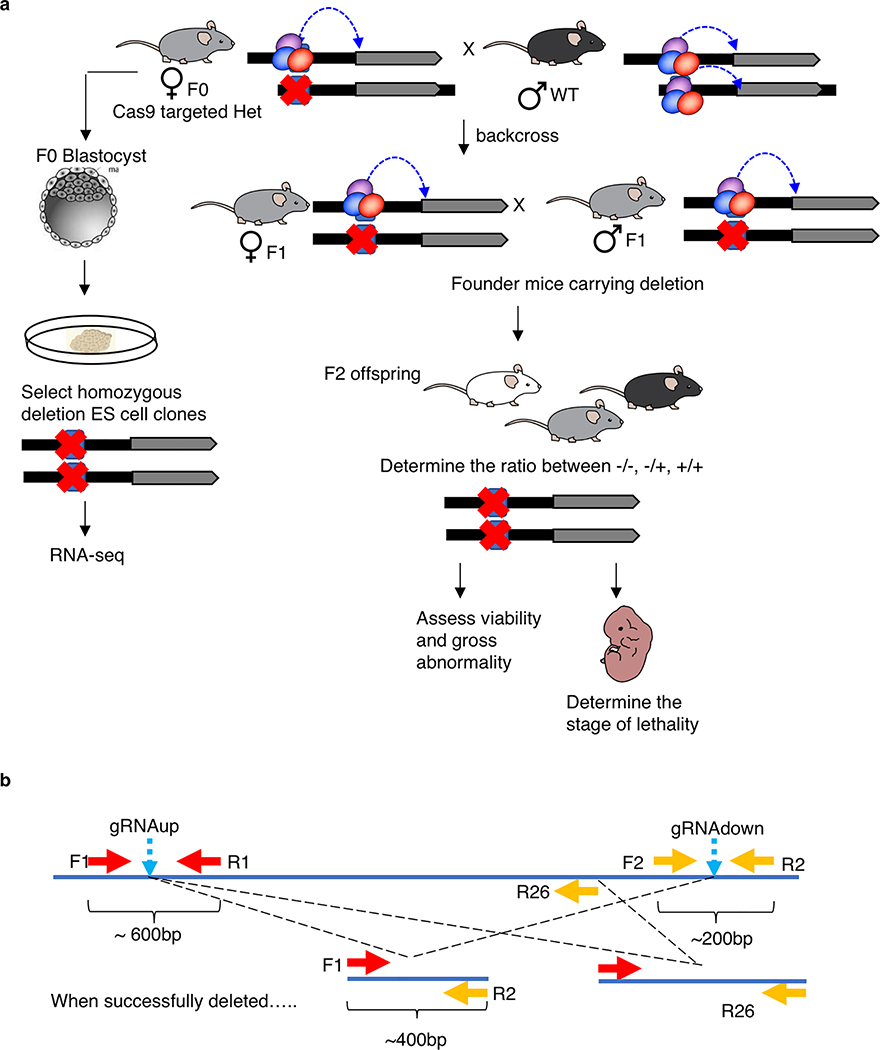
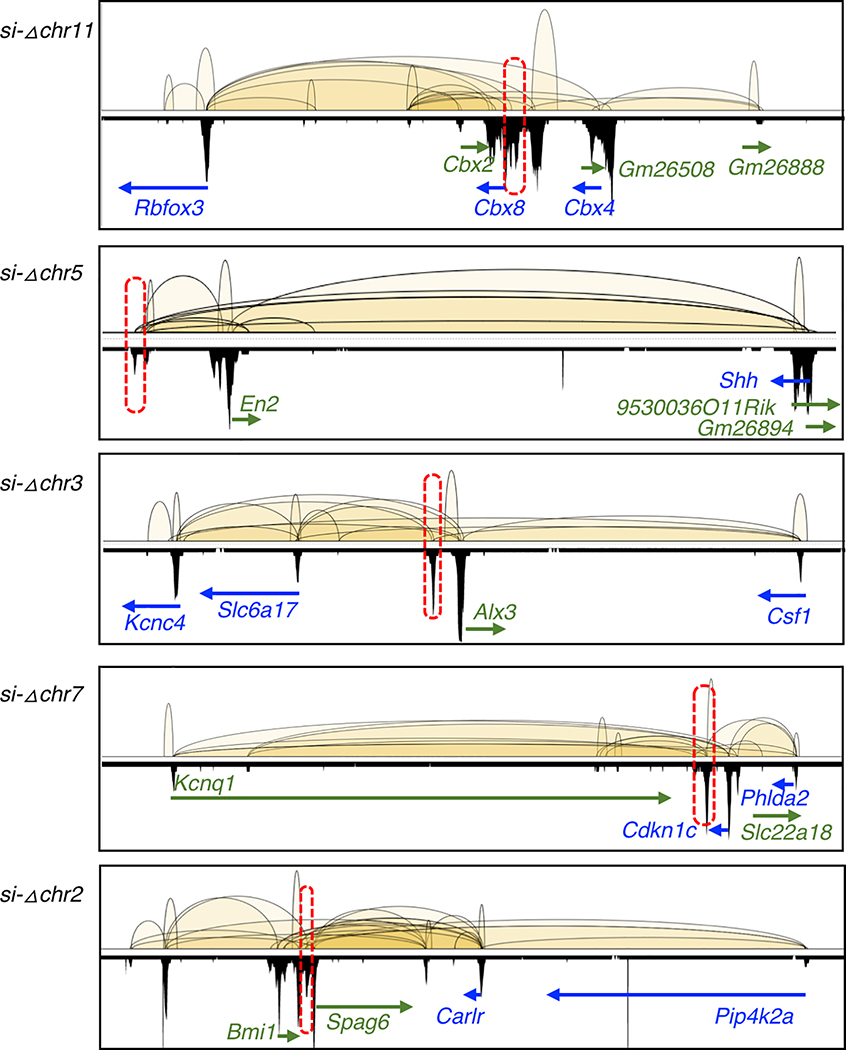
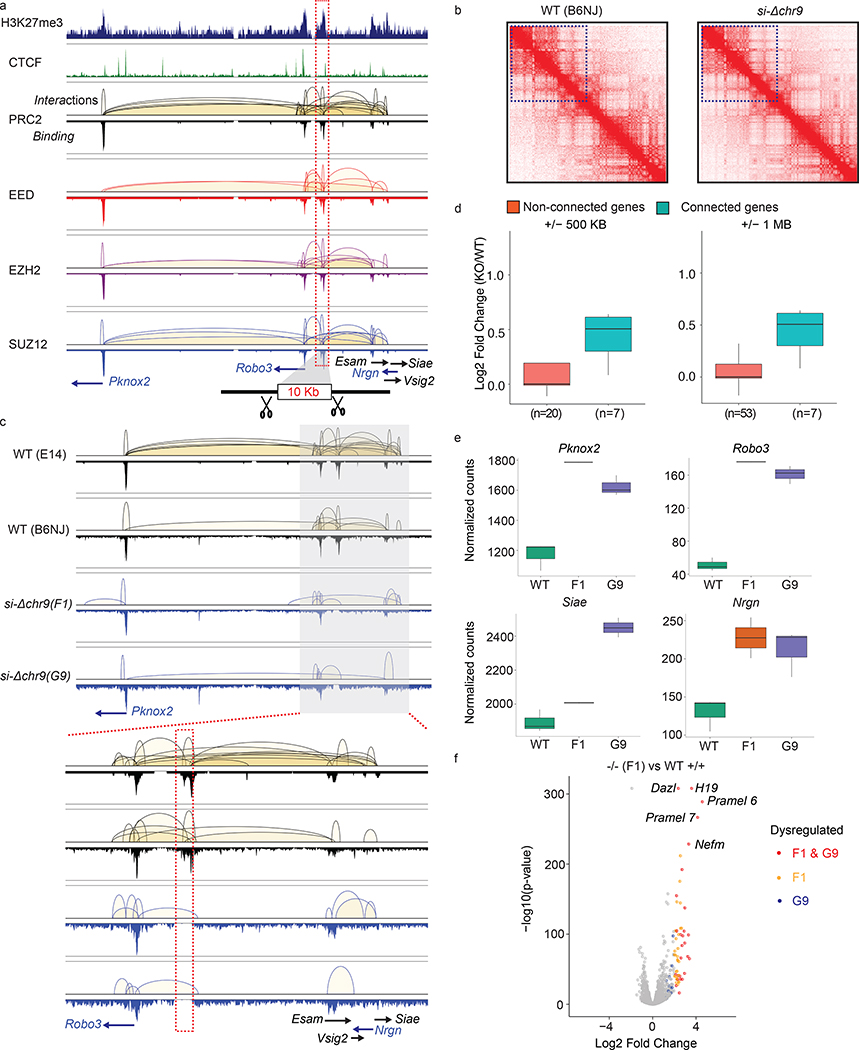
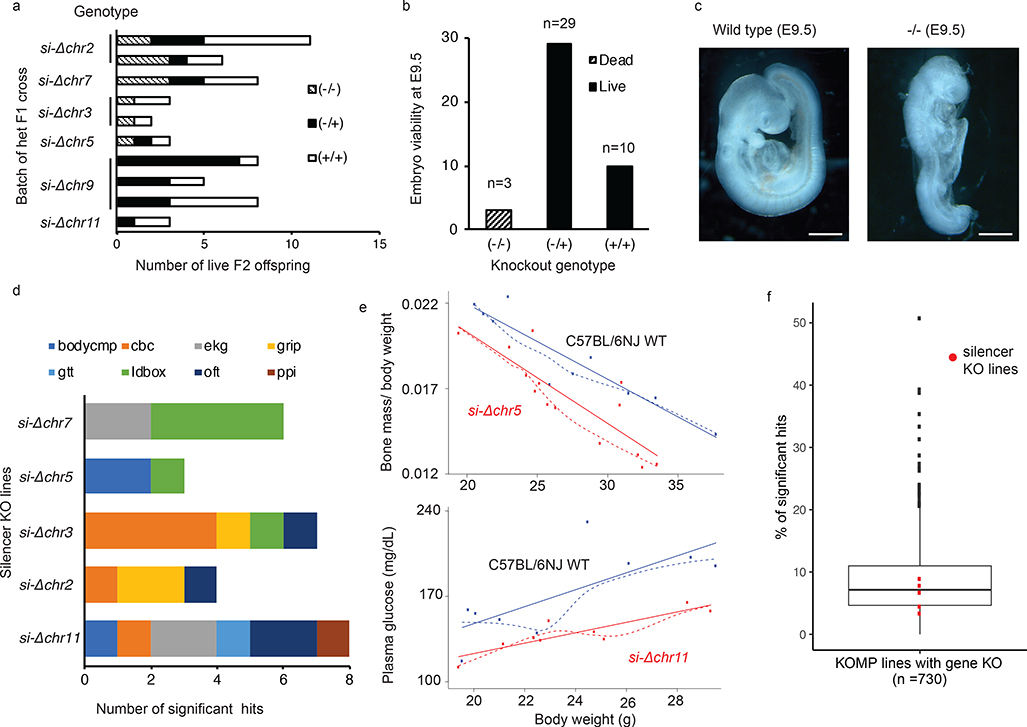
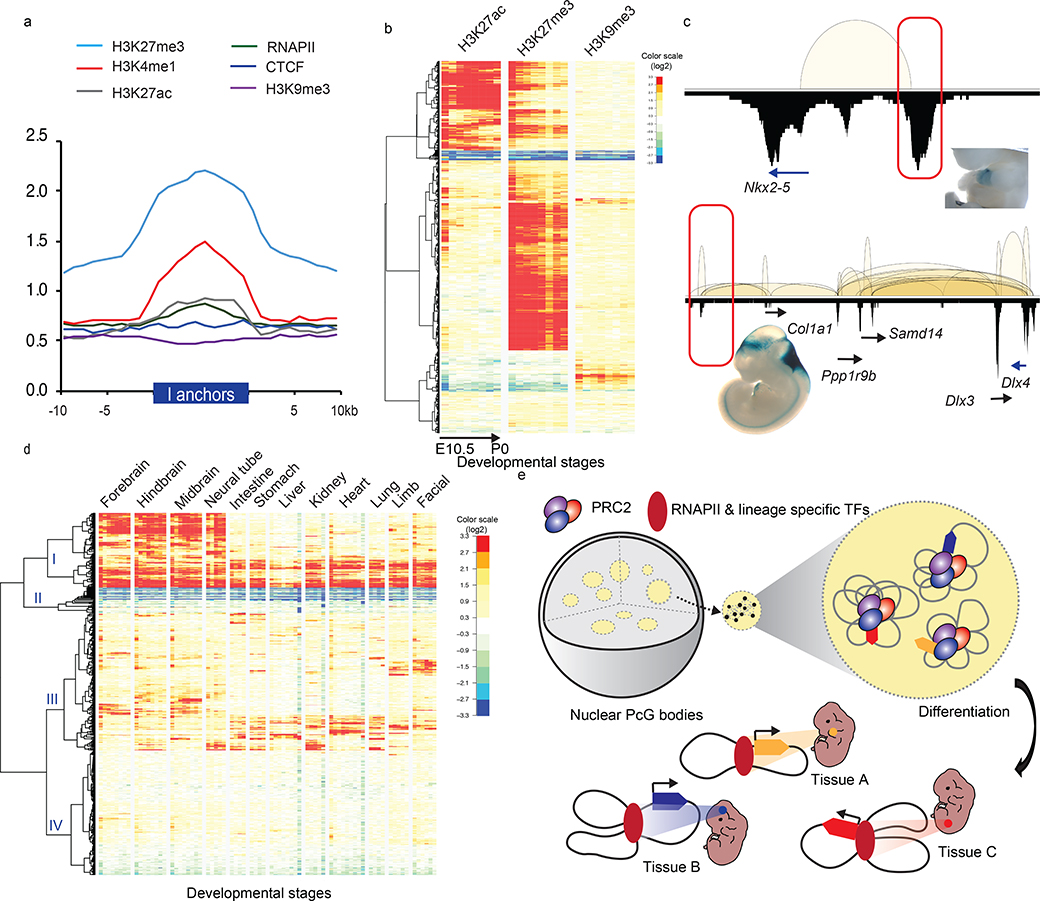
Lineage-specific gene expression is modulated by a balance between transcriptional activation and repression during animal development. Knowledge about enhancer-centered transcriptional activation has advanced considerably, but silencers and their roles in normal development remain poorly understood. Here, we performed chromatin interaction analyses of Polycomb repressive complex 2 (PRC2), a key inducer of transcriptional gene silencing, to uncover silencers, their molecular identity and associated chromatin connectivity. Systematic analysis of cis-regulatory silencer elements reveals their chromatin features and gene-targeting specificity. Deletion of certain PRC2-bound silencers in mice results in transcriptional derepression of their interacting genes and pleiotropic developmental phenotypes, including embryonic lethality. While some PRC2-bound elements function as silencers in pluripotent cells, they can transition into active tissue-specific enhancers during development, highlighting their regulatory versatility. Our study characterizes the molecular profile of silencers and their associated chromatin architectures, and suggests the possibility of targeted reactivation of epigenetically silenced genes.


Conflict of interest statement

Competing Financial Interest

We declare that none of the authors have competing financial or non-financial interests.

Figures

Extended Data Fig. 1:
Extended Data Fig. 1:. Reproducibility of PRC2 ChIA-PET analysis
a. Pearson correlation coefficient, r, between individual ChIA-PET replicates for EED (n=6), EZH2 (n=7), SUZ12 (n=11) and the combined PRC2 libraries between three subunits. See Supplementary Table 1 for sample details. b. PRC2 chromatin interactions and binding profile across chr4:139,536,779–140,286,920. Tracks from the top: BA interaction, PRC2 binding profiles and SA interactions. Y-axis: interaction frequency represented by PET counts. c. Distribution of interaction frequency among BA and SA interactions. Each box represents first quartile (bottom) and third quartile (top) with median in the middle. Whiskers represent data range defined as 1.5 times interquartile from median (Q2 +/− 1.5*(Q3-Q1)).
Extended Data Fig. 2:
Extended Data Fig. 2:. Extensive chromatin interactions between DREs and PRC2 bound genes
a. Examples of the multiple co-occurred chromatin looping patterns (P-P, P-G, P-I and intra-G interactions) in the Wnt6-Ihh (chr1:74,751,523–74,968,999) and Hoxb (chr11:96,161,617–96,425,610) regions are shown from EED (red), EZH2 (purple), SUZ12 (blue) and PRC2 (black) ChIA-PET libraries, respectively. b. Percentages of genes exhibit single, 2-type, 3-type and all 4-type of interactions. For example, among the 4,372 genes with P-P interactions, 14% of them have all 4-type of interactions (P-P, P-I, P-G and intra-G looping). c. Proposed model on how DREs can connect to their target genes and function as either enhancers or silencers by binding to RNAPII or PRC2.
Extended Data Fig. 3:
Extended Data Fig. 3:. Experimental validation of intergenic silencers in vivo
a. Schematic overview of generating heterozygous founder mice strains and ES clones carrying deletion in the intergenic anchors by CRISPR/Cas9. b. Schematic description of genotype strategy and primer design used in screening of KO mice and derived ES clones.
Extended Data Fig. 4:
Extended Data Fig. 4:. Intergenic anchors deleted in the mouse KO strains by CRISPR-Cas9
PRC2 interactions and binding profiles from 5 of the 6 KO regions (si-Δchr9 is shown in Figure 3a). Selective genes connected by the KO regions through the PRC2 loops are labelled. Chromosome location (from top to bottom) are as follow; chr11:118,861,894–119,194,521, chr5:28,100,320–28,484,061, chr3:107,423,514–107,782,737, chr7:143,061,554–143,537,289 and chr2:18,568,747–19,024,016.
Extended Data Fig. 5:
Extended Data Fig. 5:. Validation of KO
a. Genotype confirmation by Sanger sequencing of the PCR products for all six successfully generated KO clones. b. PCR genotyping of KO derived mES clones to confirm deletion (deleted region on chromosome 9) in si-Δchr9 derived F1 and G9 clones, in triplicate (only representative results are shown here) in two independent experiments.. Additional primer R26 was designed to confirm heteroallelic deletion. Panel on the right determination of the gender of the KO clones are XY while wild type ES line is XX (refers to Methods). c. Genotyping by PCR to confirm deletion (deleted region on chromosome 7) in si-Δchr7 derived mES D4 and F4 clones.
Extended Data Fig. 6:
Extended Data Fig. 6:. The loss of connectivity triggers genes reactivation
a. Heatmap showing connectivity in previous study using Hi-C and current study using ChIA-PET. Example shown is chr1:36,282,810–192,258,731. b. Topological-associated domain analysis showed no difference in si-Δchr9, si-Δchr7 compared to wildtype. c. Loss of connecting loops in si-Δchr7 clones D4 and F4. Shown are chr7:142,557,623–14,3646,256 and zoom in region chr7:143,127,114–14,3550,277. d. Genes expression of connected of si-Δchr7 and non-connected genes from flanking 500kb and 1Mb regions. Only clone D4 is shown. n indicates number of genes in each category. See details in Supplementary Table 8B.
Extended Data Fig. 7:
Extended Data Fig. 7:. Upregulation of genes associated with si-Δchr7
PRC2 interaction and binding profiles of the 1 Mb Igf2/Kcnq1 imprinting region. The si-Δchr7 (chr7:143,440,438–143,450,716) is marked in red. Three of the 10 genes with P-I interactions to this KO region located 15.5 Mb upstream. b. Normalized RNA-seq counts of the connected genes in wild type (+/+) (n=3) and 2 independent homozygous KO (−/−) ES clones D4 (n=3) and F4 (n=3). Gm44732 has no expression. N indicates number of biologically independent samples.
Extended Data Fig. 8:
Extended Data Fig. 8:. Upregulation of genes associated with si-Δchr9
a. Venn diagram of differentially upregulated genes in si-Δchr9 clones F1 and G9. Differentially expressed genes in homozygous KO (−/−) ES clones G9 (n=3) compared with wild type (+/+) ESC (n=3) shown in volcano plot (p-value vs. fold change). Dysregulated genes found in both F1 and G9 (red), F1 only (orange) and G9 only (blue) are color labelled. Selected genes with the most striking upregulation are labelled. b. Circos plot shows the inter-chromosomal connectivity (iPET counts > 10) between the KO allele with the 29 upregulated gene loci. c. The distribution of interaction frequencies between the si-Δchr9 KO silencer locus and random background #1 (Left) or #2 (Right). TIFs between si-Δchr9 and the dysregulated genes are shown as red lines.
Extended Data Fig. 9:
Extended Data Fig. 9:. Histone profiles of PRC2 interaction anchors
a. Enrichment fold of four histone modifications, RNAPII and CTCF binding over input across ±10Kb of promoter (P) and Gene (G)- anchor regions. b. Enrichment of H3K4me3 and ATAC-seq profile across ± 10 Kb of the promoter (P), gene (G) and intergenic (I) interaction anchors.
Extended Data Fig. 10:
Extended Data Fig. 10:. Features of intergenic anchors in developmental stages
a. Heat maps H3K27me3, H3K27ac, H3K9me3 normalized signals of the 1,800 I-anchors through progressive developmental stages of kidney, limbs, hindbrain and liver. The color scales represented the fold enrichment of the ChIP vs input at log2 scale. b. Expression of eRNA in distal regulatory elements (DREs) and those overlapped with PRC2-bound silencers. Each box represents first quartile (bottom) and third quartile (top) with median in the middle. Whiskers represent data range defined as 1.5 times interquartile from median (Q2 +/− 1.5*(Q3-Q1)). Points above whiskers represent outliers.
Fig. 1:
Fig. 1:. ChIA-PET analysis defines PRC2 interactome in mESC.
a. Cross-linked chromatin was fragmented and subjected to proximity ligation followed by ChIP enrichment for three core PRC2 components, EED (n = 6), EZH2 (n = 7) and SUZ12 (n = 11) in mESC. See Supplementary Table 1 for sample details. Five billion read pairs were pooled to define PRC2 binding sites and interactions supported by PRC2 binding at both anchors (BA) and single anchor (SA). b. Interactions (upper tracks) and binding (lower tracks) profiles across chr17:85,366,518–86,405,710 region for EED (red), EZH2 (purple), SUZ12 (blue) and combined PRC2 (black) are displayed with matching gene track. c. BA and SA interactions across chr16:96,921,289–98,008,954 region are shown together with the PRC2 binding profile and the associated genes. Y-axis shows the interaction frequency represented by the number of PET counts. d. Upper Panel: The distribution of PRC2 BA interactions among nuclear compartments A, B and across A-B. Percent of total BA interactions are shown. Lower panel: ChIA-PET interactions within 6 Mb of chromosomes 17 and 19 are shown in reference with the topological associated domains (TADs) defined by Hi-C contact maps.
Fig. 2:
Fig. 2:. PRC2 mediates extensive chromatin looping in genes of low transcription activities.
a. Four major subclasses of PRC2 interactions are classified based on features, gene (G), promoter (P) and intergenic (I), associated with the interaction anchors. The chromosomal regions showed are as follows; P-P, chr8:91,651,961–92,862,573; P-G, chr2:155,604,301–155,765,282; P-I, chr5:66,963,794–67,352,967 and Intra-G looping, chr10:42,916,485–43,260,546. PRC2 binding profiles are shown in lower tracks. b. The distribution of interaction frequency (PET counts) across the gene coding regions associated with PRC2 intra-G looping (n = 3,483). c. The percentages of genes with PRC2 interactions detected. X-axis indicates the protein factors bound at the promoters. Significant differences (paired t-test, p = 0.0012) are found between binding in the presence (black) or absence (hatched) of RNAPII. d. Distribution of steady-state RNA expression level (FPKM) among genes with different patterns of binding and interactions. Each box represents first quartile (bottom) and third quartile (top) with median in the middle. Whiskers represent data range defined as 1.5 times interquartile from median (Q2 +/− 1.5*(Q3-Q1)). Points above whiskers represent outliers. The single and double asterisks indicate significant p-value = 0.034 and 2.2E-16 from one-sided Wilcoxon rank sum tests. e. The percentages of PRC2 tethered genes with single, dual, three or all four subclasses of interaction types. Most genes are associated with more than one category of interactions.
Fig. 3:
Fig. 3:. Intergenic anchors function as transcriptional silencers.
a. Chromatin interaction profiles within chr9:37,071,610–37,689,270 mediated by each subunits of PRC2 were shown together with connected genes, H3K27me3 and CTCF binding intensity. The 10 Kb deleted si-Δchr9 region is highlighted. b. Contact heatmaps of chromosome 9 in wildtype (WT) and si-Δchr9 KO mESC lines. Regions (3–60 Mb) surrounding the deleted locus are highlighted. c. PRC2-mediated chromatin interaction profiles within chr9:36,955,506–37,955,721 in two independent WT and si-Δchr9 KO mESC lines. Lower panel displays region surrounding si-Δchr9 locus (chr9:37,395,678–37,576,659). d. Expression changes between connected vs. non-connected genes within 500kb and 1Mb of the si-Δchr9 region (Only clone F1 is shown). n indicates number of genes in each category. See details in Supplementary Table 8A. e. RNA expression of 4 selected genes connected to the si-Δchr9 locus from WT (n = 3), F1 (n = 2) and G9 (n = 3) KO mESC clones. f. Differential gene expression changes between the wild type (n=3) and homozygous deleted clones F1 (n=2) shown as a volcano plot. Selected genes with the most striking upregulation are labelled.
Fig. 4:
Fig. 4:. Mice with PRC2-bound silencer deletion display pleiotropic developmental defect.
a. Relative ratio of −/−, −/+ and +/+ genotypes determined in six KO F2 crosses, including attempts from multiple crosses. b. For si-Δchr9, numbers of embryos at E9.5 days (Y-axis) of different genotypes (X-axis) from F2 crosses with heterozygous KO locus. c. Morphology of wild type (+/+) and homozygous (−/−) si-Δchr9 embryos at E9.5. Scale bar is 0.5mm. d. Numbers of phenotypic assays with significant changes among the eight domains detected in each of the five deletion with viable homozygous KOs. Cohort of at least 5 age-matched, sex-matched mice were compared. Significance were adjusted for multiple testing using Benjamini-Hochberg procedure to control the FDR at 5%. Details provided in Supplementary Table 10. Abbreviations; bodycmp: body composition; cbc: complete blood count; ekg: electrocardiography; gtt: glucose tolerance test; grip: grip strength; ldbox: light-dark box test; oft: open field test; ppi: prepulse inhibition test. e. Significant alteration in bone density and plasma glucose detected in si-Δchr5 and si-Δchr11 KO mice, respectively. Both a regression line (solid line) and a loess line (dotted line) fitted for each genotype are shown. f. Percent of hits in the PRC2-silencer KO (n=5) mice in relative to these detected in the KO of protein coding genes (n=730). The lower, middle and upper hinges in the boxplot correspond to the first (Q1), median, third (3) of percentage significant hits for 730 KO gene in the KOMP. Whiskers represent data range defined as 1.5 times interquartile from median (Q2 +/− 1.5*(Q3-Q1)). Points above whiskers represent outliers.
Fig. 5:
Fig. 5:. Intergenic anchors exhibit the poised chromatin state and acquire enhancer signature during differentiation.
a. Enrichment fold of four histone modifications, RNAPII and CTCF binding over input control across ±10Kb of intergenic (I)-anchor regions. b. Heatmaps of H3K27ac, H3K27me3 and H3K9me3 normalized enrichment of the 1,800 I-anchors throughout progressive developmental stages in forebrain. The color scales represented the fold enrichment of ChIP over input.c. Enhancer activities of the PRC2 bound intergenic anchors in Nkx2–5 and Dlx3/4 loci observed in developing mouse embryos (heart in upper panel, mm1645 and hindbrain in lower panel, mm568) (www.enhancer.lbl.gov). d. Four distinct patterns of I-anchors based on the clustering of H3K27ac signal profiles across 74 different developmental stages collected from 12 tissues. The color scales represented the fold enrichment of ChIP over input. e. A model describes how PRC2 associated repressive chromatin foci contributing to TGS and transition into tissue specific enhancers during differentiation. PRC2 aggregated clusters are formed by extensive chromatin looping between silenced genes and their corresponding DREs. Upon differentiation, they are selectively dissolved, presumably in the absence of PRC2 binding. DREs acquire tissue specific enhancer signal and associate with RNAPII to activate their target gene expression.

References

    1. Young RA Control of the embryonic stem cell state. Cell 144, 940–54 (2011). - PMC - PubMed
    1. Cook PR A model for all genomes: the role of transcription factories. J Mol Biol 395, 1–10 (2010). - PubMed
    1. Saurin AJ et al. The human polycomb group complex associates with pericentromeric heterochromatin to form a novel nuclear domain. J Cell Biol 142, 887–98 (1998). - PMC - PubMed
    1. Zhang Y et al. Chromatin connectivity maps reveal dynamic promoter-enhancer long-range associations. Nature 504, 306–310 (2013). - PMC - PubMed
    1. Chakalova L & Fraser P Organization of transcription. Cold Spring Harb Perspect Biol 2, a000729 (2010). - PMC - PubMed

Publication types