. 2020 May;16(5):577-586.
doi: 10.1038/s41589-020-0484-2. Epub 2020 Feb 24.

A drug discovery platform to identify compounds that inhibit EGFR triple mutants

Affiliations

A drug discovery platform to identify compounds that inhibit EGFR triple mutants

Punit Saraon et al. Nat Chem Biol. 2020 May.

Abstract

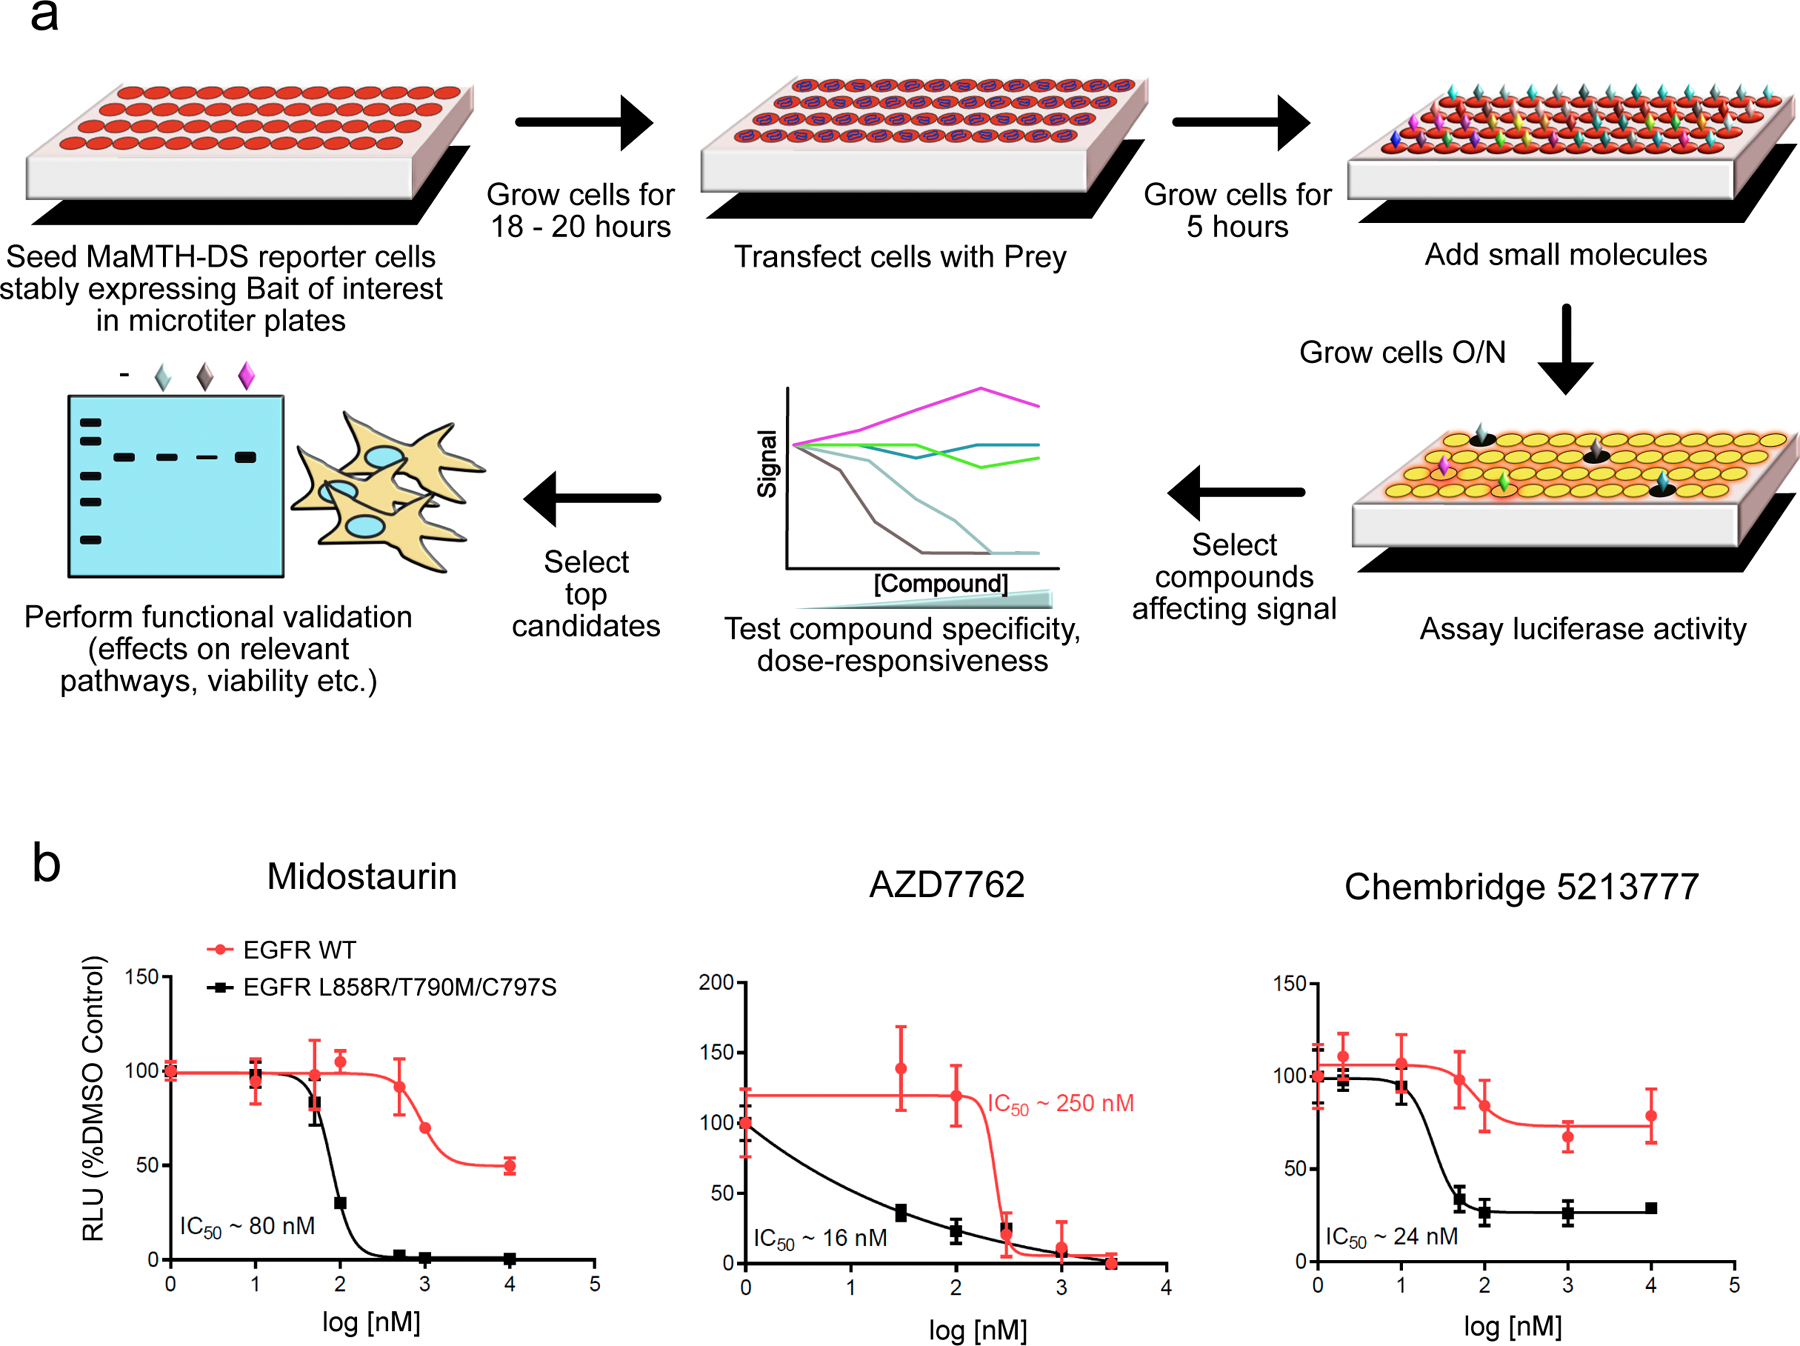
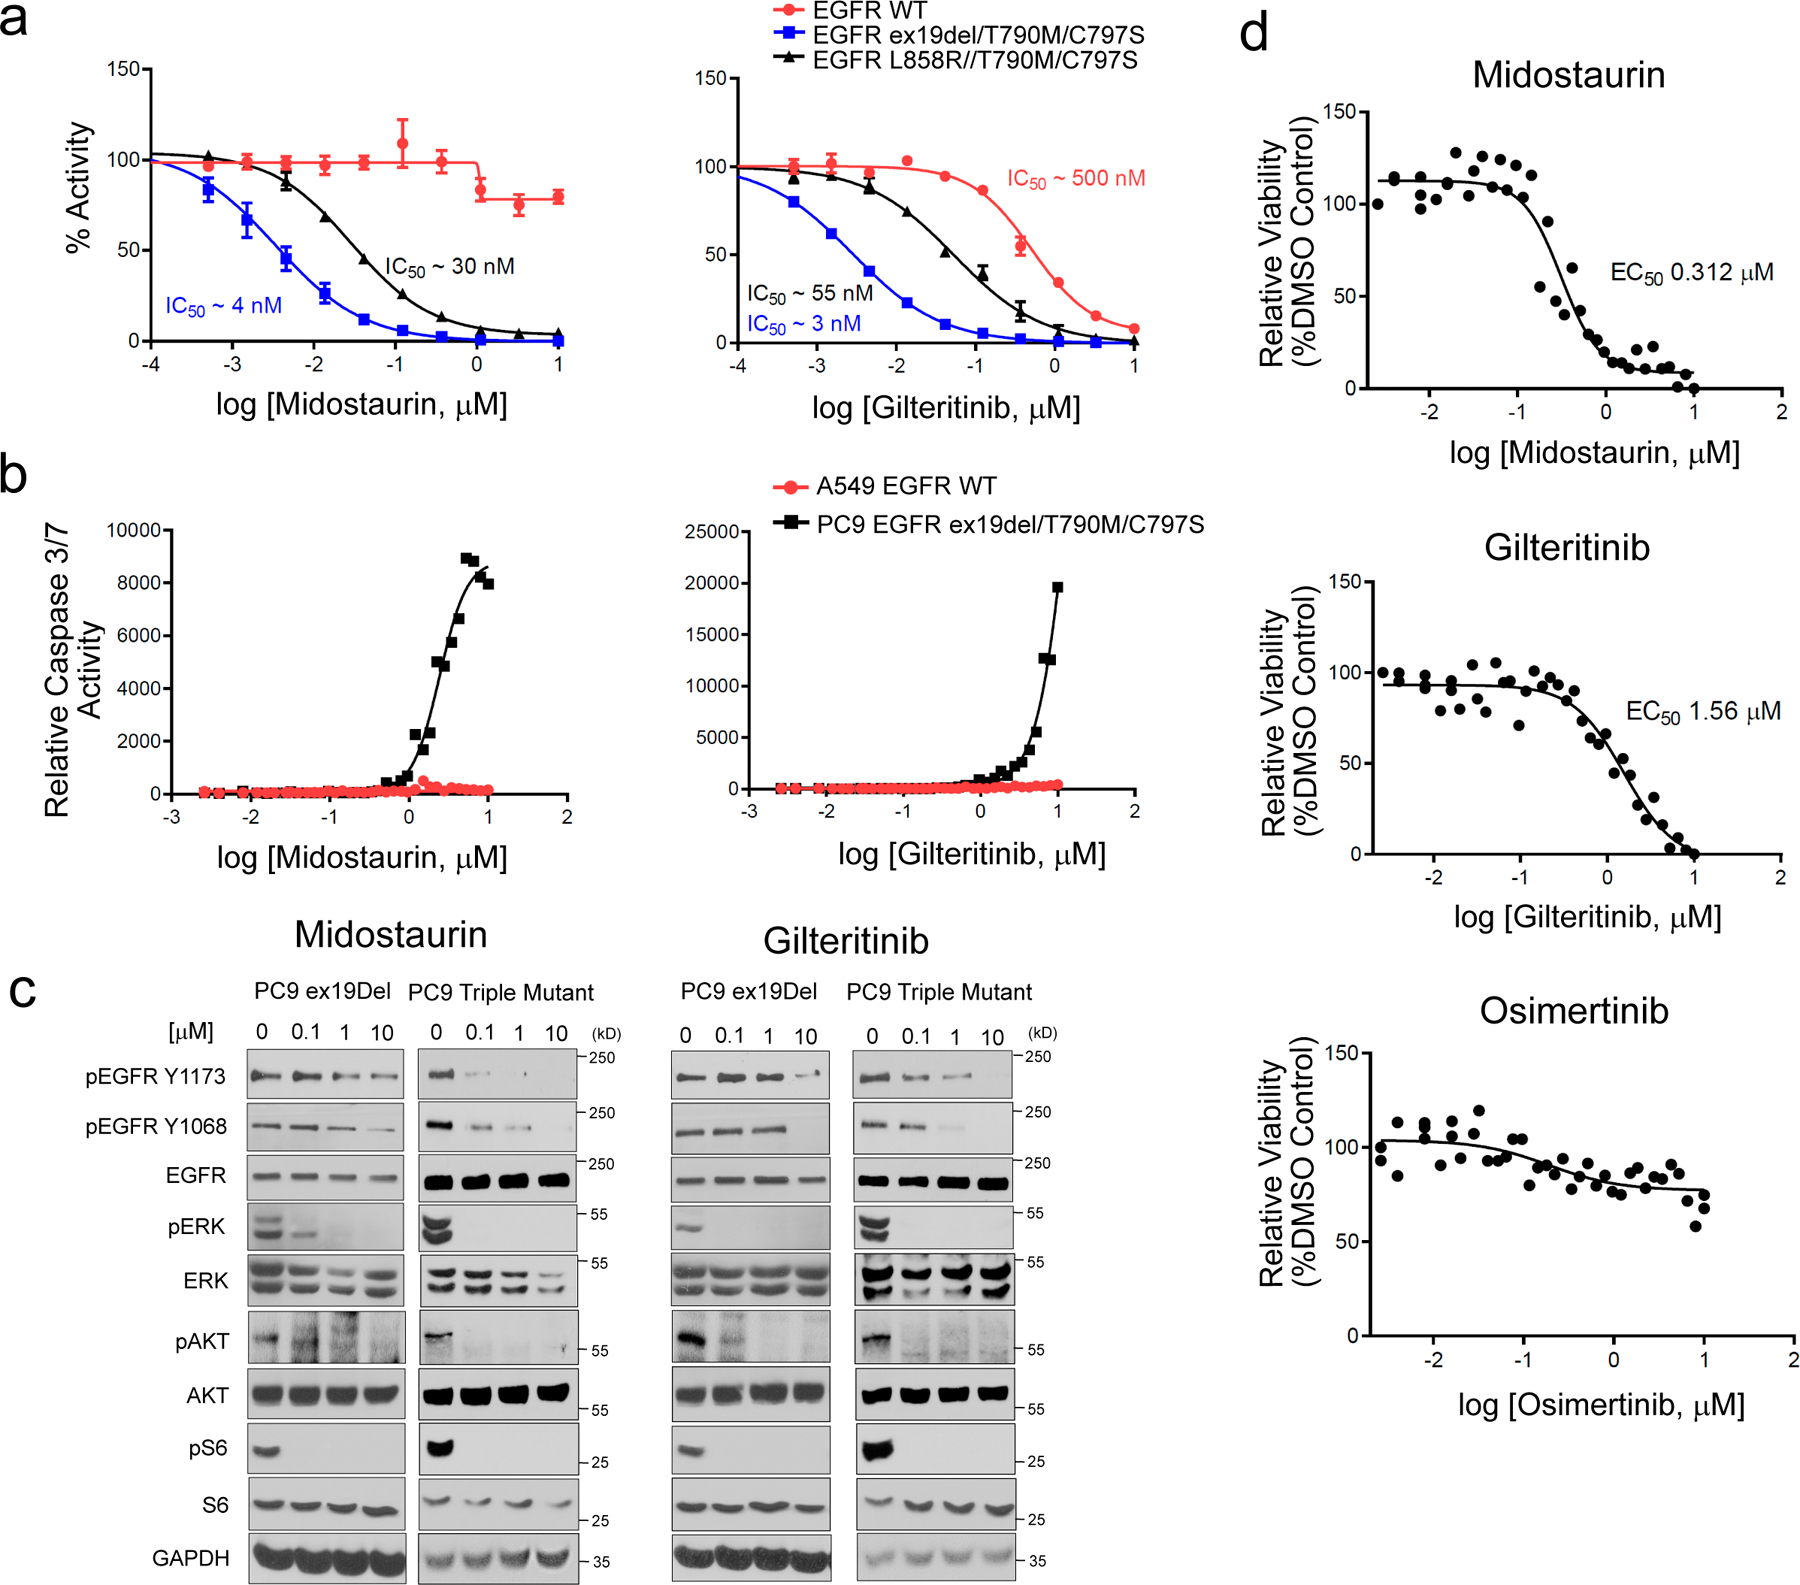
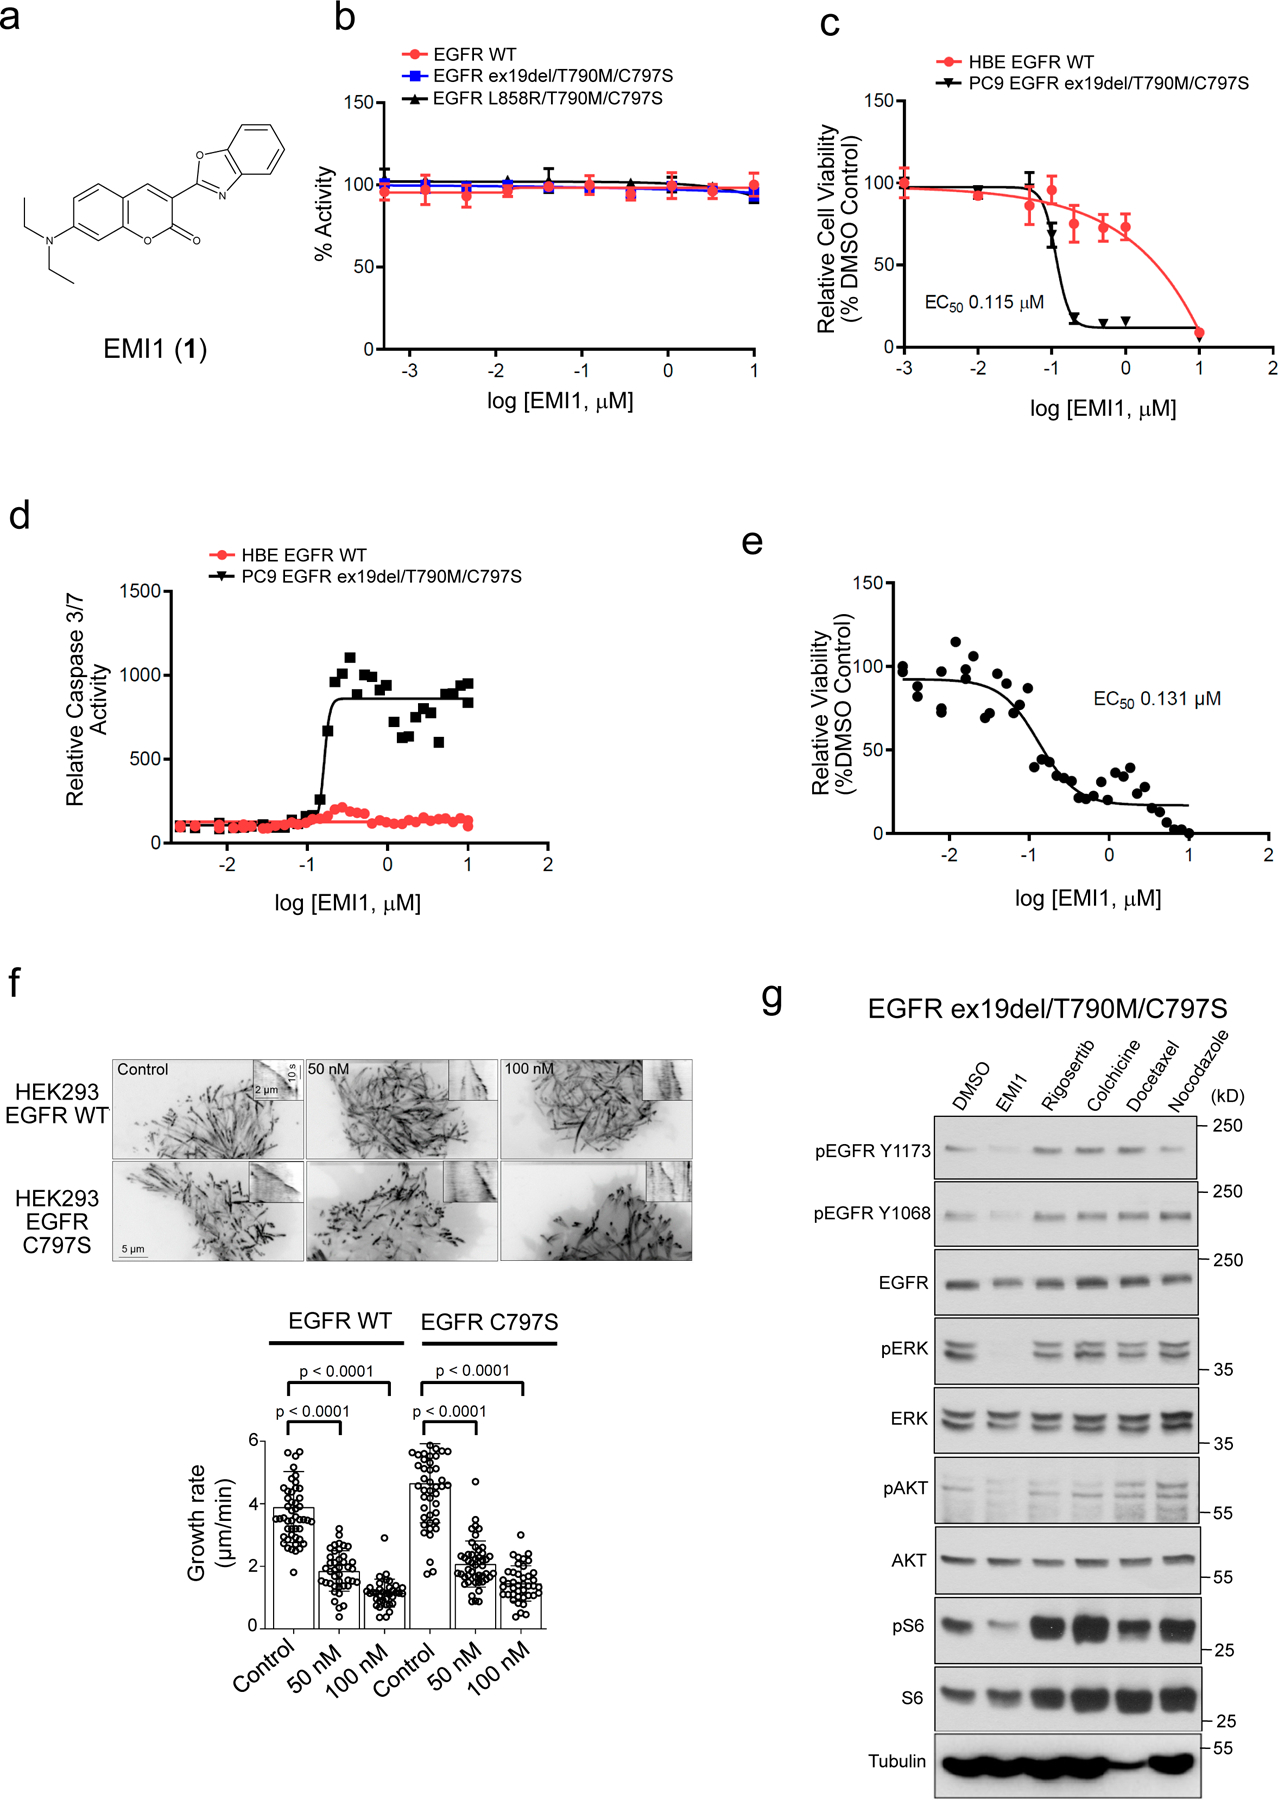
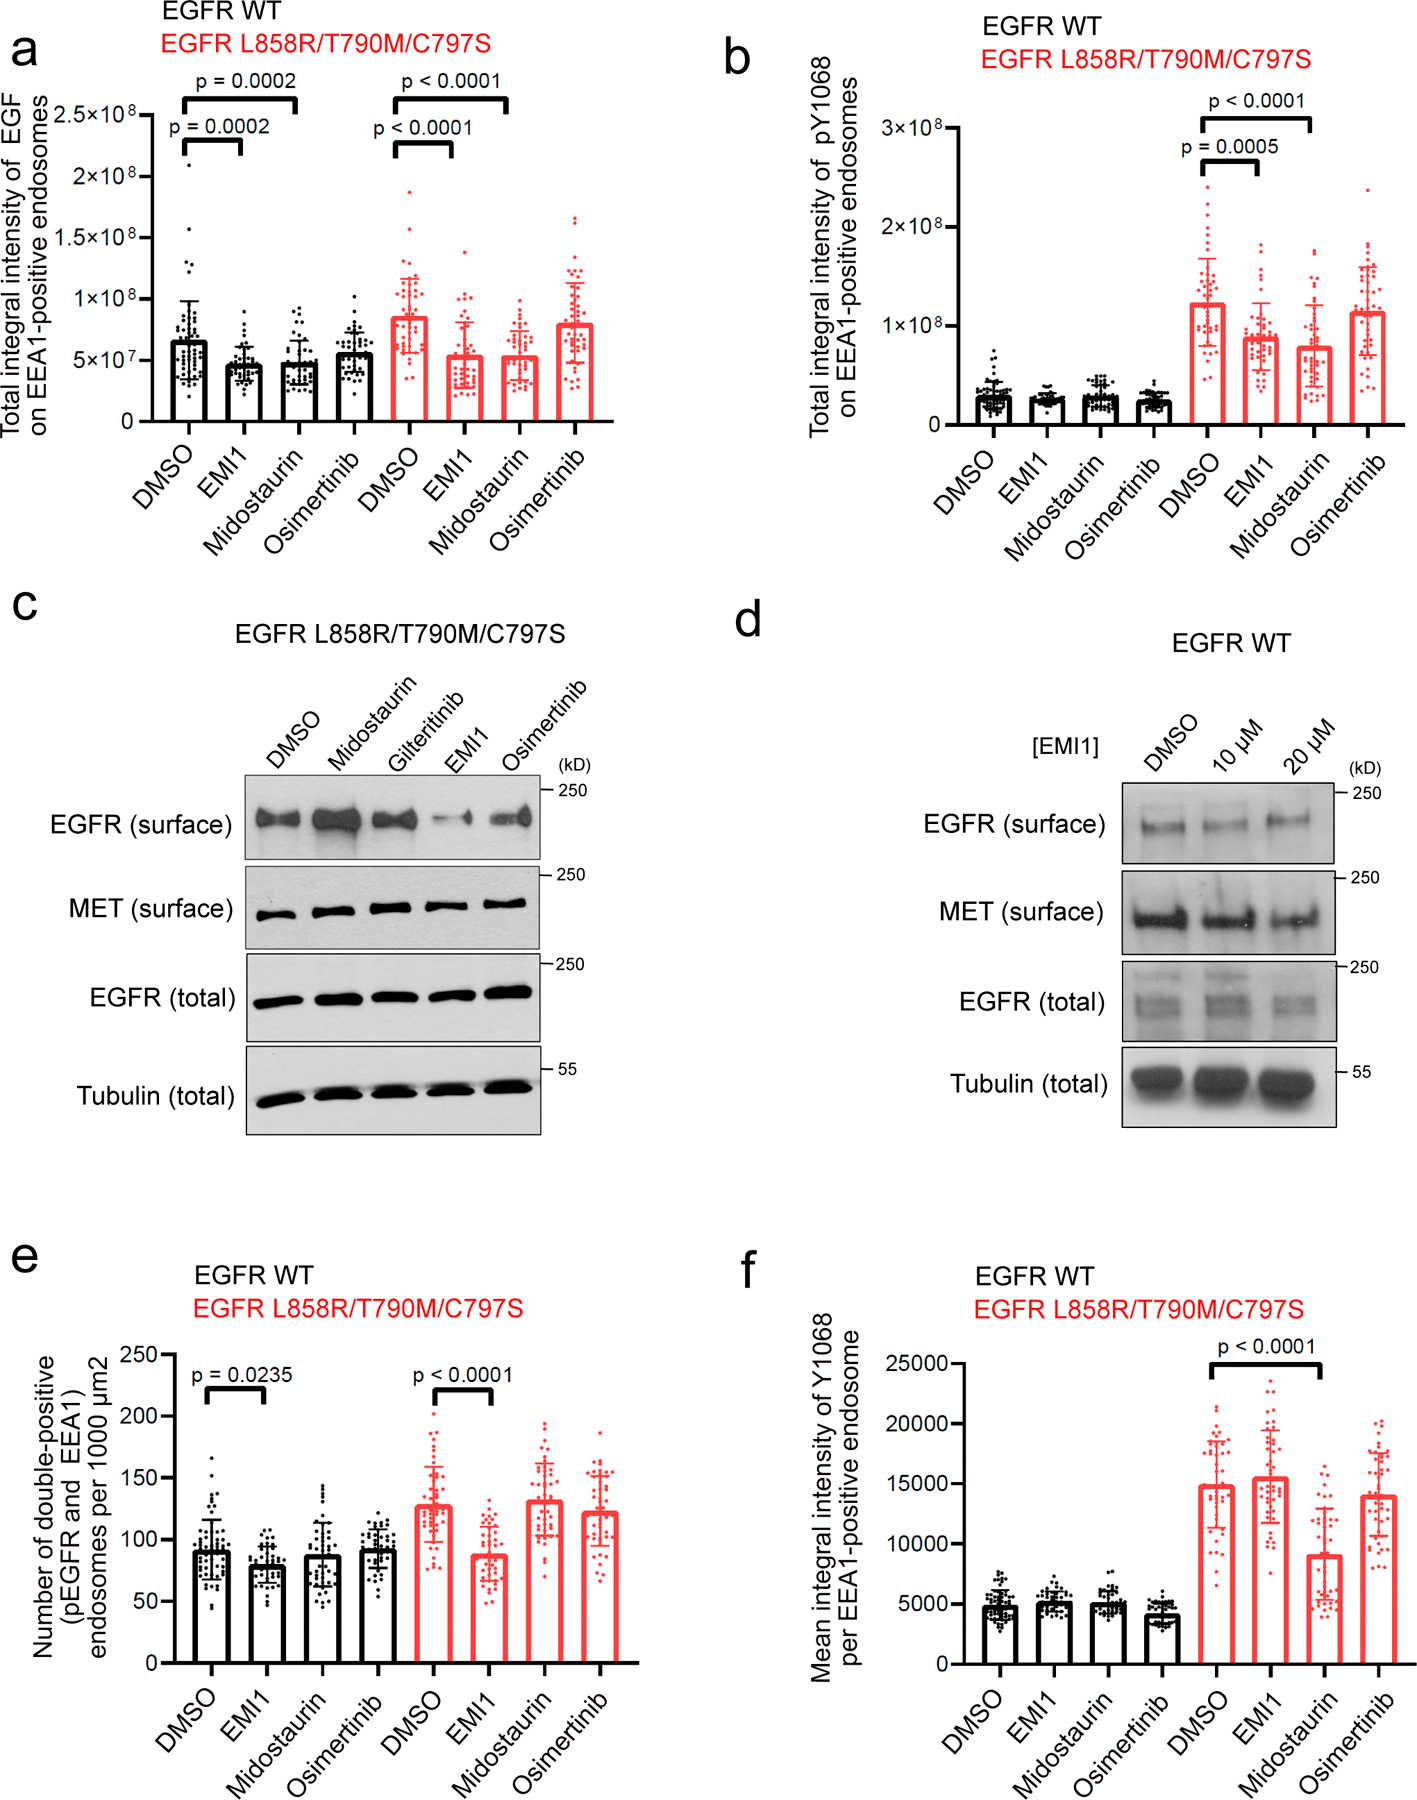
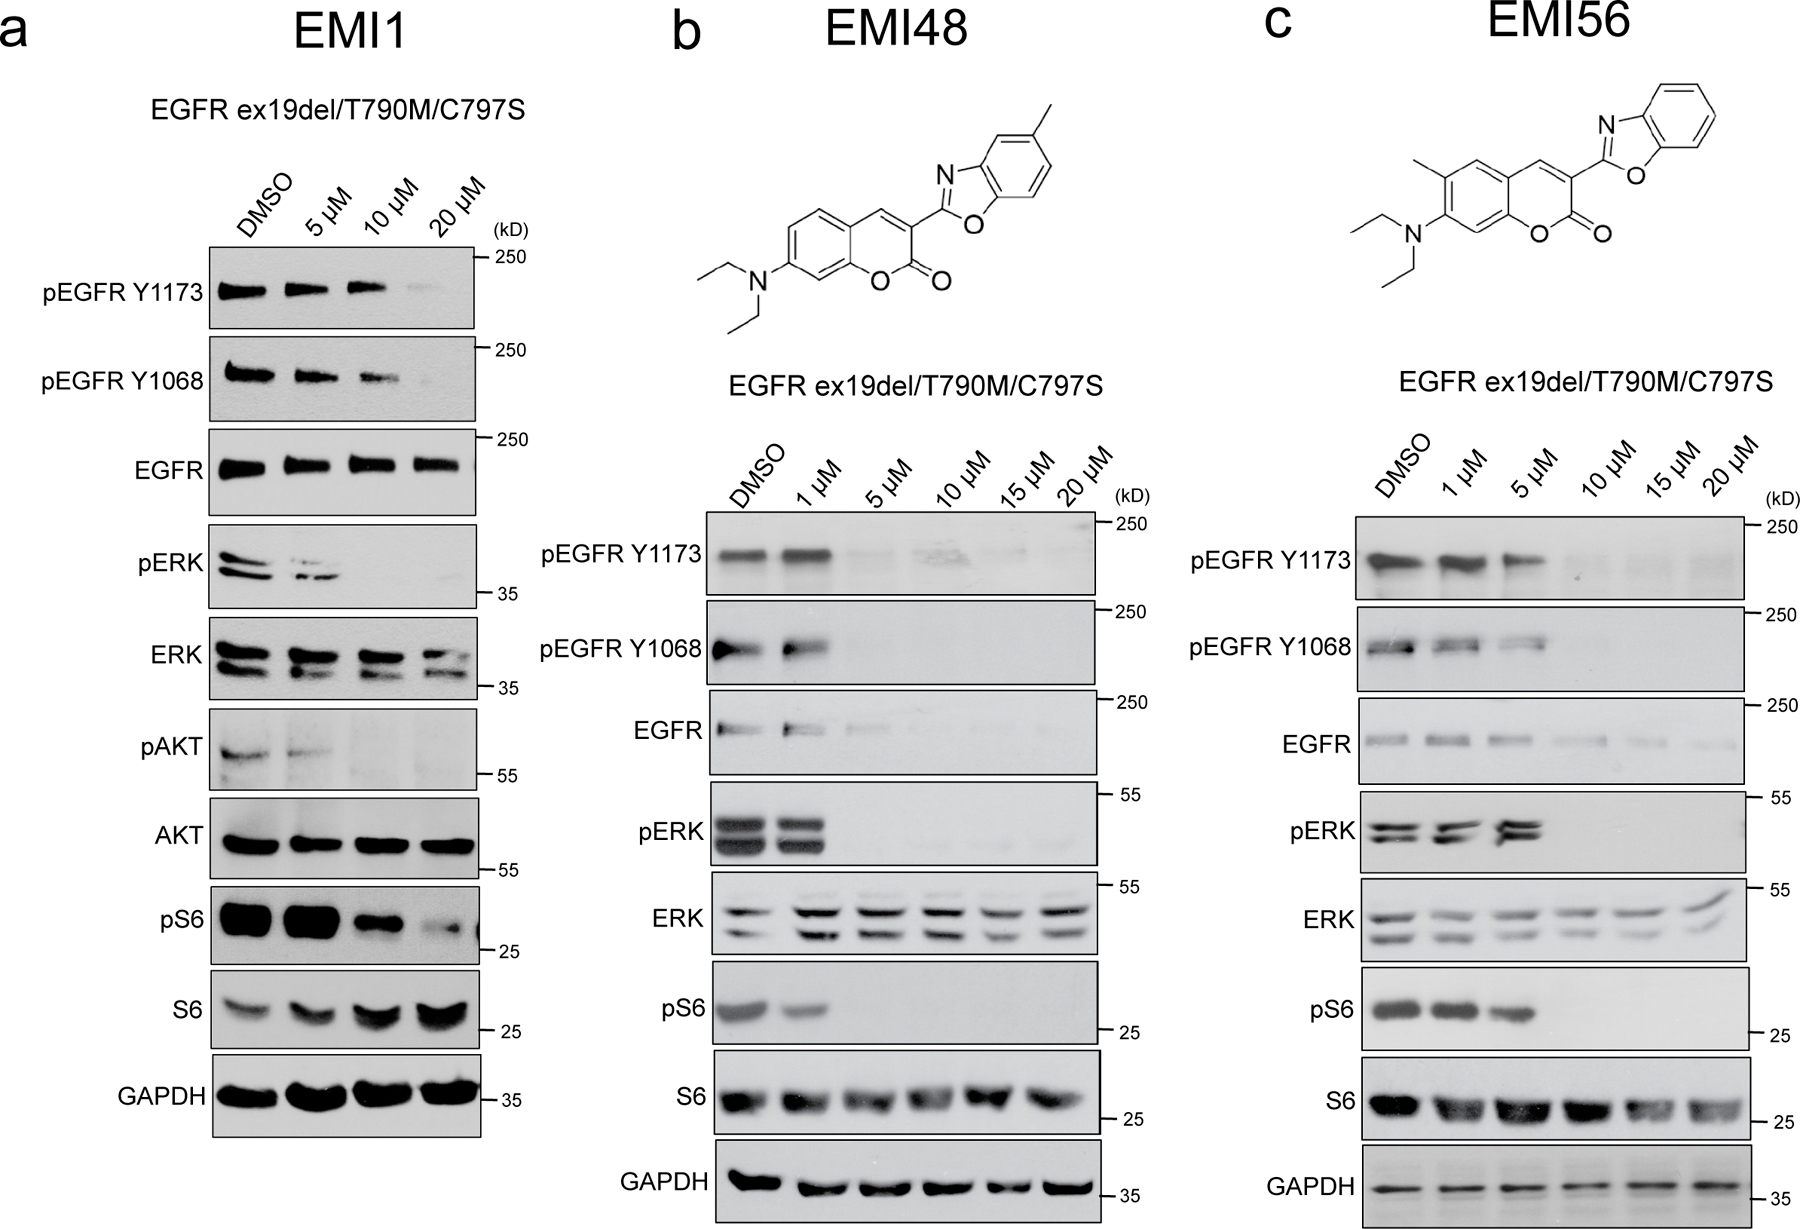
Receptor tyrosine kinases (RTKs) are transmembrane receptors of great clinical interest due to their role in disease. Historically, therapeutics targeting RTKs have been identified using in vitro kinase assays. Due to frequent development of drug resistance, however, there is a need to identify more diverse compounds that inhibit mutated but not wild-type RTKs. Here, we describe MaMTH-DS (mammalian membrane two-hybrid drug screening), a live-cell platform for high-throughput identification of small molecules targeting functional protein-protein interactions of RTKs. We applied MaMTH-DS to an oncogenic epidermal growth factor receptor (EGFR) mutant resistant to the latest generation of clinically approved tyrosine kinase inhibitors (TKIs). We identified four mutant-specific compounds, including two that would not have been detected by conventional in vitro kinase assays. One of these targets mutant EGFR via a new mechanism of action, distinct from classical TKI inhibition. Our results demonstrate how MaMTH-DS is a powerful complement to traditional drug screening approaches.


Conflict of interest statement

COMPETING FINANCIAL INTERESTS

I.S., P.S. and J.S. (in conjunction with the University of Toronto) are listed as inventors on a patent (publication number 20190091205) for the use of EMI1 (and structurally related analogues), midostaurin, gilteritinib and AZD7762 (and structurally related analogues) in the treatment of mutant EGFR-mediated non-small-cell lung cancer.

Figures

Figure 1.
Figure 1.
(a) Schematic representation of the MaMTH-DS platform workflow. (b) Dose response curves for the top three candidate EGFR L858R/T790M/C797S inhibitors (midostaurin, AZD7762 and Chembridge 5213777) showing robust, dose-responsive and mutant specific inhibition. Results are shown as the average ± SD for three independent experiments.
Figure 2.
Figure 2.
Validation of midostaurin and gilteritinib as EGFR ex19del/T790M/C797S and EGFR L858R/T790M/C797S activating mutant inhibitors. (a) in vitro kinase assay of recombinant kinase domain (residues 696–1022) of indicated mutant or WT EGFR in the presence of midostaurin (left panel) or gilteritinib (right panel). Results are shown as the average ± SD for two independent experiments. (b) Effect of midostaurin and gilteritinib on caspase 3/7 activity in PC9 EGFR ex19del/T790M/C797S and A549 EGFR WT cells. Results are shown as single 36-point dose response experiments. (c) Effects of midostaurin (left panels) and gilteritinib (right panels) on EGFR activation and downstream signalling in PC9 EGFR ex19del and EGFR ex19del/T790M/C797S cells after 2 hours treatment (see Supplementary Figs 21–24 for source blot images). Results are representative of at least two independent experiments. (d) Midostaurin and gilteritinib mediated reduction of PC9 EGFR ex19del/T790M/C797S organoid viability. Osimertinib control, which does not target triple mutant EGFR activity, has no effect. Results are shown as single 36-point dose response experiments.
Figure 3.
Figure 3.
Validation of EMI1 as an EGFR ex19del/T790M/C797S and EGFR L858R/T790M/C797S activating mutant inhibitor. (a) Chemical structure for EMI1. (b) in vitro kinase assay of recombinant kinase domain (residues 696–1022) of indicated mutant or WT EGFR in the presence of EMI1. Results are shown as the average ± SD for two independent experiments. (c) Effect of EMI1 on the viability of PC9 EGFR ex19del/T790M/C797S and HBE bronchial epithelial lung EGFR WT control cells. Results are shown as the average ± SD for three independent experiments (d) Effect of EMI1 on caspase 3/7 activity in PC9 EGFR ex19del/T790M/C797S and HBE EGFR WT cells. Results are shown as single 36-point dose response experiments. (e) Viability assay measuring effect of EMI1 on PC9 EGFR ex19del/T790M/C797S organoid growth. Results are shown as single 36-point dose response experiments. (f) Maximum intensity projections (stream acquisition/exposure time 500 ms/100 frames) showing the effect of EMI1 on microtubule dynamics in HEK293 MaMTH reporter cells stably expressing EGFR WT or EGFR L858R/T790M/C797S transfected with EB3-TagRFP as a microtubule plus end marker. The contrast is inverted. Graph shows quantification of microtubule plus end velocity in HEK293 reporter cells for EMI1. n = 51, 41, 36 for HEK293 EGFR WT, control, 50 and 100 nM. n = 49, 47, 41 for HEK293 EGFR C797S control, 50 and 100 nM. Significant p-values are displayed and were calculated using the Mann-Whitney test. (g) Western blot analysis showing activity of EMI1 and other microtubule targeting compounds after 2 hours treatment on EGFR ex19del/T790M/C797S activation and downstream signalling in PC9 triple mutant cells (see Supplementary Fig. 25 for source blot images). Results are representative of at least two independent experiments.
Figure 4.
Figure 4.
Investigating effect of EMI1 on activated EGFR L858R/T790M/C797S endosomal trafficking. (a) Total integral intensity of EGF on EEA1-positive endosomes normalized on cytoplasm area after 30 minutes of EGF stimulation upon 1 µM compound treatment in HEK293 EGFR WT cells or EGFR L858R/T790M/C797S cells. (b) Total integral intensity of pY1068 on EEA1-positive endosomes normalized on cytoplasm area after 30 minutes of EGF stimulation with 1 µM compound treatment in HEK293 EGFR WT cells or EGFR L858R/T790M/C797S cells. Results are shown as dot plots representing the average ± SD. For EGFR WT cells, n = 63, 46, 48 and 48 images were analyzed for DMSO, EMI1, midostaurin and osimertinib treatment, respectively. For EGFR-C797S cells, n = 48, 46, 46, 48 images were analyzed for DMSO, EMI1, midostaurin and osimertinib treatment, respectively. Significant p-values are displayed and were calculated using the Dunn’s multiple comparison test. (c) Cell surface biotinylation assay assessing surface levels of EGFR L858R/T790M/C797S after treatment with 5 µM compound for 2 hours. Results are representative of at least two independent experiments. (d) Cell surface biotinylation assay assessing surface levels of EGFR WT after treatment with EMI1 for 2 hours. Results are representative of at least two independent experiments (see Supplementary Fig. 26 for source blot images). (e) Number of pEGFR and EEA1 double-positive endosomes per 1000μm2 after 30 min stimulation by EGF. (f) Mean integral intensity of pEGFR on double-positive (pEGFR and EEA1) endosomes after 30 min stimulation by EGF. Results are shown as dot plots representing the average ± SD. For EGFR WT cells, n = 63, 46, 48 and 48 images were analyzed for DMSO, EMI1, midostaurin and osimertinib treatment, respectively. For EGFR-C797S cells, n = 48, 46, 46, 48 images were analyzed for DMSO, EMI1, midostaurin and osimertinib treatment, respectively. Significant p-values are displayed and were calculated using the Dunn’s multiple comparison test.
Figure 5.
Figure 5.
Generation and testing of EMI1 chemical analogs. (b,c,d) Western blot analysis showing effects of EMI1 (b) EMI48 (c) and EMI56 (d) on total EGFR levels, activation and downstream signalling after two hours treatment in PC9 EGFR ex19del/T790M/C797S cells (see Supplementary Figs 27 and 28 for source blot images). Results are representative of at least two independent experiments.

Comment in

References

    1. Lemmon MA & Schlessinger J Cell Signaling by Receptor Tyrosine Kinases. Cell 141, 1117–1134 (2010). - PMC - PubMed
    1. Volinsky N & Kholodenko BN Complexity of Receptor Tyrosine Kinase Signal Processing. Cold Spring Harb. Perspect. Biol 5, a009043–a009043 (2013). - PMC - PubMed
    1. Jia Y, Quinn CM, Kwak S & Talanian RV Current in vitro kinase assay technologies: the quest for a universal format. Curr. Drug Discov. Technol 5, 59–69 (2008). - PubMed
    1. Petschnigg J et al. The mammalian-membrane two-hybrid assay (MaMTH) for probing membrane-protein interactions in human cells. Nat. Methods 11, 585–92 (2014). - PubMed
    1. Sokolina K et al. Systematic protein–protein interaction mapping for clinically relevant human GPCRs. Mol. Syst. Biol 13, 918 (2017). - PMC - PubMed

METHODS-ONLY REFERENCES

    1. Collinet C et al. Systems survey of endocytosis by multiparametric image analysis. Nature 464, 243–9 (2010). - PubMed
    1. Rink J, Ghigo E, Kalaidzidis Y & Zerial M Rab conversion as a mechanism of progression from early to late endosomes. Cell 122, 735–749 (2005). - PubMed
    1. Gibson DG et al. Enzymatic assembly of DNA molecules up to several hundred kilobases. Nat. Methods 6, 343–345 (2009). - PubMed
    1. Yang X et al. A public genome-scale lentiviral expression library of human ORFs. Nat. Methods 8, 659–61 (2011). - PMC - PubMed
    1. R-Core-Team. R: A language and environment for statistical computing (2017).

Publication types

MeSH terms