. 2020 Apr;26(4):577-588.
doi: 10.1038/s41591-020-0757-z. Epub 2020 Feb 24.

TMEM30A loss-of-function mutations drive lymphomagenesis and confer therapeutically exploitable vulnerability in B-cell lymphoma

Affiliations

TMEM30A loss-of-function mutations drive lymphomagenesis and confer therapeutically exploitable vulnerability in B-cell lymphoma

Daisuke Ennishi et al. Nat Med. 2020 Apr.

Abstract

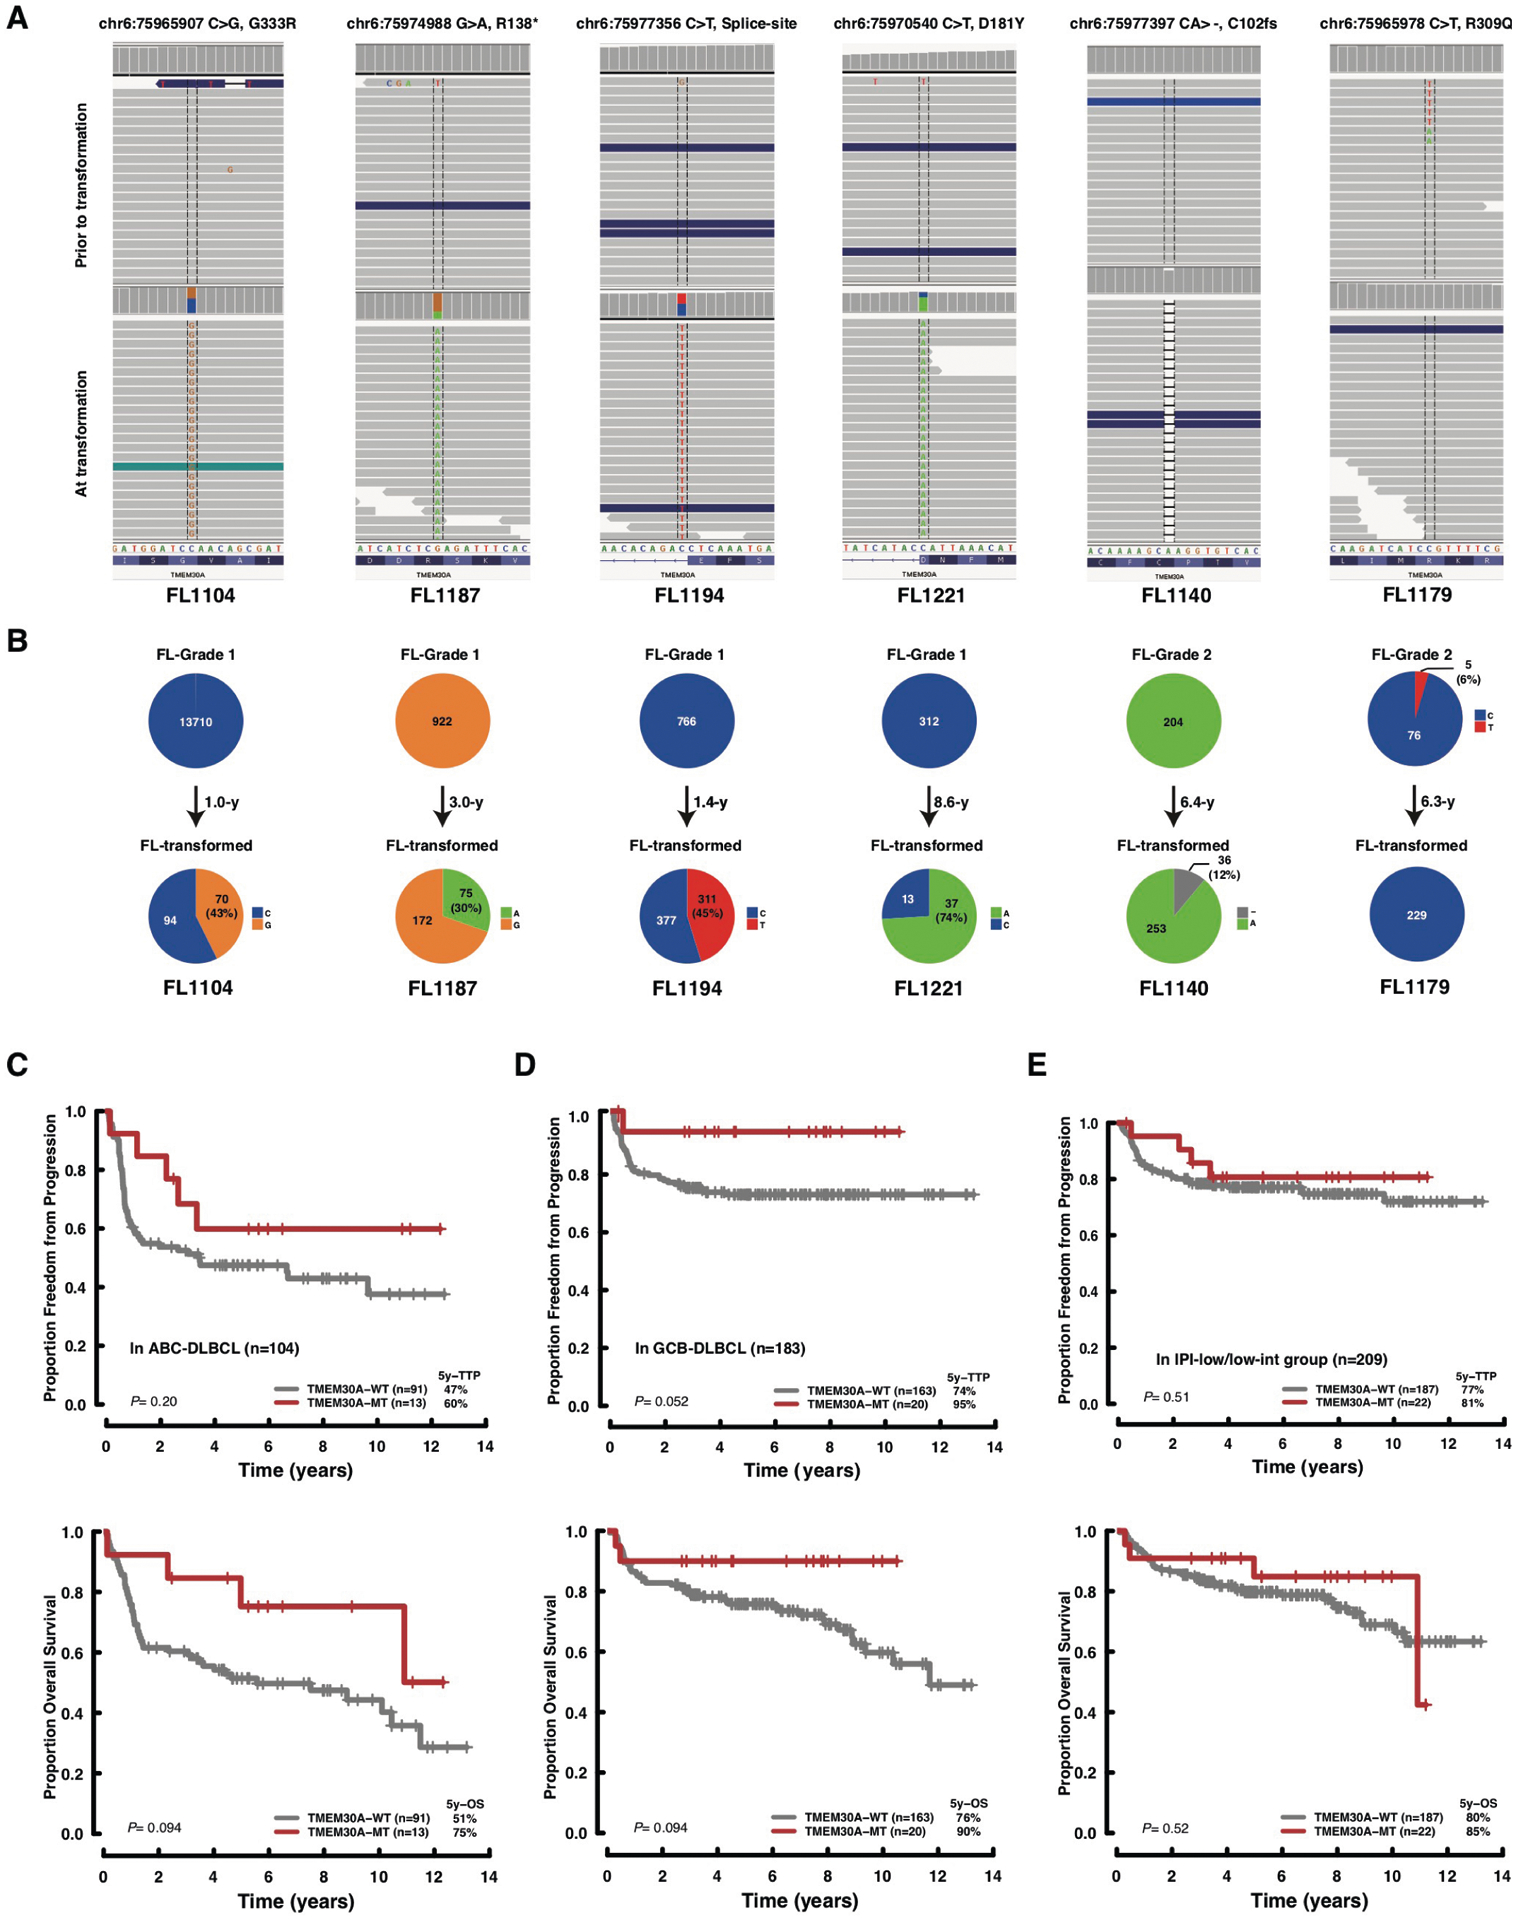
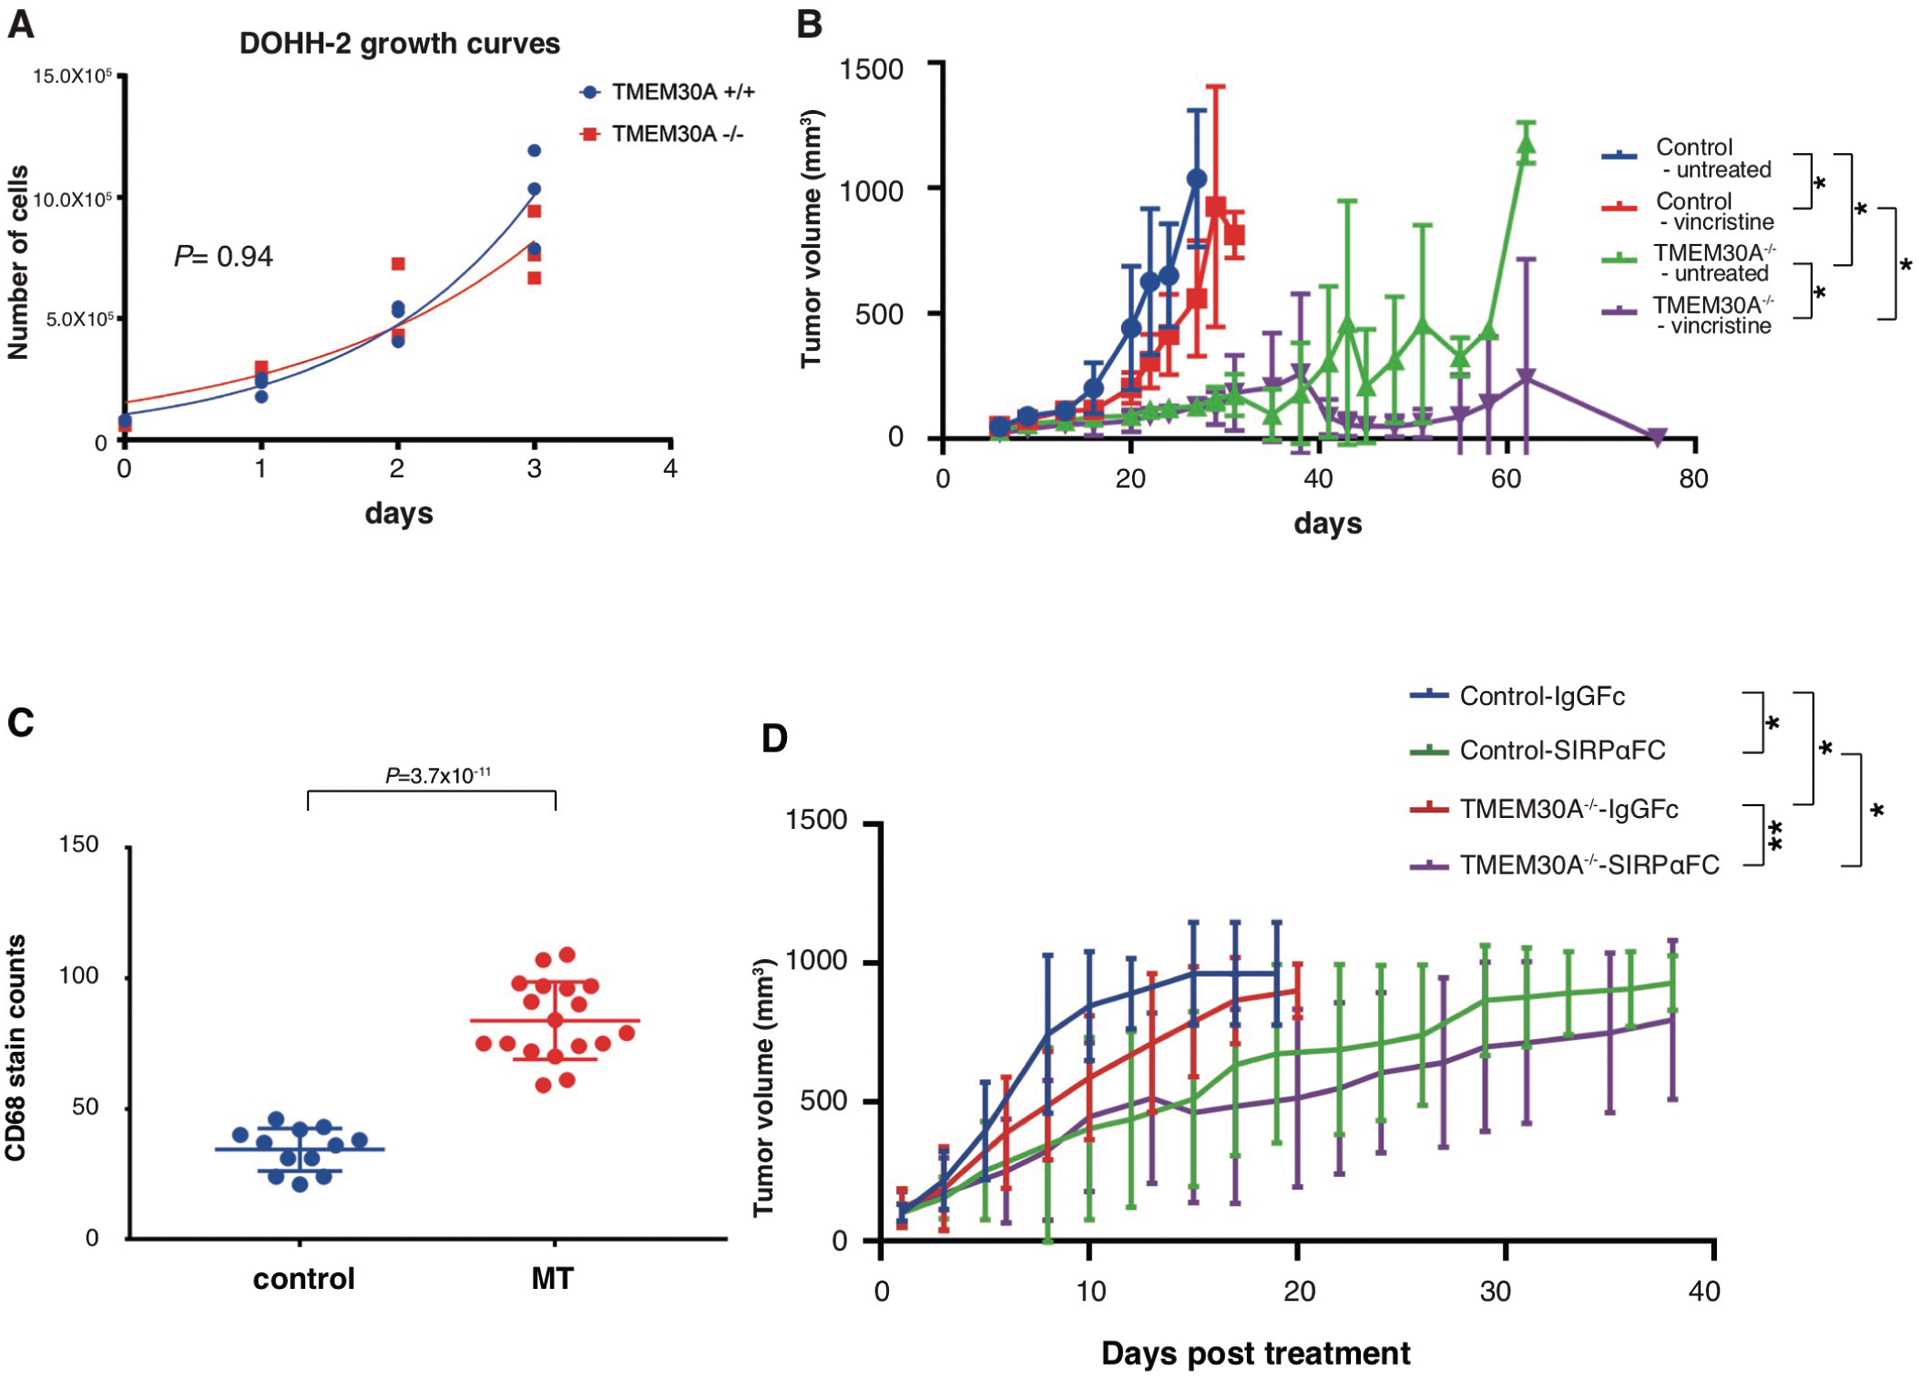
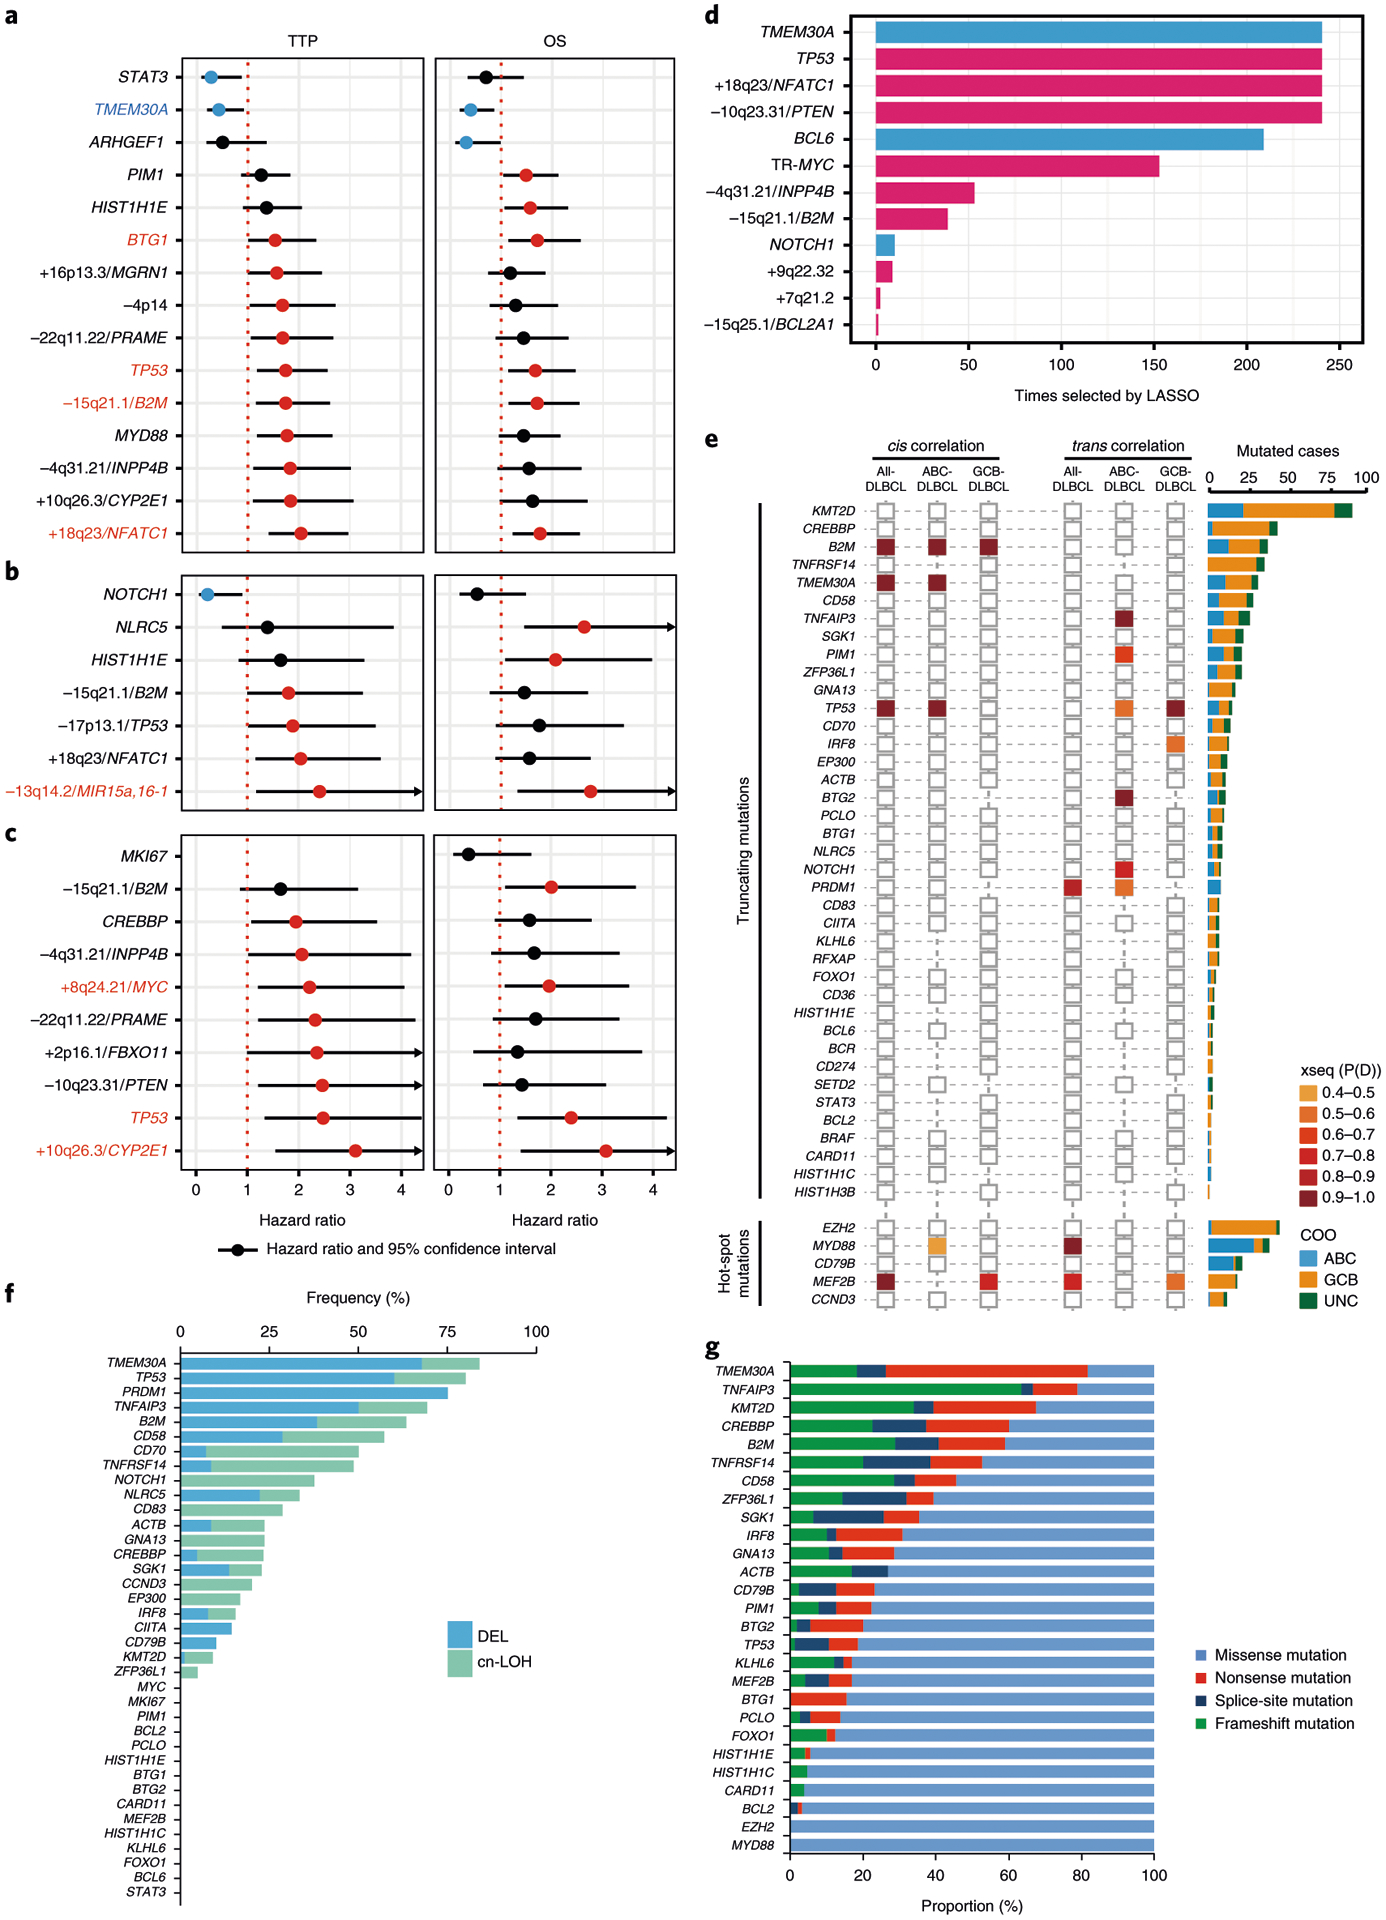
Transmembrane protein 30A (TMEM30A) maintains the asymmetric distribution of phosphatidylserine, an integral component of the cell membrane and 'eat-me' signal recognized by macrophages. Integrative genomic and transcriptomic analysis of diffuse large B-cell lymphoma (DLBCL) from the British Columbia population-based registry uncovered recurrent biallelic TMEM30A loss-of-function mutations, which were associated with a favorable outcome and uniquely observed in DLBCL. Using TMEM30A-knockout systems, increased accumulation of chemotherapy drugs was observed in TMEM30A-knockout cell lines and TMEM30A-mutated primary cells, explaining the improved treatment outcome. Furthermore, we found increased tumor-associated macrophages and an enhanced effect of anti-CD47 blockade limiting tumor growth in TMEM30A-knockout models. By contrast, we show that TMEM30A loss-of-function increases B-cell signaling following antigen stimulation-a mechanism conferring selective advantage during B-cell lymphoma development. Our data highlight a multifaceted role for TMEM30A in B-cell lymphomagenesis, and characterize intrinsic and extrinsic vulnerabilities of cancer cells that can be therapeutically exploited.


Figures

Extended Data Fig. 1 |
Extended Data Fig. 1 |. Recurrent mutation and copy number alterations (CNAs) of DLBCL.
a, Frequencies and type of mutations identified by deep targeted sequencing in 57 recurrently mutated genes in 347 DLBCL tumors. Genes significantly enriched in ABC-DLBCL and GCB-DLBCL are highlighted in blue and orange, respectively. Colored asterisks represent the pathways to which mutations belong. b, Significant (q-value<0.25) focal amplifications (red) and deletions (blue) identified by GISTIC 2.0 analysis (n = 338). Representative genes (functionally known in DLBCL, as well as other cancers) within significant GISTIC regions are annotated. Genes significantly enriched in ABC-DLBCL and GCB-DLBCL are highlighted in blue and orange, respectively. Colored asterisks represent the pathways to which CNAs belong.
Extended Data Fig. 2 |
Extended Data Fig. 2 |. Frequencies and prognostic effects of individual genetic alterations.
Mutated genes (frequency > 5%) and representative CNAs within GISTIC regions were evaluated. Frequencies of genetic alterations are depicted according to COO subtype. Genes significantly enriched (adjusted p < 0.10, two-sided fisher’s exact test) in ABC-DLBCL (blue) and GCB-DLBCL (orange) are highlighted (left panel). P < 0.05, ⋆⋆P < 0.01, ⋆⋆⋆P < 0.001 (adjusted by multiple test). Forest plot summarizes the results of univariate analyses (time-to progression (TTP)) for each genomic alteration, in all DLBCL (grey), in ABC-DLBCL (light blue) and in GCB-DLBCL (light-orange). Hazard ratios and 95% confidence intervals are shown. Yellow circles represent significant hazard ratios (p < 0.05) (right panel). HETD, heterozygous deletion; HOMD, homozygous deletion; AMP, amplification.
Extended Data Fig. 3 |
Extended Data Fig. 3 |. ATPase activity of ATP8A2-TMEM30A variants, and association of recurrent genetic alterations with TMEM30A mutation in DLBCL.
Human ATP8A2 was expressed with or without human TMEM30A or missense mutants in HEK293T cells. a, The expressed complex was purified on an ATP8A2 immunoaffinity column and the input and eluted samples were subjected to SDS gel electrophoresis and western blots were labeled for ATP8A2 with the Atp6C11 and Cdc50-7F4 antibodies. Cropped images from the same Western blot are shown. Tubulin was detected as a loading control for the input lanes. Independent experiments were repeated twice with similar results. Source Data Extended Fig. 3. b, ATPase activity is measured as nmols of ATP hydrolyzed per 30 min at 37 °C. ATPase activities of the isolated complexes were measured in either 100% dioleylphosphatidylcholine (PC) or a mixture of 80% dioleoylphosphatidylcholine: 20% dioleylphosphatidylserine (PS). Samples are: ATP8A2 - expression in the absence of expressed TMEM30A; ATP8A2/WT - co-expression of ATP8A2 with WT- TMEM30A; and ATP8A2/ W41L, ATP8A2/C94R, ATP8A2/D181Y. Graphs represent mean values ± s.d. (n = 3). c, Distributions of genetic alterations of TNFAIP3, PRDM1 and EPHA7 in the patients with TMEM30A mutation and deletion. The header includes status of TMEM30A mutation and heterozygous deletion. MT; mutation, CN; copy number. d, Distributions of recurrent mutation, COO subtypes and IPI groups in TMEM30A mutated and wild type DLBCL patients. The header includes the status of TMEM30A mutation and CNAs.
Extended Data Fig. 4 |
Extended Data Fig. 4 |. Prevalence and clinical impact of TMEM30A mutation.
a, b, Deep targeted sequencing data of transformed FL samples with TMEM30A mutation detected at the time of diagnosis or transformation (A). The affected positions of the TMEM30A are visualized in an integrative genomic viewer. Variant allelic frequencies are visualized in the pie charts per case (B). Those data demonstrate a fraction of variants at the time of diagnosis (upper row) and transformation (lower row). The number in the pie charts represents the coverage of sequencing. FL1179 exhibited the opposite pattern (T1-positive/T2-negative), however the variant was a missense mutation supported by relatively low coverage (five reads out of 81 (VAF=6%). (c–e) Subtype analysis of survival according to TMEM30A genetic alteration. Kaplan Meier curves represent TTP (upper) and OS (bottom) according to TMEM30A mutation in ABC-DLBCL (C), in GCB-DLBCL (D) and in IPI-low/low-intermediate group (E). P values were derived from two-sided log-rank test.
Extended Data Fig. 5 |
Extended Data Fig. 5 |. mRNA expression of TMEM30A, related flippases, scramblases and P4-ATPases in in vitro TMEM30A knockout cells.
a, A screenshot of a representative sequence trace file of a CRISPR-generated TMEM30A frameshift mutation in exon 1 (DOHH-2, MUT1). b, TMEM30A mRNA expression is reduced in 3 unique bi-allelic frame-shift mutations in Karpas422, compared with parental and single cell enriched controls. mRNA expression is normalized to GAPDH expression. Graphs represent mean values ± s.d. (n = 3). (c) mRNA expression of TMEM30A is ‘rescued’ in one unique bi-allelic TMEM30A mutant, by ectopically expressing a stable insertion of a TMEM30A cDNA. Graphs represent mean values ± s.d. (n = 3). d, mRNA levels of different scramblases (PLSCR1-5; ANO1-10, XKR1-9), flippases (TMEM30A-C) and P4-ATPases in Karpas422 (left panel) and NUDUL-1 (right panel) native (WT, CON) and TMEM30A−/− (MUT) cell lines. Protein family members are categorized, and the heat map values show log-normalized expression by RNA-seq. e, XKR8 and ANO6 mRNA expression is reduced in 3 unique bi-allelic (XKR8) and mono-allelic (ANO6) frame-shift mutations in TMEM30A−/− and wildtype controls. mRNA expression is normalized to GAPDH expression. Graphs represent mean values ± s.d. (n = 3). All P values are based on a paired two-tailed Student’s t test.
Extended Data Fig. 6 |
Extended Data Fig. 6 |. BCR activation, mobility and clustering in NU-DUL-1 and DOHH-2 as measured by single particle tracking analysis.
a, Single-state diffusion coefficients and b, confinement-diameters are shown for both cell lines, and c, BCR tracks and d, transition rates are measured for DOHH-2. The dots indicate median values; lines indicate 95% confidence intervals ((n=3, DOHH-2) (n = 2, NU-DUL-1). (E-F) TMEM30A mutation does not alter CD19 diffusion and confinement diameters. Cells were labelled with anti-CD19 Fab-Cy3, settled onto poly-l-lysine coated coverslips and imaged for 10 s at 33 Hz. e, Single-state diffusion coefficients were calculated for all tracks and cumulative frequency curves are shown. The dots on the curves indicate the median values and are reported in brackets. Total number of tracks analyzed in each condition is shown above the plot. (f) The cumulative frequency curves of the confinement-diameters with the median values (dots on the curves) indicated in brackets. g, BCR activation of DLBCL cell lines following incubation with F(ab)2 fragments does not lead to an increase in apoptotic signaling through caspase 3 activation, measurable by western blot analysis. Cells (Karpas422) pretreated with vincristine were included as a positive control. Cropped images from the same Western blot are shown. B-actin is used as a loading control. Experiments were repeated independently three times with similar results. Source Data Extended Fig. 6. h, Ca2+ mobilization was measured in wild type (WT) and TMEM30A−/− NU-DUL-1, DOHH-2 and Karpas422 cells, following HBSS, F(ab)2 addition (10 and 40 μg/ml) and ionomycin. Graphs represent mean values ± s.d. (n = 3). Significance is evaluated using one-way ANOVA.
Extended Data Fig. 7 |
Extended Data Fig. 7 |. B-cell signalling following ibrutinib treatment in B cell lymphoma lines with TMEM30A loss-of-function mutation.
a, DOHH-2 toxicity of ibrutinib after 24 hours incubation. Toxicity between wildtype (red line) and TMEM30A−/− (blue line) was measured by WST1 colormetric assays (mean of triplicate is shown). P value is based on an unpaired two-tailed Student’s t test. b, Comparisons of CRISPR screen score (CSS) between ibrutinib-sensitive vs -resistance cell lines in publicly available dataset. CSS was defined as the number of standard deviations away from the average effect of inactivating a gene. The differences of CSS in TMEM30A-tageting was not observed, while there are strong differences of CSS in other genes known to be involved in the determination of ibrutinib-sensitivity (for example MYD88, MEF2B etc) c, Ca2+ mobilization was measured in wildtype (WT) and TMEM30A−/− DOHH-2 cells, following HBSS, F(ab)2 and ionomycin, with or without (UT) overnight pretreatment with ibrutinib. Graphs represent mean values ± s.d. (n = 3 (HBSS), n = 6 (F(ab)2), n = 3 (iono)). d, Effects of ibrutinib pretreatment on F(ab)2 fragment PS exposure in DOHH-2 TMEM30A−/− and native control, measured by annexin V-APC binding. Addition of ibrutinib to F(ab)2 fragment stimulated TMEM30A−/− cells shows a significant reduction in PS exposure. Graphs represent mean values ± s.d. (n = 4). P value is based on a two-way ANOVA test. e, Induction of CD25 (left panel) and CD23 (right panel) following BCR activation in Karpas422 cell lines with (MUT) or without (CON) a biallelic loss-of function in TMEM30A. Surface marker expression was measured by flow cytometry, using protein specific antibodies. Graphs represent mean values ± s.d. (n = 3 (CD25), n = 5 (CD23)). P value is based on an unpaired two-tailed Student’s t test. f, Activation by phosphorylation of AKT and ERK1/2 in Karpas422 and NU-DUL-1 native and TMEM30A−/− cells, detected by Western blot analysis, following overnight F(ab)2 fragment stimulation. Cropped images from the same Western blot are shown. Unphosphorylated AKT or ERK1/2 is used as a loading control. Experiments were repeated independently three times with similar results. Source Data Extended Fig. 7.
Extended Data Fig. 8 |
Extended Data Fig. 8 |. TMEM30A loss-of-function enhanced survival and increased macrophage engulfment following vincristine and CD47 blockade treatment.
a, Proliferation rates of native (blue line) and TMEM30A−/− (red line) DOHH-2 cells, measured over 3 days by WST1 absorbance. Cell numbers were extrapolated from a WST1 standard curve, using known quantities of DOHH-2. P value is based on an unpaired two-tailed Student’s t test. b, Xenotransplantation models of DOHH-2 cells with parental or TMEM30A−/− subcutaneously injected into NSG mice (5 per group). Vincristine treatment (0.1 mg/kg) or saline control (untreated) was administered when tumor volumes per group reached 100 mm3. Line graphs show tumor growth (mm3) over time (days). Graphs represent mean values ± s.d. P values are based on a paired two-tailed Student’s t test. P<0.05. c, The comparison of macrophage counts in tumor tissue from untreated DOHH-2 xenotransplantation models, visualized by CD68 antibody with H&E counter staining, per tissue within randomly selected 400x high power field regions per tumor from 3 separate mice per group. Graphs represent mean values ± s.d. (n = 12 (control), n = 18 (MT)). P values are based on a paired two-tailed Student’s t test. d, Xenotransplantation models of DOHH-2 cells with parental or TMEM30A−/− subcutaneously injected into NSG mice (10 per group). TTI-621 treatment (10 mg/kg) or TTI-402 (6.67 mg/kg) was initiated when tumor volumes per group reached 100 mm3. Normalized mean tumor growth (mm3) over time (days) starting at injection time. Graphs represent mean values ± s.d. P values are based on a paired two-tailed Student’s t test. P<0.05, ⋆⋆P<0.01.
Extended Data Fig. 9 |
Extended Data Fig. 9 |. In vitro and in vivo macrophage association and infiltration of A20 Tmem30A loss-of-function in Balb/c.
a, Syngeneic mouse modeling in Balb/c mice with Tmem30a−/− or wildtype (Tmem30a+/+) A20 cells. Proliferation rates of Tmem30a−/− (red line) and wildtype (blue line) A20 cells, measurable over 4 days by WST1 absorbance. P values are based on an unpaired two-tailed Student’s t test (n = 6). b, Comparison of PS exposure in Tmem30a−/− or wildtype A20 cells, measured by annexin V-APC binding. Graphs represent mean values ± s.d. (n = 8) P values are based on an unpaired two-tailed Student’s t test. c, Syngeneic mouse models of A20 cells with wildtype or Tmem30a−/− cells intravenously injected into Balb/c mice (5 per group). Kaplan-Meier plots show overall survival of Balb/c inoculated mice. P value is based on a Mantel-Cox test. d, Organ weight of livers from Balb/c mice intravenously injected with Tmem30a−/− or wildtype cells. All mice were sacked at the first presentation of abdominal distention in the control group (‘early sac’). Graphs represent mean values ± s.d. (n = 5). P values are based on an unpaired two-tailed Student’s t test. (E-F) Observation of tumor infiltrate in mice injected with Tmem30a−/− or wildtype cells at early sac. e, Blue or red filled column indicates positive tumor infiltration in wildtype or Tmem30a−/− cells, with blank indicating no tumor infiltration. f, H&E staining of each organ at early sac (liver, spleen, lung, and bone marrow) with inset of B220 IHC in the lung specimen. N = 5 mice per group. g, The comparison of macrophage counts in tumor tissue from subcutaneous injected A20 Tmem30a−/− and wildtype cells, visualized by F4/80 antibody with H&E counter staining, per tissue within 3 randomly selected 400x high power field regions per tumor from 3 separate mice per group. Graphs represent mean values ± s.d. P values are based on an unpaired two-tailed Student’s t test. h, i, Comparison of gene expression between tumor tissue from Tmem30a−/− and control injection groups. (N = 3 RNA samples from each mouse group). To generate P values (padj/FDR), we used a Wald test of the coefficients fit with a negative binomial GLM. The P values are two-sided and have all been adjusted for multiple comparisons using the Benjamini-Hochberg method. (H) Volcano plot of difference in gene expression between Tmem30a−/− and control groups (x-axis; log2 fold change of difference) and significance (y-axis). Red dots show the genes with significant difference (FDR < 0.05). (I) Dot plots show gene expression (FPKM) of Il4i1, Tmem30a and Xkr5 between Tmem30a−/− and control groups.
Fig. 1 |
Fig. 1 |. Impact of genetic alterations on prognosis and gene expression in DLBCL.
a,b,c, Forest plots summarize the results of univariate analyses (TTP and OS) for mutated genes and representative copy-number alterations (CNAs) within GISTIC regions, which are significantly associated with prognosis (unadjusted P value < 0.05), in all-DLBCL (n = 347) (a), in ABC-DLBCL (n = 104) (b) and GCB-DLBCL (n = 183) (c). Hazard ratios and 95% confidence intervals are shown. Colored circles represent significant hazard ratios, and colored genes are significantly associated with both TTP and OS (blue, favorably prognostic; red, unfavorably prognostic). d, Frequency of selection of the genetic feature by the Cox–lasso predictive models generated in 238 iterations of leave-one-out cross validation. COO and IPI are included as control variables in all models. The bar plot (blue, favorable outcome; red, unfavorable outcome) shows the genes repeatedly selected in the 238 models. e, xseq-derived cis and trans effects of loss-of-function and hotspot mutations in all DLBCL tumors and each COO subtype (left). P(D) represents the probability that a recurrently mutated gene influences gene expression across the population of patients. A larger P(D) value represents a stronger inferred effect. Histogram (right) shows the number of each mutation in COO subtypes. f, Frequencies of occurrence of hemizygous deletion or copy-neutral loss of heterozygosity (cnLOH) in the loss-of-function mutated tumors. g, Proportions of mutation type in recurrently mutated genes. Mutated genes with frequency >10% are depicted.
Fig. 2 |
Fig. 2 |. Genetic characterization of TMEM30A.
a, TMEM30A protein domain and the locations of 42 mutations identified in this study, affecting 38 DLBCL tumors, as well as 5 mutations found in transformed folllicular lymphoma (FL) samples in our previous study20. Multiple mutations affecting the same position are annotated. b, Schematic structure of the P4-ATPase and TMEM30A subunits consisting of two membrane-spanning domains with a large extracellular loop; 95% of variants are localized to extracellular domains, which are required for assembly with P4-ATPase. Flippase activities are annotated with colored stars. c, Distribution of DLBCL tumors harboring TMEM30A mutations, heterozygous deletions (Het-Del), and cnLOH, TMEM30A mutation without CNAs and heterozygous deletion without mutations. d, Heterozygous deletions were validated using fluorescence in situ hybridization (FISH) assays in all nine analyzed samples. Two-color FISH assays use a red probe interrogating TMEM30A and a green probe interrogating PIM1 on the chromosomal 6p arm as a reference. e, SNP6.0 copy-number heat map illustrating broad deletions affecting TMEM30A, EPHA7, PRDM1 and TNFAIP3 locus (dense blue line and arrow) on chromosome 6q11-24 in representative DLBCL tumors. f, Distribution of recurrent mutations, COO subtypes and IPI groups in 38 TMEM30A-mutated DLBCL tumors (left). The header includes the status of TMEM30A mutation and CNAs. Histograms (right) show the frequency of each alteration within TMEM30A mutated (dark gray) and non-mutated tumors (light gray). Two-sided Fisher’s exact test was used to compare these frequencies according to the two groups. *P < 0.05, ***P < 0.001. g, Evaluating the evolutionary timing of TMEM30A mutations and 6q deletions. Each column depicts an evolutionary timing scenario for TMEM30A mutations and 6q deletions.
Fig. 3 |
Fig. 3 |. Prevalence and clinical impact of TMEM30A mutation.
a, Bar plot showing the frequencies of TMEM30A mutation in lymphomas and other hematological malignancies, based on the previous literature and publicly available datasets. b, Deep targeted sequence data of a representative transformed FL case (FL1004) for the affected position of the TMEM30A visualized in integrative genomics viewer (left) and variant allelic frequency visualized in pie chart (right), demonstrating the proportion of variant reads (variation indicated in green) at the time of diagnosis (FL-Grade 1), transformation (DLBCL) and relapse after transformation (FL-Grade 2). The time between initial diagnosis (FL-Grade1) and first relapse (FL-transformed) and between first relapse and second relapse (FL-Grade 2) is shown in years (y). c–e, Kaplan–Meier curves represent TTP (top) and OS (bottom) according to TMEM30A mutation in all DLBCL (c), in IPI-high/high-intermediate group (d) and according to TMEM30A genetic status in all DLBCL (e). P values were derived from two-sided log-rank test (c,d) and Cox proportional-hazards model (e).
Fig. 4 |
Fig. 4 |. BCR mobility and B-cell signaling is increased in B-cell lymphoma lines with TMEM30A loss-of-function mutation.
a, Abundance of externalized PS was measured through flow cytometry by annexin V-APC binding in Jurkat, DOHH-2, Karpas422 and NU-DUL-1 under optimal growth conditions, comparing wild type (red) and TMEM30A−/− (blue). b–e, BCR mobility and clustering in Karpas422 as measured by single-particle tracking analysis. All experiments were repeated independently three times with similar results. b, Cells were labeled with anti-IgG Fab–Cy3, settled onto poly-l-lysine-coated coverslips and imaged for 10 s at 33 Hz by total internal reflection microscopy. A representative experiment with Karpas422 is shown here. Single-state diffusion coefficients were calculated for all tracks, and cumulative frequency curves are shown. The dots on the curves indicate the median values and are reported in brackets. The total numbers of tracks analyzed were 5,098 (wild type), 4,230 (control), 4,250 (mutant 1) and 2,704 (mutant 6). c, The cumulative frequency curves of the confinement diameters with the median values (dots on the curves) indicated in brackets. d, BCR tracks were analyzed using a two-state HMM model to subdivide trajectories into slow-diffusing (red) and fast-diffusing (blue) segments, with dynamic transitions between these two inferred behaviors. Depicted are representative static trajectories of IgG BCRs that were segmented into inferred slow and fast states. The fraction of fast states from all tracks is indicated in blue. Scale bar, 5 μm. e, The transition rates (Kslow→fast, Kfast→slow) between the two states are shown. The dots indicate median values; lines indicate 95% confidence intervals (n = 3). f, Effects of overnight antigen stimulation by F(ab)2 fragments on (i) PS exposure in TMEM30A−/− and wild-type control cells, measured by annexin V–APC binding, (ii) induction of surface markers CD69 (Karpas422) and (iii) phosphorylation of AKT (NU-DUL-1), measured by flow cytometry. Graphs represent mean values ± s.d. ((i) n = 8 (Karpas422), n = 9 (DOHH-2), n = 6 (NU-DUL-1), (ii) n = 9 and (iii) n = 6). All P values are based on an unpaired two-tailed Student’s t-test. g, Alterations in PS externalization following (i) ionomycin and (ii) F(ab)2 fragment stimulation following TMEM16F knockdown in NU-DUL-1 wild-type and TMEM30A−/− cells. Graphs represent mean values ± s.d. (n = 6). All P values are based on an unpaired two-tailed Student’s t-test.
Fig. 5 |
Fig. 5 |. TMEM30A loss of function mediated increased drug uptake in DLBCL.
a, Effects of vincristine and doxorubicin, both components of the R-CHOP regimen, on PS exposure in Karpas422 TMEM30A−/− and wild-type control. The top panel (i) compares wild-type (red) and TMEM30A−/− (blue) events counted by flow cytometry. The lower panel (ii) compares TMEM30A−/− expressing recombinant TMEM30A (rhTMEM30A, red) and a transformation empty-vector control (Empty, blue). b, Increased apoptotic signaling following incubation with doxorubicin as measurable by caspase-3 activation by western blot analysis (i), and vincristine, as measurable by a G2/M block through flow cytometry (ii), was compared in Karpas422 TMEM30A−/−, wild type and TMEM30A transformants. Cropped images from the same western blot are shown. β-actin is used as a loading control. See Source Data Fig. 5. Experiments were repeated independently three times with similar results. c, Doxorubicin uptake in Karpas422 TMEM30A−/−, wild type and TMEM30A transformants over time was detected by flow cytometry. Graphs represent mean values ± s.d. (n = 4). All P values are based on an unpaired two-tailed Student’s t-test. d, Externalized PS following increasing doxorubicin incubation times was measured in gated B-cells from DLBCL patient tumor biopsies expressing normal or TMEM30A-null (summary bar plot, left; movement of each sample, right). Graphs represent mean values ± s.d. (n = 3). P value is based on a two-way ANOVA test. e, Doxorubicin uptake in gated B-cells from DLBCL patient tumor biopsies was measured over time by flow cytometry. Graphs represent mean values ± s.d. (n = 3). P value is based on a two-way ANOVA test. f, Alterations in PS externalization (i) and doxorubicin (ii) uptake including XKR8 knockout in NU-DUL-1 wild type (WT) and TMEM30A−/− cells over time.
Fig. 6 |
Fig. 6 |. TMEM30A loss of function enhanced survival with treatment and increased macrophage infiltration in mouse models.
a, Xenotransplantation models of DOHH-2 cells with wild-type or TMEM30A−/− subcutaneously injected into NSG mice (5 per group). Vincristine treatment (0.1 mg kg−1) or saline control (untreated) was administered when tumor volumes per group reached 100 mm3. Kaplan–Meier plots showing overall survival of NSG xenograft mice. P value is based on a Mantel-Cox test. P < 0.05, ⋆⋆P < 0.01. b, Liver tissues from A20 wild-type Tmem30a or Tmem30a−/− syngeneic mouse models (n = 5 mice per group), sacked within first palpable presentation of tumor growth (‘early sac’, ~day 20), were stained with hematoxylin and eosin (H&E), B220, Ki-67, F4/80 and CD163. c, Macrophage count comparison per tissue within 3 randomly selected ×400 high-power field (HPF) regions per tumor from 5 separate mice per group with early sac (A20 model). P value is based on an unpaired two-tailed Student’s t-test. d, In vitro macrophage engulfment assays of wild-type or TMEM30A−/− DOHH-2. Cells were pretreated with 1 μM TTI-621 or TTI-402 preceding coculture with macrophages. The phagocytic index was measured by flow cytometry. Graphs represent mean values ± s.d. (n = 4). All P values are based on a paired two-tailed Student’s t-test. e,f, Xenotransplantation models of DOHH-2 cells with wild-type or TMEM30A−/− subcutaneously injected into NSG mice (n = 10 mice per group). TTI-621 treatment (10 mg per kg body weight) or TTI-402 (6.67 mg per kg body weight) was initiated when tumor volumes per group reached 100 mm3. Kaplan–Meier plots showing overall survival of NSG xenograft mice. e, Visualization and quantitation of engulfed B cells in macrophages as detected by CD68 antibody with H&E counter staining. Two representative images of engulfment from TTI-621 treated TMEM30A−/− group (i). Macrophage engulfment counts from each mouse model treatment group (ii). Graphs represent mean values ± s.d. (n = 15 (control), n = 9 (mutant)). All P values are based on a paired two-tailed Student’s t-test. f, Kaplan–Meier plots showing overall survival of NSG xenograft mice. P value is based on a Mantel–Cox test. P < 0.05, ⋆⋆⋆P < 0.001; n.s., not significant.

References

    1. Swerdlow SH et al.The 2016 revision of the World Health Organization (WHO) classification of lymphoid neoplasms. Blood 127, 2375–2390 (2016). - PMC - PubMed
    1. Coiffier B et al.CHOP chemotherapy plus rituximab compared with CHOP alone in elderly patients with diffuse large-B-cell lymphoma. N. Engl. J. Med 346, 235–242 (2002). - PubMed
    1. Sehn LH et al.Introduction of combined CHOP plus rituximab therapy dramatically improved outcome of diffuse large B-cell lymphoma in British Columbia. J. Clin. Oncol 23, 5027–5033 (2005). - PubMed
    1. Alizadeh AA et al.Distinct types of diffuse large B-cell lymphoma identified by gene expression profiling. Nature 403, 503–511 (2000). - PubMed
    1. Rosenwald A et al.The use of molecular profiling to predict survival after chemotherapy for diffuse large-B-cell lymphoma. N. Engl. J. Med 346, 1937–1947 (2002). - PubMed

Publication types

MeSH terms