. 2019 Dec 10;6(12):696-701.
doi: 10.1021/acs.estlett.9b00599. Epub 2019 Nov 11.

Indoor versus Outdoor Air Quality during Wildfires

Affiliations

Indoor versus Outdoor Air Quality during Wildfires

K P Messier et al. Environ Sci Technol Lett. .

Abstract

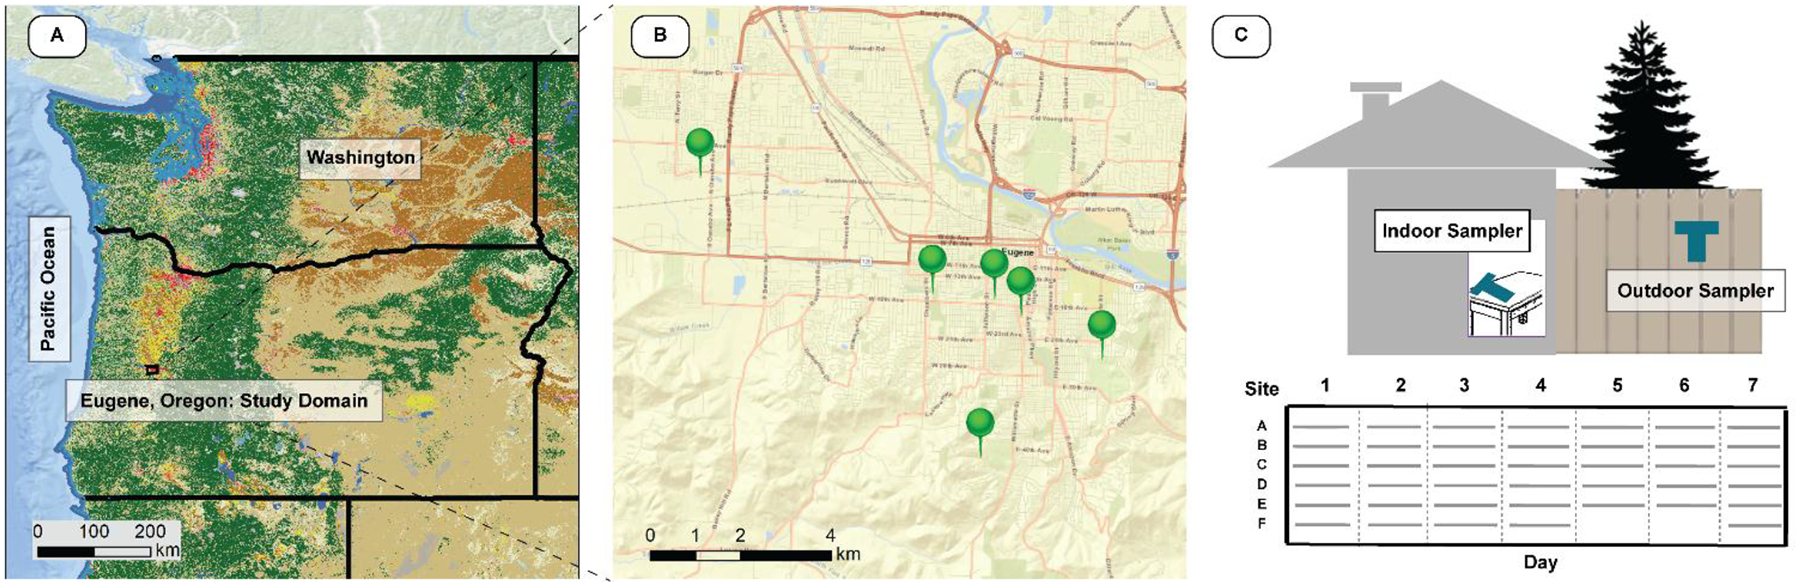
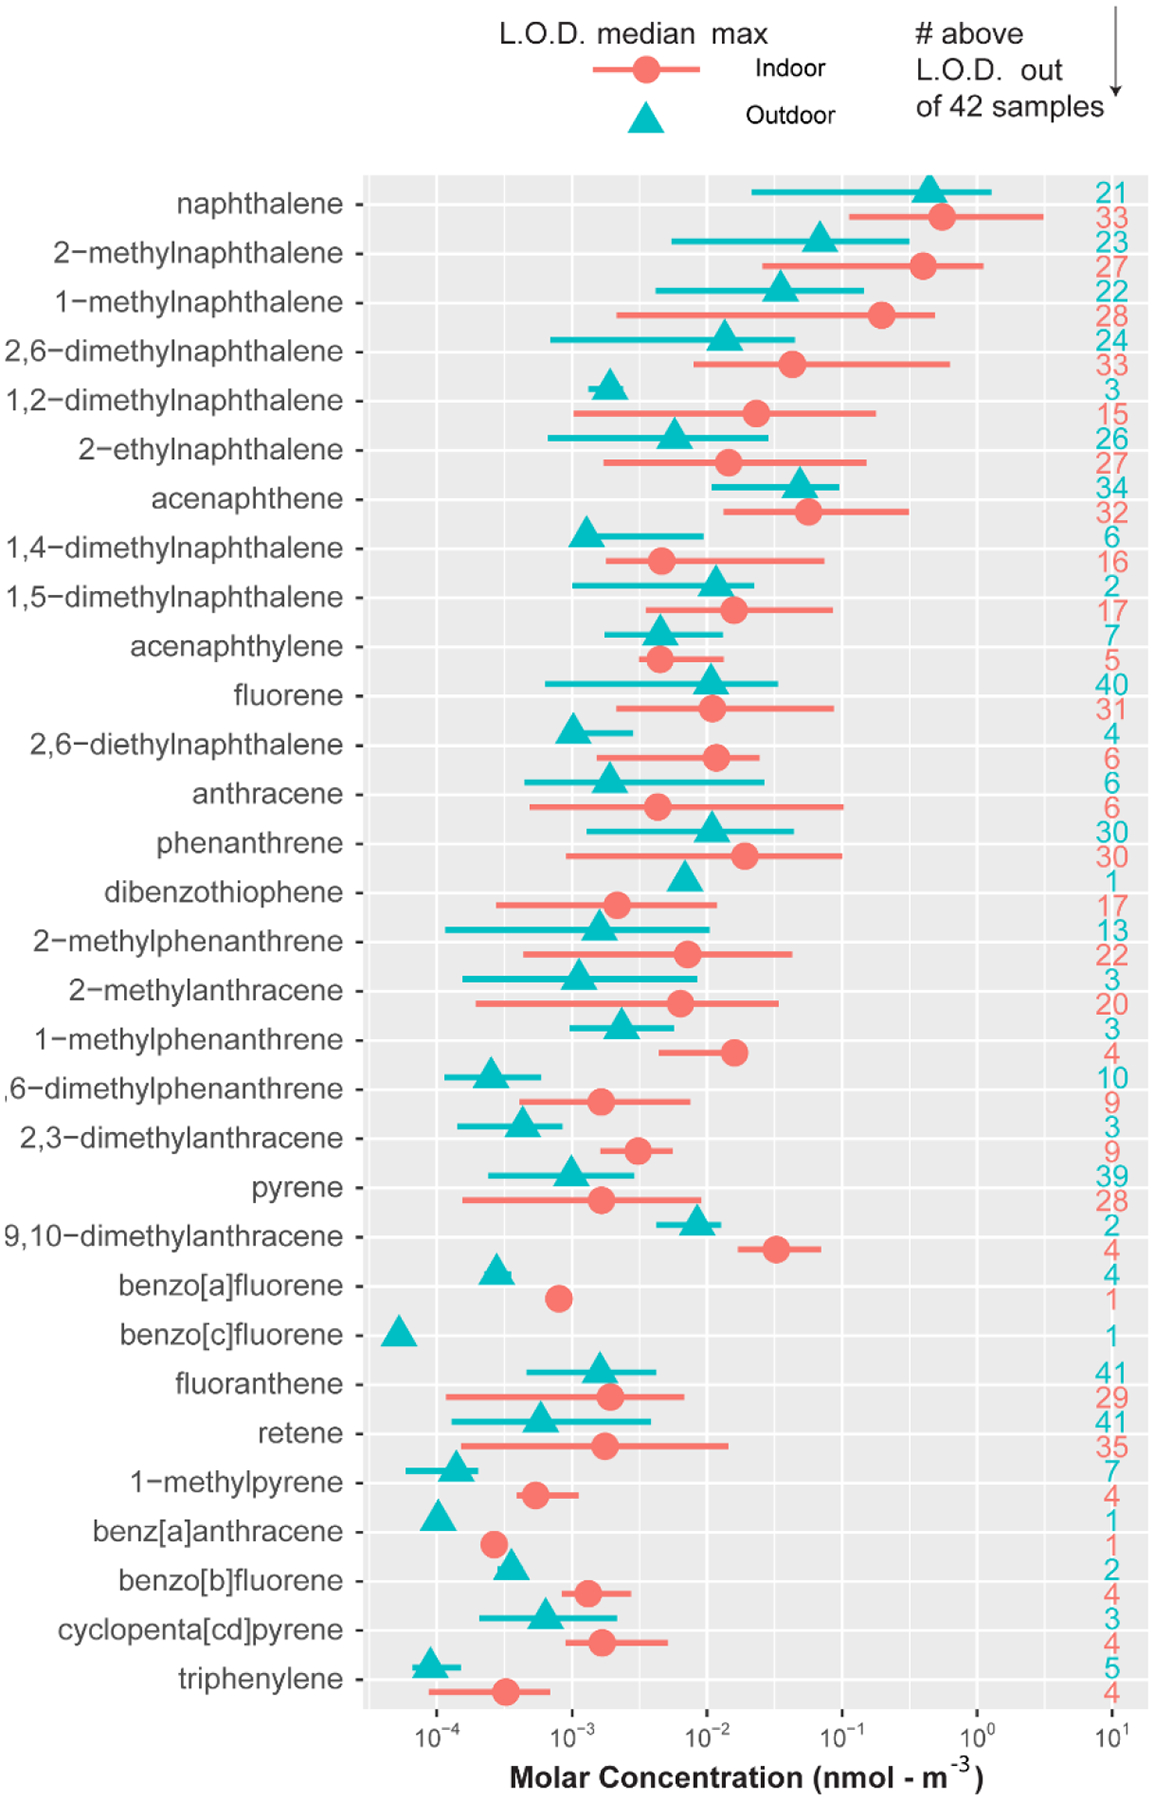
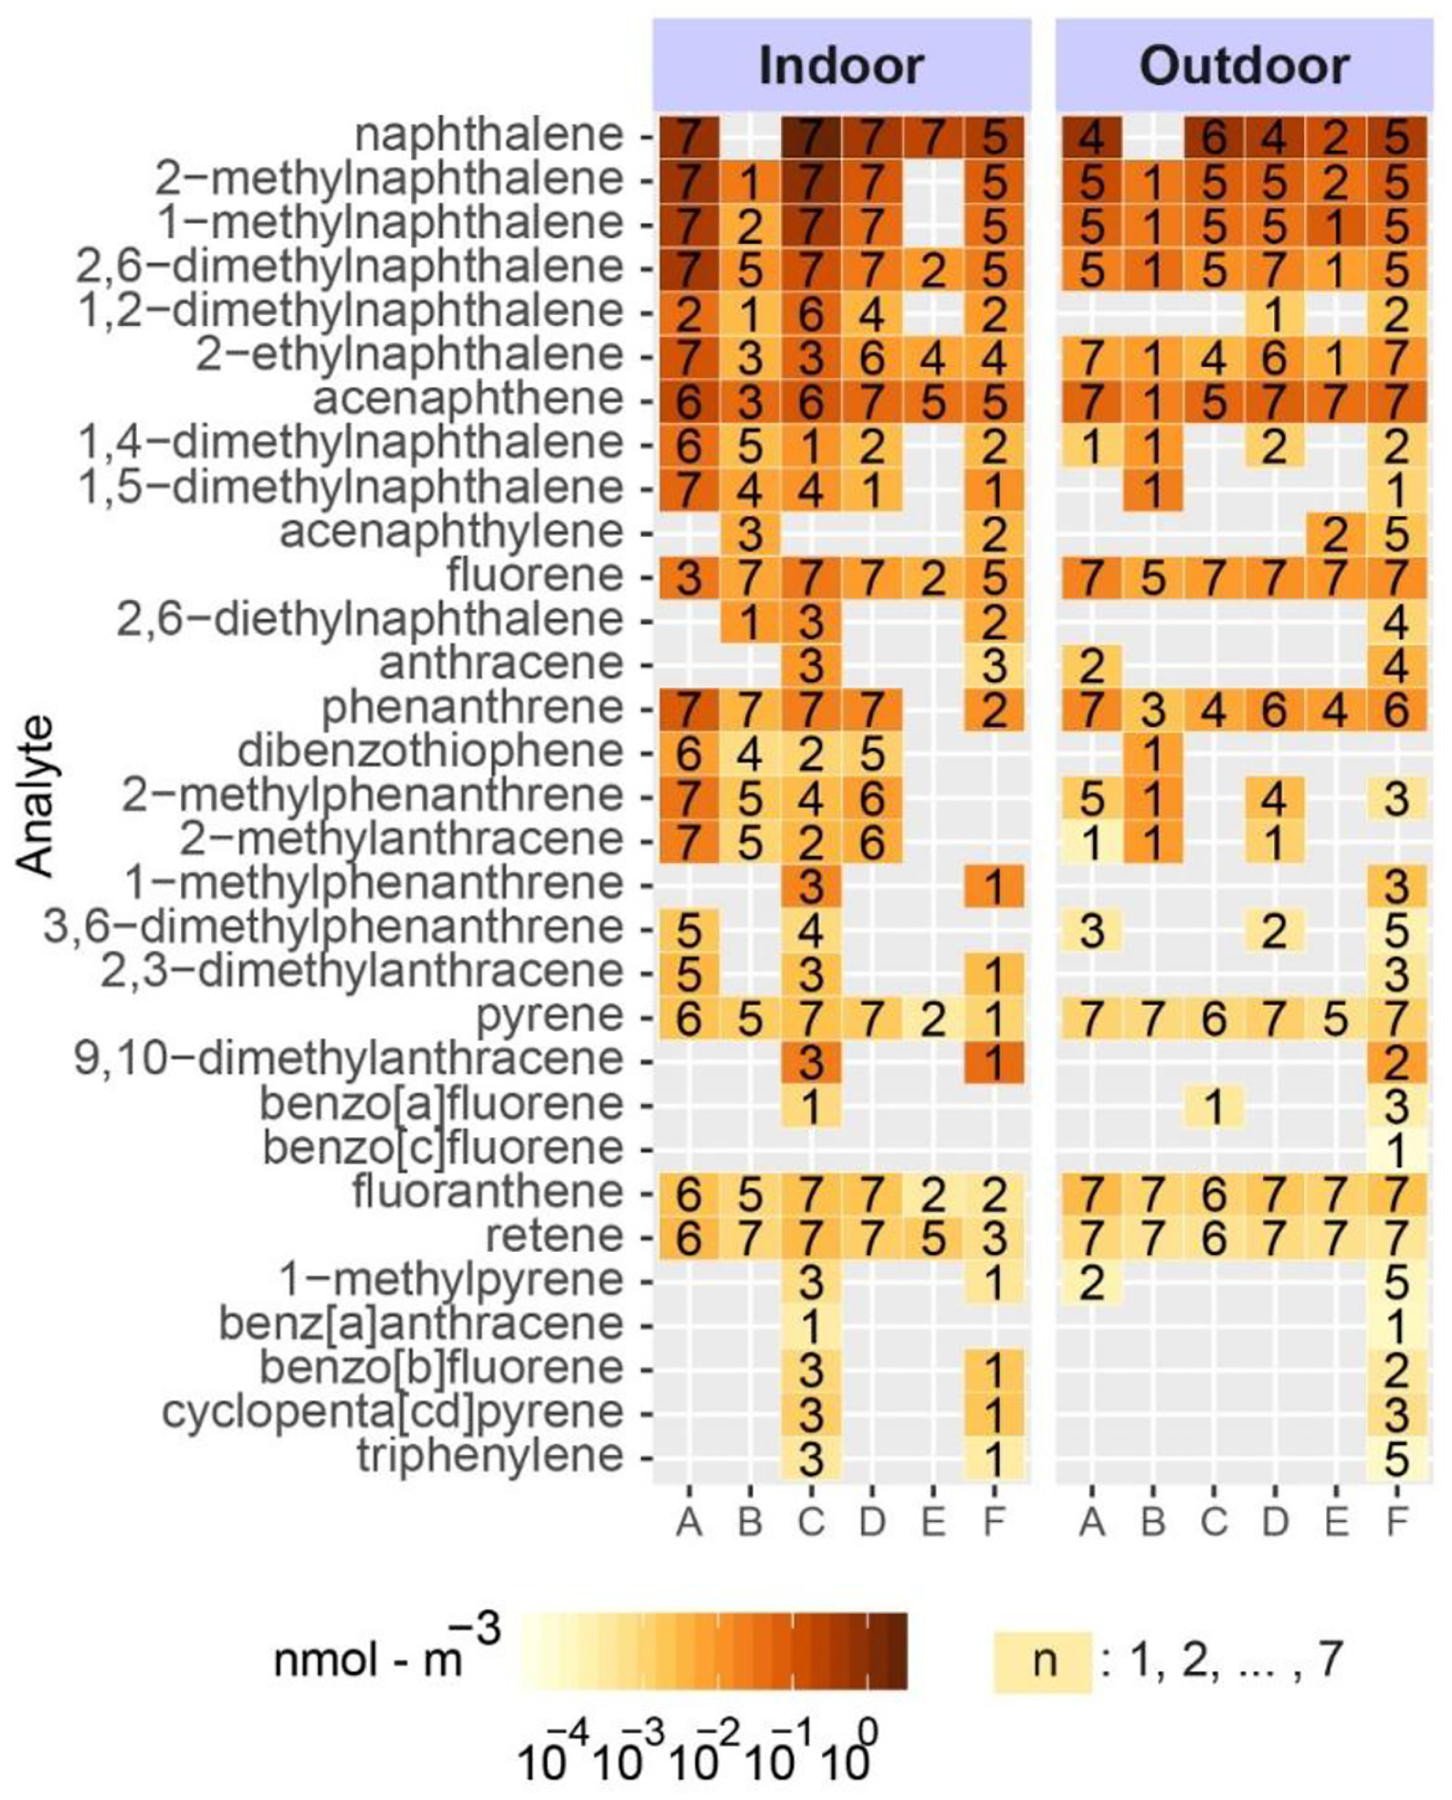
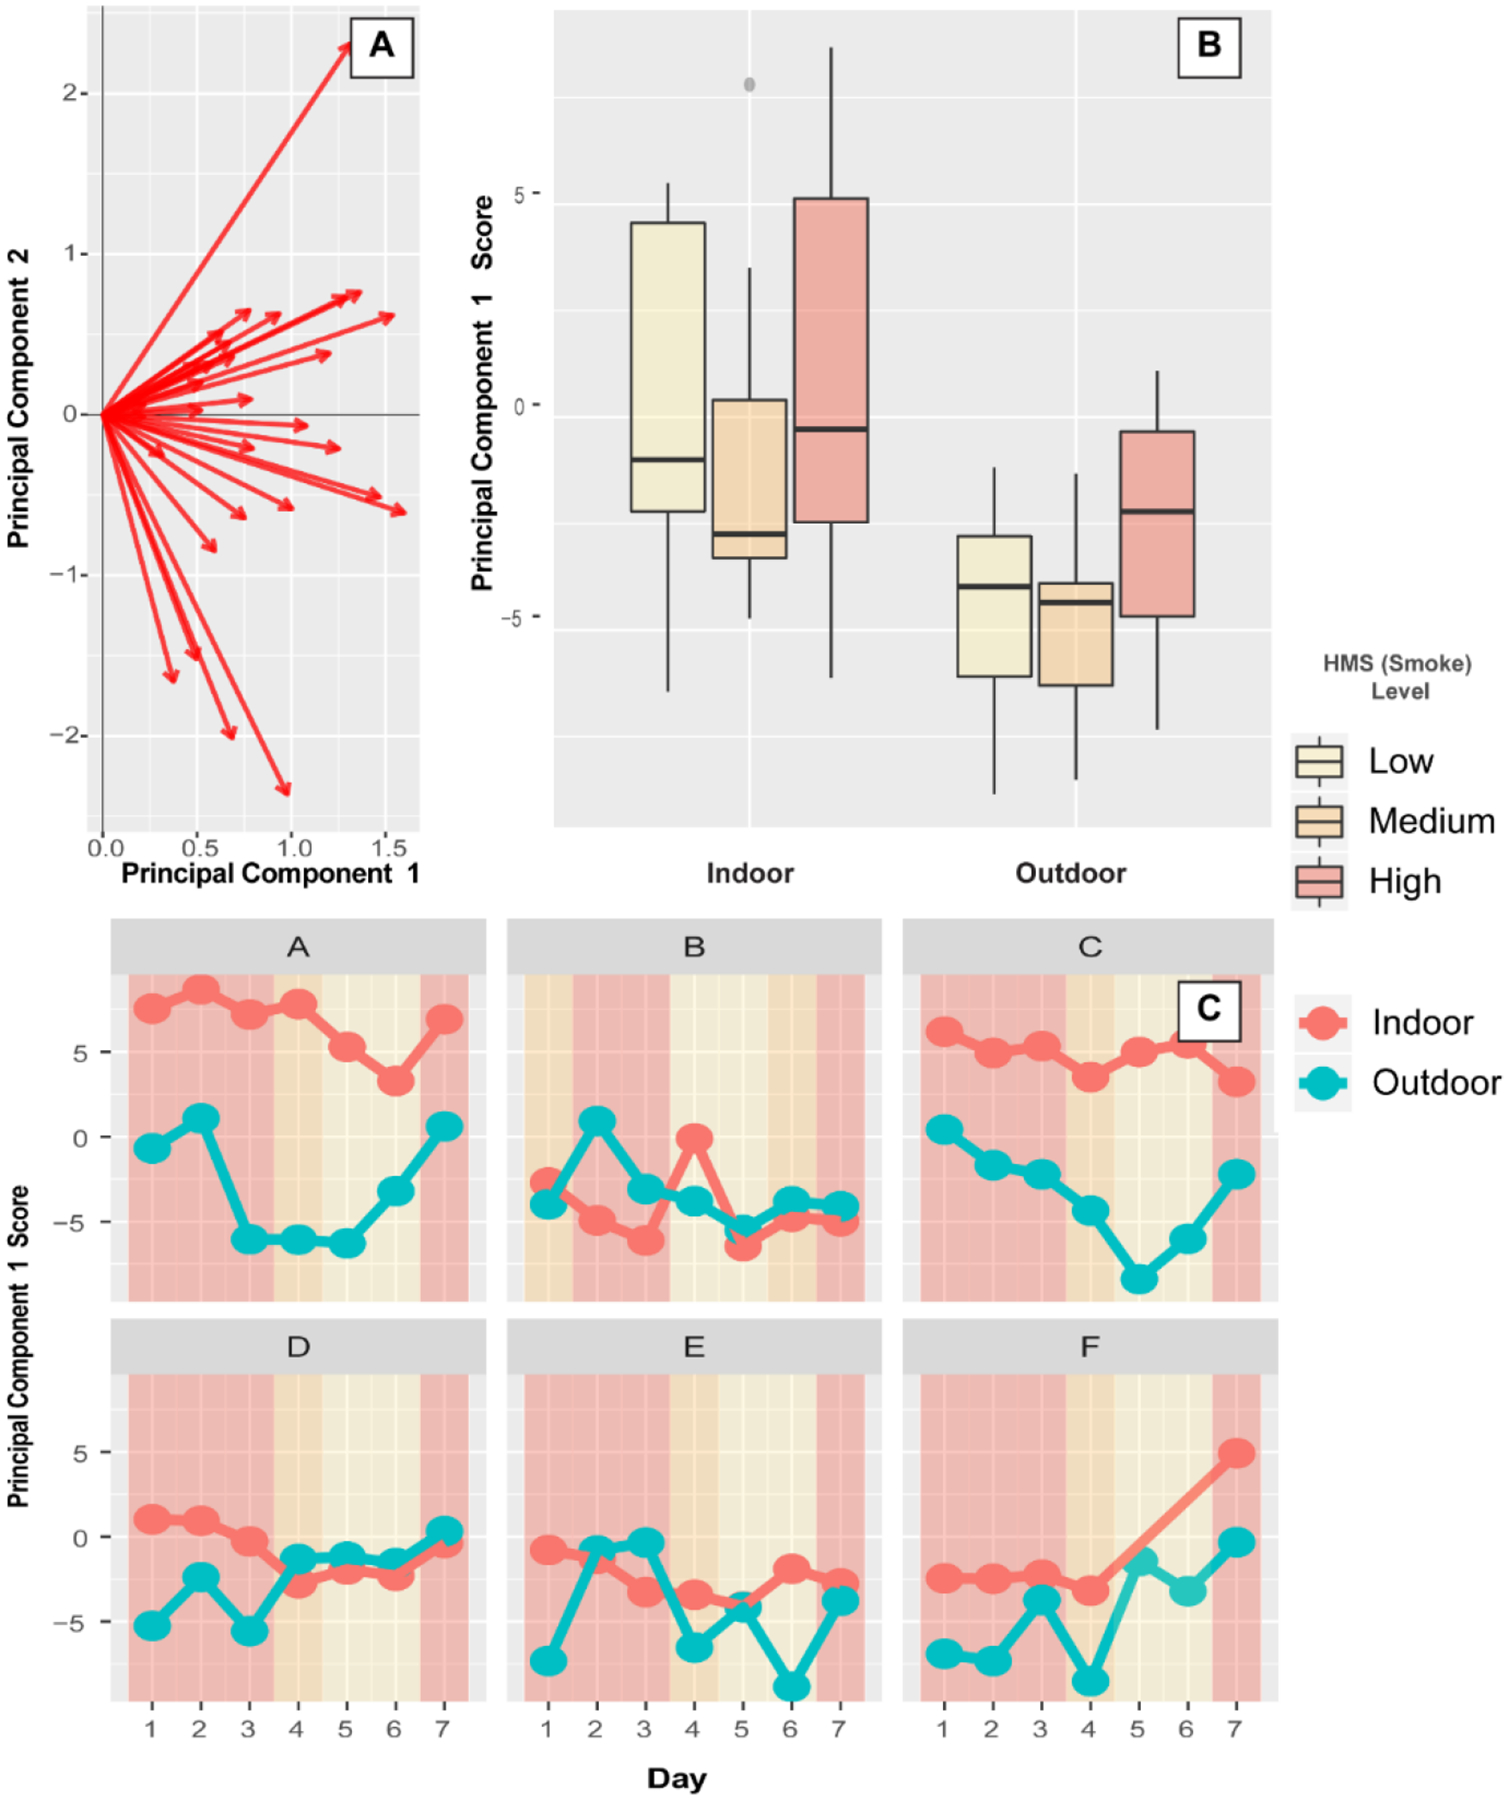
The human behavioral modification recommendations during wildfire events are based on particulate matter and may be confounded by the potential risks of gas-phase pollutants such as polycyclic aromatic hydrocarbons (PAHs). Moreover, the majority of adults spend over 90 percent of their time indoors where there is an increased concern of indoor air quality during wildfire events. We address these timely concerns by evaluating paired indoor and outdoor PAH concentrations in residential locations and their relationship with satellite model-based categorization of wildfire smoke intensity. Low-density polyethylene passive air samplers were deployed at six urban sites for 1 week in Eugene, Oregon with matched indoor and outdoor samples and 24 h time resolution. Samples were then quantitatively analyzed for 63 PAH concentrations using gas-chromatography-tandem mass spectrometry. A probabilistic principal components analysis was used to reduce all 63 PAHs into an aggregate measure. Linear regression of the first principal component against indoor versus outdoor shows that indoor gas-phase PAH concentrations are consistently equal to or greater than outdoor concentrations. Regression against a satellite-based model for wildfire smoke shows that outdoor, but not indoor gas-phase PAH concentrations are likely associated with wildfire events. These results point toward the need to include gas-phase pollutants such as PAHs in air pollution risk assessment.


Figures

Figure 1.
Figure 1.. Site domain and study design schematic.
(A) Regional domain of study area. The colors correspond to the land cover classifications in the National Land Cover Database. See https://www.mrlc.gov/data/legends/national-land-cover-database-2016-nlcd2016 legend for the color legend. The black box inset shows the local area of the study domain in panel B. (B) Study domain with the six sample locations in large green circles. The circles are intentionally large and randomly shifted a small amount to mask the location. (C) A study design schematic that shows each site included an indoor and an outdoor sampler that were each sampled for seven 24 h periods. Map layers (A,B) are based on OpenStreetMaps.
Figure 2.
Figure 2.. Individual PAH limit of detection (LOD), median, and maximum.
PAH concentrations in indoor and outdoor air environments. Dots are the median concentration. The left end of the line is the limit of detection (LOD), and the right end of the line is the maximum observed value. PAHs with only samples observed below LOD are shown with LOD as a vertical line. The numbers down the right side are the number of samples observed above the LOD, out of a total of 42 for each indoor/outdoor PAH. PAHs are sorted (top-to-bottom) by increasing Log Koa coefficient. PAH by environment with no samples observed above LOD are not shown.
Figure 3.
Figure 3.. Individual PAH median concentrations by site and indoor/outdoor.
A heatmap of observed individual PAH median concentrations (nmol – m−3), by site (A-F) and by indoor versus outdoor. The number of samples (n) per site per day are shown as a number in the center of each cell (max n possible is 7). PAHs are sorted from top to bottom by increasing Log Koa. PAHs with all observations below the LOD are not shown.
Figure 4.
Figure 4.. Principal Component Boxplot and Time Series by Indoor/Outdoor Environment and Wildfire Impact.
(A) The probabilistic principal component 1 and 2 loadings. All but 3 loadings for component are positive indicating a positive correlation between the majority of PAHs. This allows for an easy interpretation of principal component score 1 as an aggregate measure of all PAHs. (B) Boxplot of principal component 1 score versus indoor/outdoor and by the 3 levels of wildfire smoke measured in the NOAA Hazard Mapping System (shaded colors). (C) A time series plot of principal component 1 scores by day (24 h integrated samples) and by indoor/outdoor environment. The same colors in B, showing the hazard mapping system level, are displayed as the background color.

References

    1. Brenkert-Smith H; Meldrum JR; Champ PA; Barth CM Where You Stand Depends on Where You Sit : Qualitative Inquiry into Notions of Fire Adaptation. Ecol. Soc 2017, 22, 7.
    1. Thomas D; Butry D; Gilbert S; Webb D; Fung J NIST Special Publication 1215. The Costs and Losses of Wildfires A Literature Review; 2017. 10.6028/NIST.SP.1215. - DOI
    1. Finlay SE; Moffat A; Gazzard R; Murray V Health Impacts of Wildfires. PLoS Curr. 2012, 4 10.1371/4f959951cce2c. - DOI - PMC - PubMed
    1. Reid CE; Brauer M; Johnston FH; Jerrett M; Balmes JR; Elliott CT Critical Review of Health Impacts of Wildfire Smoke Exposure. Environ. Health Perspect. 2016, 124, 1334–1343. 10.1289/ehp.1409277. - DOI - PMC - PubMed
    1. Parry M; Palutikof J; Adger N; Agrawala S; Alcamo J; Cramer W; Murdiyarso D Technical Summary: Climate Change 2007: Impacts, Adaptation and Vulnerability. Contribution of Working Group II to the Fourth Assessment Report of the Intergovernmental Panel on Climate Change. In Cambridge University Press; Parry M, Canziani OF, Palutikof J, Eds.; Cambridge, UK, 2007; pp 23–78.

LinkOut - more resources