

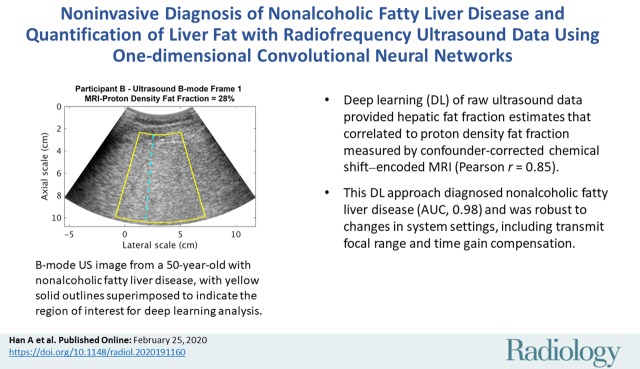
Noninvasive Diagnosis of Nonalcoholic Fatty Liver Disease and Quantification of Liver Fat with Radiofrequency Ultrasound Data Using One-dimensional Convolutional Neural Networks
- PMID: 32096706
- PMCID: PMC7193902
- DOI: 10.1148/radiol.2020191160
Noninvasive Diagnosis of Nonalcoholic Fatty Liver Disease and Quantification of Liver Fat with Radiofrequency Ultrasound Data Using One-dimensional Convolutional Neural Networks
Abstract
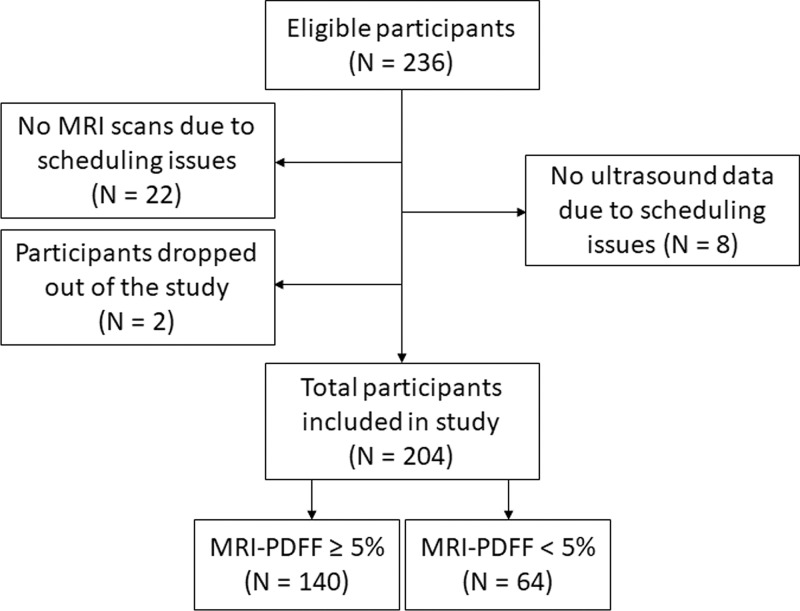
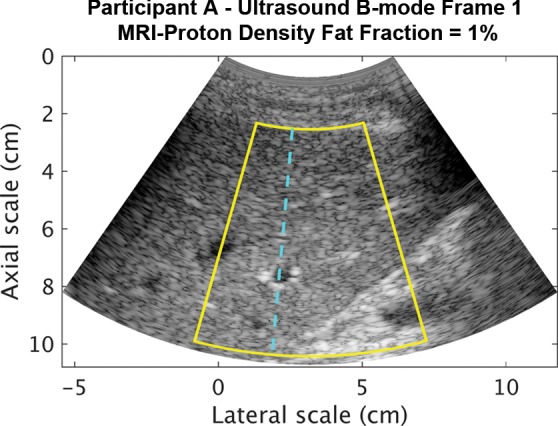
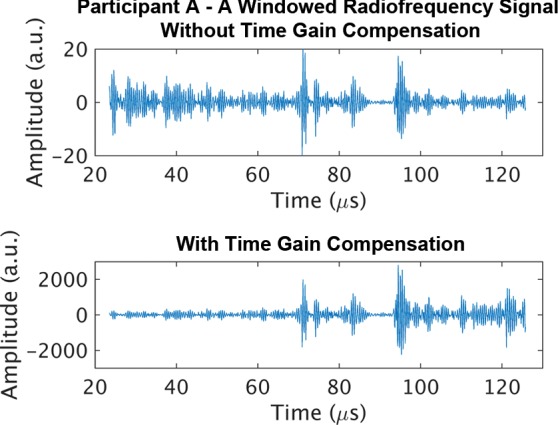
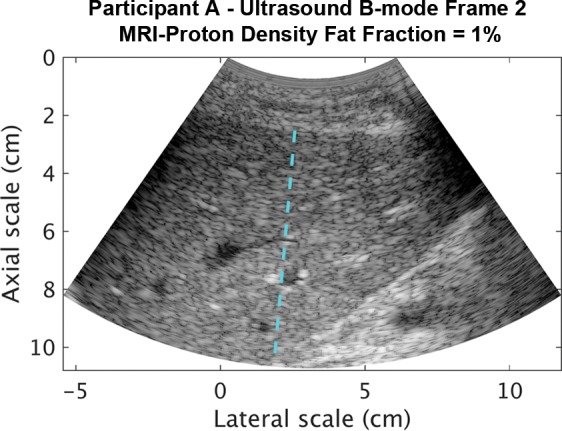
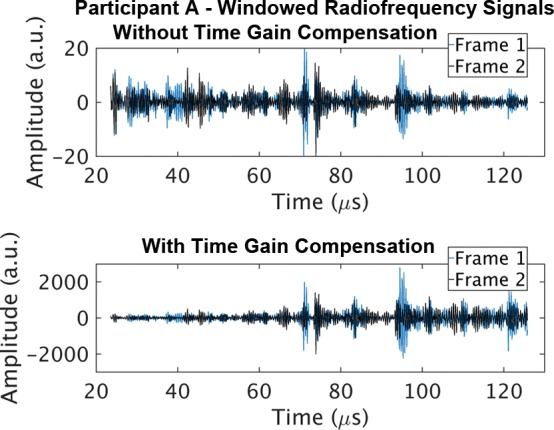
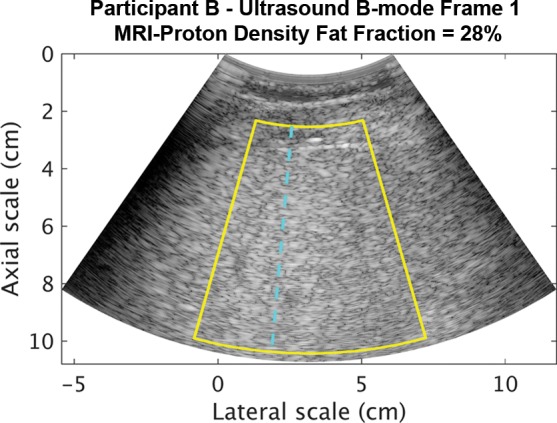
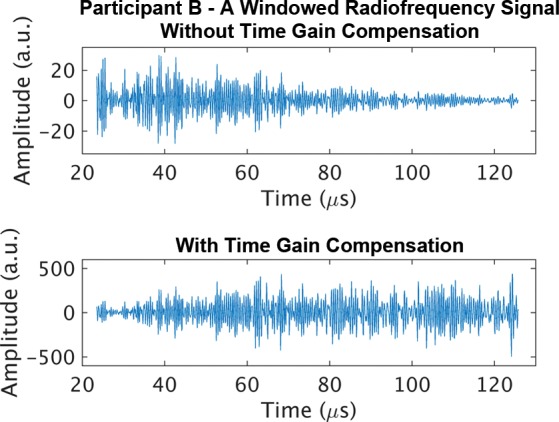
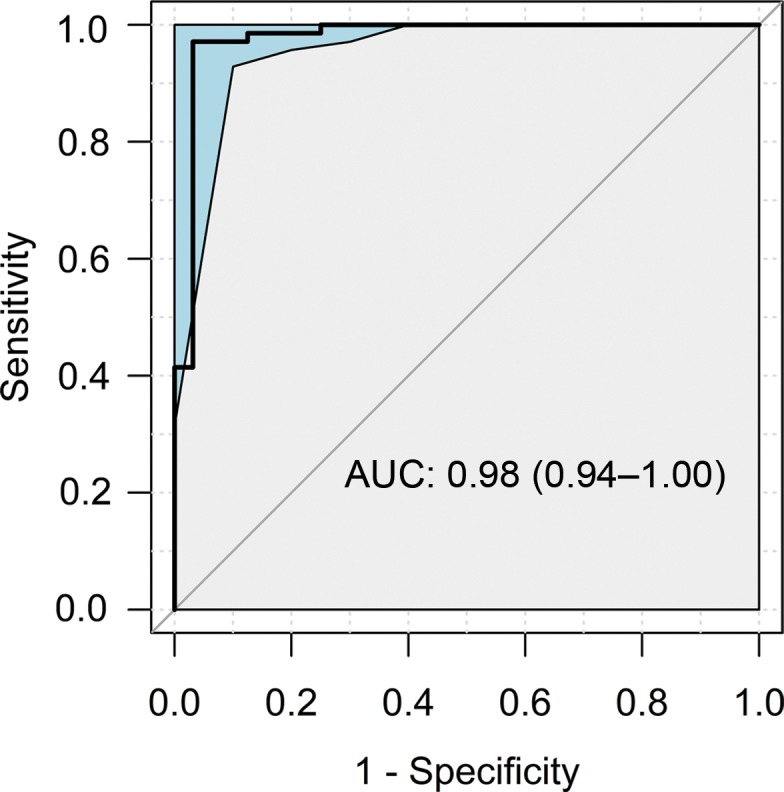
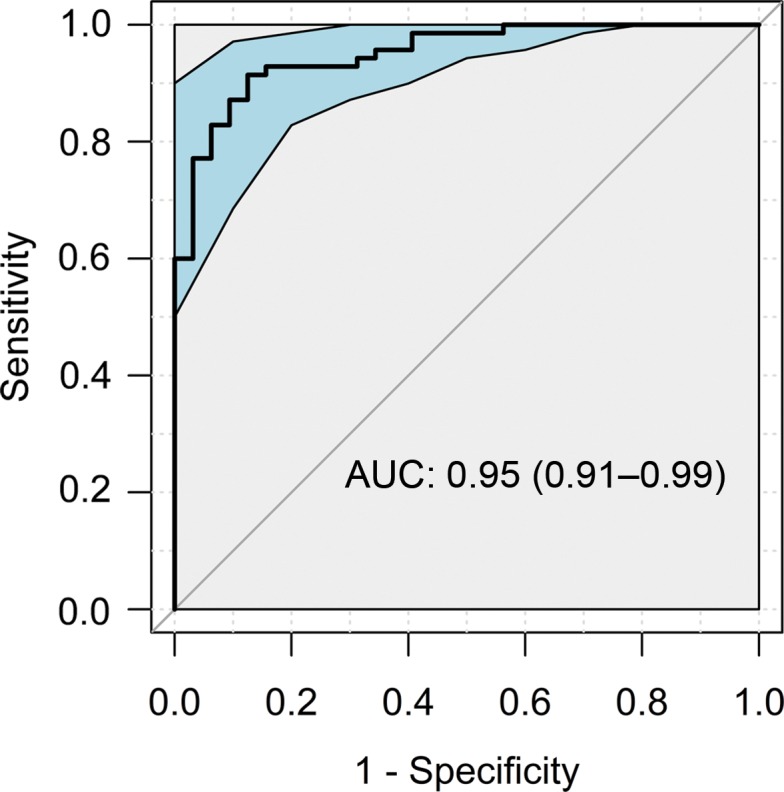
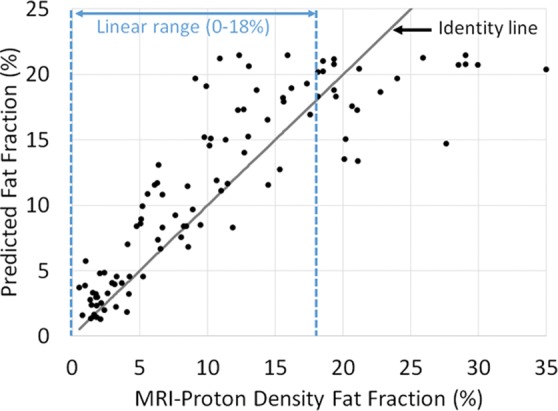
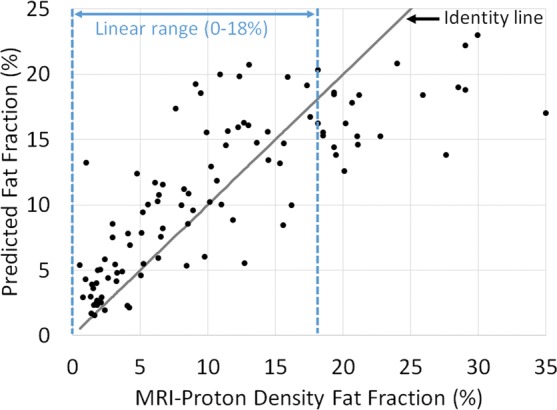
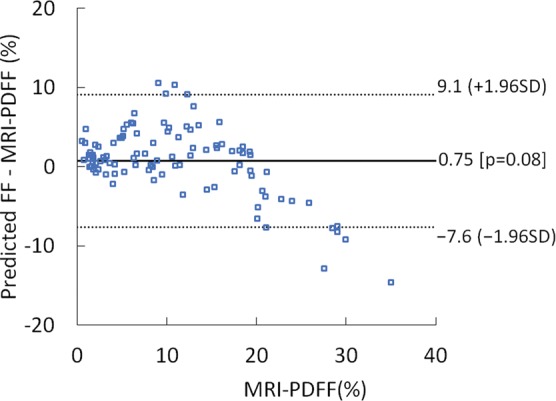
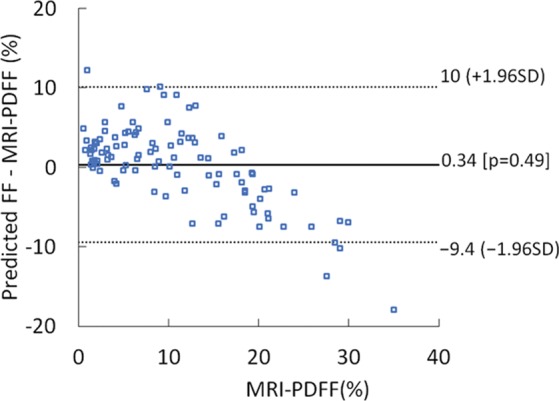
Background Radiofrequency ultrasound data from the liver contain rich information about liver microstructure and composition. Deep learning might exploit such information to assess nonalcoholic fatty liver disease (NAFLD). Purpose To develop and evaluate deep learning algorithms that use radiofrequency data for NAFLD assessment, with MRI-derived proton density fat fraction (PDFF) as the reference. Materials and Methods A HIPAA-compliant secondary analysis of a single-center prospective study was performed for adult participants with NAFLD and control participants without liver disease. Participants in the parent study were recruited between February 2012 and March 2014 and underwent same-day US and MRI of the liver. Participants were randomly divided into an equal number of training and test groups. The training group was used to develop two algorithms via cross-validation: a classifier to diagnose NAFLD (MRI PDFF ≥ 5%) and a fat fraction estimator to predict MRI PDFF. Both algorithms used one-dimensional convolutional neural networks. The test group was used to evaluate the classifier for sensitivity, specificity, positive predictive value, negative predictive value, and accuracy and to evaluate the estimator for correlation, bias, limits of agreements, and linearity between predicted fat fraction and MRI PDFF. Results A total of 204 participants were analyzed, 140 had NAFLD (mean age, 52 years ± 14 [standard deviation]; 82 women) and 64 were control participants (mean age, 46 years ± 21; 42 women). In the test group, the classifier provided 96% (95% confidence interval [CI]: 90%, 99%) (98 of 102) accuracy for NAFLD diagnosis (sensitivity, 97% [95% CI: 90%, 100%], 68 of 70; specificity, 94% [95% CI: 79%, 99%], 30 of 32; positive predictive value, 97% [95% CI: 90%, 99%], 68 of 70; negative predictive value, 94% [95% CI: 79%, 98%], 30 of 32). The estimator-predicted fat fraction correlated with MRI PDFF (Pearson r = 0.85). The mean bias was 0.8% (P = .08), and 95% limits of agreement were -7.6% to 9.1%. The predicted fat fraction was linear with an MRI PDFF of 18% or less (r = 0.89, slope = 1.1, intercept = 1.3) and nonlinear with an MRI PDFF greater than 18%. Conclusion Deep learning algorithms using radiofrequency ultrasound data are accurate for diagnosis of nonalcoholic fatty liver disease and hepatic fat fraction quantification when other causes of steatosis are excluded. © RSNA, 2020 Online supplemental material is available for this article. See also the editorial by Lockhart and Smith in this issue.
Figures
Comment in
-
Fatty Liver Disease: Artificial Intelligence Takes on the Challenge.Radiology. 2020 May;295(2):351-352. doi: 10.1148/radiol.2020200058. Epub 2020 Feb 25. Radiology. 2020. PMID: 32101094 No abstract available.
