. 2020 May 1;36(10):3148-3155.
doi: 10.1093/bioinformatics/btaa118.

Proline: an efficient and user-friendly software suite for large-scale proteomics

Affiliations

Proline: an efficient and user-friendly software suite for large-scale proteomics

David Bouyssié et al. Bioinformatics. .

Abstract

Motivation: The proteomics field requires the production and publication of reliable mass spectrometry-based identification and quantification results. Although many tools or algorithms exist, very few consider the importance of combining, in a unique software environment, efficient processing algorithms and a data management system to process and curate hundreds of datasets associated with a single proteomics study.

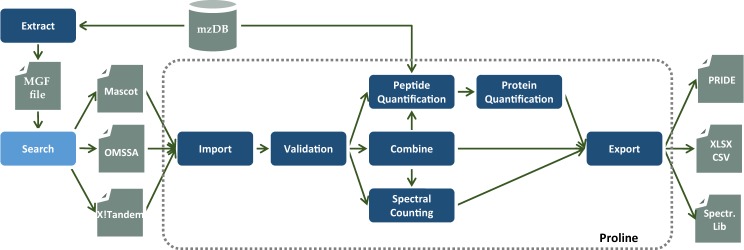
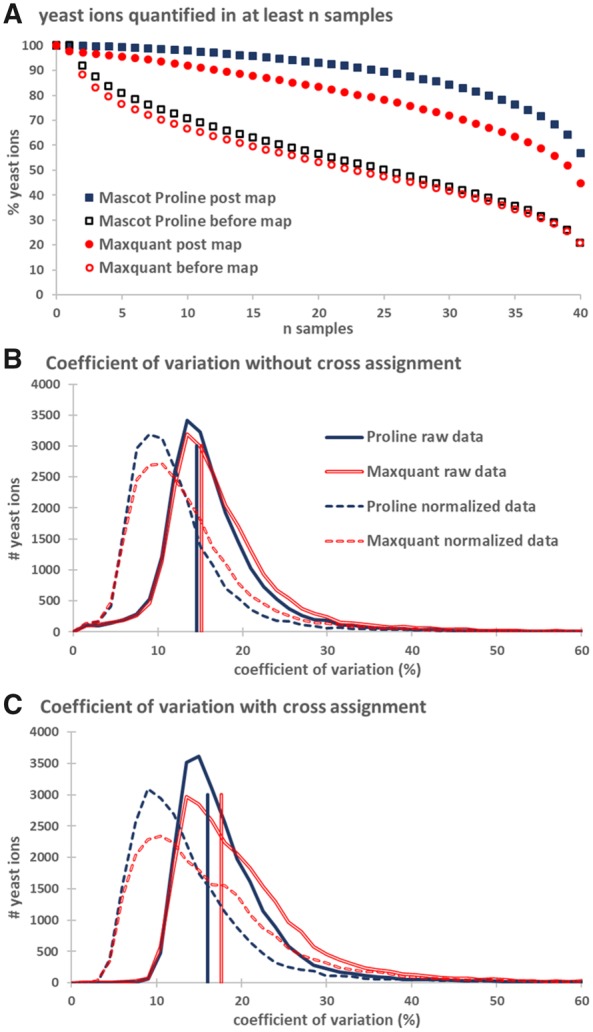
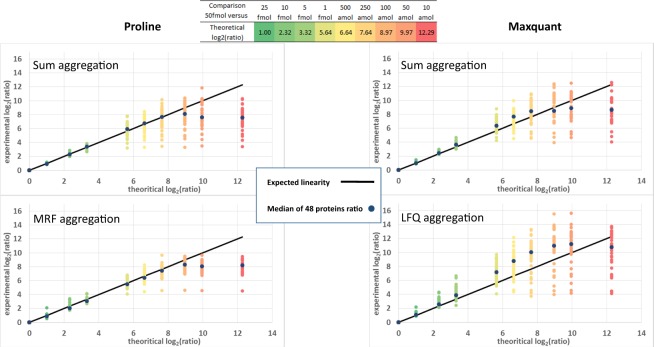
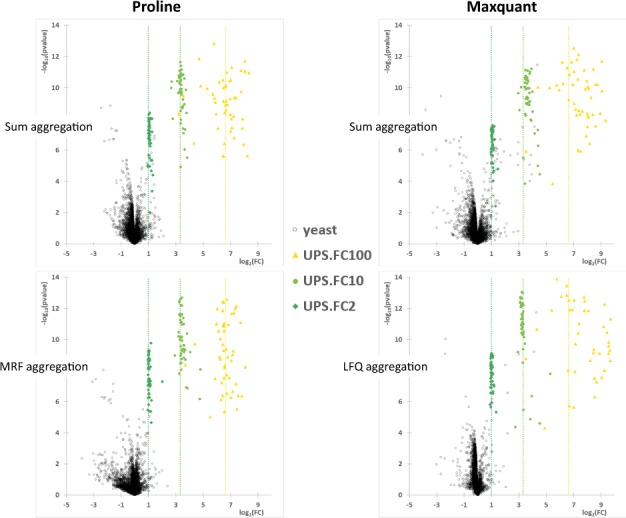
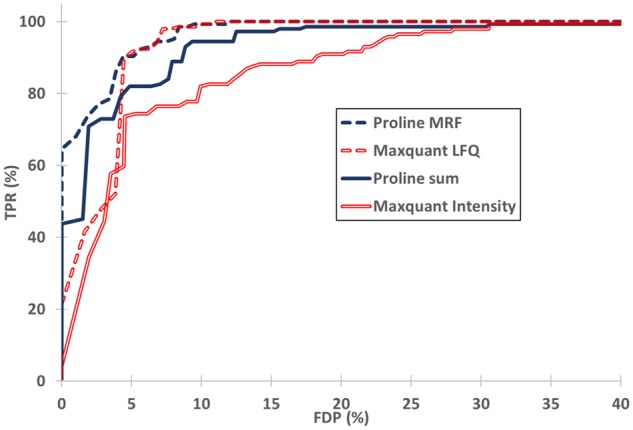
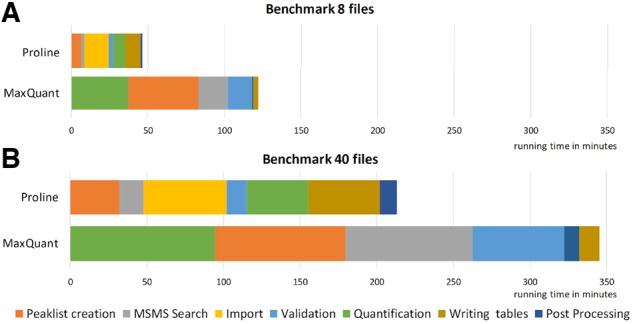
Results: Here, we present Proline, a robust software suite for analysis of MS-based proteomics data, which collects, processes and allows visualization and publication of proteomics datasets. We illustrate its ease of use for various steps in the validation and quantification workflow, its data curation capabilities and its computational efficiency. The DDA label-free quantification workflow efficiency was assessed by comparing results obtained with Proline to those obtained with a widely used software using a spiked-in sample. This assessment demonstrated Proline's ability to provide high quantification accuracy in a user-friendly interface for datasets of any size.

Availability and implementation: Proline is available for Windows and Linux under CECILL open-source license. It can be deployed in client-server mode or in standalone mode at http://proline.profiproteomics.fr/#downloads.

Supplementary information: Supplementary data are available at Bioinformatics online.


Figures

Fig. 1.
Fig. 1.
Schematic representation of the scope of the application: input and output data are represented by gray boxes; tasks which are steps in the data analysis process are represented in blue. Proline provides a set of predefined tasks (dark blue) that can be executed and the paths linking the tasks defines analysis workflows
Fig. 2.
Fig. 2.
Missing values and CV distributions of yeast ions. (A) Proportions of MVs were represented as percentages of ions matching a yeast protein for which an abundance value was defined in more than n samples. The proportion of ions quantified in the 40 runs was different for Proline (57%) and MaxQuant (45%). (B) CV distribution of yeast ions before applying the cross-assignment procedure. Vertical lines indicate median CV values, 15.2% and 14.6%, respectively, for MaxQuant and Proline. (C) CV distribution of yeast ions after cross-assignment. Median CV values were increased to 17.6% and 16% for MaxQuant and Proline, respectively. In both (B) and (C), solid lines represent CV values calculated from raw intensities, whereas dashed lines represent CV values after median normalization
Fig. 3.
Fig. 3.
Estimated versus expected ratios for UPS1 proteins. The abundances of the 48 UPS1 proteins were extracted by Proline (left panel) and MaxQuant (right panel) in each sample from the standard dataset, using either a sum aggregation (upper panels) or ratio-fitting algorithms (bottom panels). The ratios determined, calculated relative to the 50 fmol/µg concentration, were plotted against the expected ratios for the UPS1 proteins across the 10 different concentration points. Both Proline and MaxQuant accurately estimated the ratios calculated for concentration spikes down to 1 fmol/µg (expected ratio 5:6) for most UPS1 proteins. For lower concentration points, when some peptides fell below their limit of detection, the two software behaved differently, with a trend for overestimation of the ratio for MaxQuant, while Proline ratios were still well-fitted down to 250 amol/µg (expected ratio 7:6). When the ratios were calculated using MRF in Proline (bottom left), ratio variability around expected values was reduced compared with the sum method; variability was increased when MaxQuant MaxLFQ was applied (bottom right)
Fig. 4.
Fig. 4.
Volcano plots of the mixed dataset differential analysis. Each protein in the mixed dataset obtained from the quantitative output of three different pairwise comparisons was plotted in a cartesian coordinate defined by the fold change (FC, in log2) on the horizontal axis and the inverse of the P-value (log10) on the vertical axis. The graphs illustrate the quantitative results for the UPS1 proteins quantified in each binary comparison (dark green: comparison of 25 versus 50 fmol/µg, theoretical fold change of 2; light green: comparison of 5 versus 50 fmol/µg, theoretical fold change of 10; yellow: comparison of 500 amol/µg versus 50 fmol/µg, theoretical fold change of 100). Black circles correspond to yeast proteins. The expected ratios of the different concentration points are represented by the dashed vertical lines. For each software, two different peptide-to-protein aggregation methods were implemented: the simplest one consists in an aggregation of non-shared peptides abundances by a sum function (upper part), whereas the second one determines the protein abundances by fitting protein ratios to all observed peptide ratios (MRF or MaxLFQ methods, lower part)
Fig. 5.
Fig. 5.
Differential analysis results in terms of sensitivity and FDP. For each software, proteins from the mixed dataset were classified as variant through the application of q-value thresholding. Sensitivity (TPR = TP/144, TP UPS1 proteins) was plotted as a function of FDP [FDP = FP/(TP+ FP), FP yeast proteins]
Fig. 6.
Fig. 6.
Workflows computation time. Performance of the Mascot–Proline and Andromeda–MaxQuant label-free workflows were compared on two datasets of different sizes. The main steps of the compared workflows are shown in the same color when possible. Time values were taken from the ‘runningTimes.txt’ output file for MaxQuant and from the log files for Proline. (A) Performance observed for a dataset containing eight UPS1-Yeast LC-MS/MS runs: Total processing time was 122 min for MaxQuant and 46 min for Proline (average time per file 15.26 and 5.79 min, respectively). (B) Performance observed for the whole UPS1-Yeast dataset (40 LC-MS/MS runs): Total processing time 346 min for MaxQuant and 214 min for Proline (average time per file: 8.63 and 5.34 min, respectively)

Similar articles

Cited by

References

    1. Aebersold R., Mann M. (2016) Mass-spectrometric exploration of proteome structure and function. Nature, 537, 347–355. - PubMed
    1. America A.H.P., Cordewener J.H.G. (2008) Comparative LC-MS: a landscape of peaks and valleys. Proteomics, 8, 731–749. - PubMed
    1. Andreev V.P. et al. (2007) A new algorithm using cross-assignment for label-free quantitation with LC-LTQ-FT MS. J. Proteome Res., 6, 2186–2194. - PMC - PubMed
    1. Bouyssié D. et al. (2015) mzDB: a file format using multiple indexing strategies for the efficient analysis of large LC-MS/MS and SWATH-MS data sets. Mol. Cell. Proteomics, 14, 771–781. - PMC - PubMed
    1. Choi M. et al. (2017) ABRF Proteome Informatics Research Group (iPRG) 2015 Study: detection of differentially abundant proteins in label-free quantitative LC-MS/MS Experiments. J. Proteome Res., 16, 945–957. - PubMed

Publication types