Randomized Controlled Trial
. 2020 Mar 26;5(6):e134196.
doi: 10.1172/jci.insight.134196.

Cell-associated HIV-1 RNA predicts viral rebound and disease progression after discontinuation of temporary early ART

Affiliations
Randomized Controlled Trial

Cell-associated HIV-1 RNA predicts viral rebound and disease progression after discontinuation of temporary early ART

Alexander O Pasternak et al. JCI Insight. .

Abstract

Plasma viral load (VL) and CD4+ T cell count are widely used as biomarkers of HIV type 1 (HIV-1) replication, pathogenesis, and response to antiretroviral therapy (ART). However, the clinical potential of cell-associated (CA) HIV-1 molecular markers is much less understood. Here, we measured CA HIV-1 RNA and DNA in HIV-infected individuals treated with temporary ART initiated during primary HIV-1 infection. We demonstrate substantial predictive value of CA RNA for (a) the virological and immunological response to early ART, (b) the magnitude and time to viral rebound after discontinuation of early ART, and (c) disease progression in the absence of treatment. Remarkably, when adjusted for CA RNA, plasma VL no longer appeared as an independent predictor of any clinical endpoint in this cohort. The potential of CA RNA as an HIV-1 clinical marker, in particular as a predictive biomarker of virological control after stopping ART, should be explored in the context of HIV-1 curative interventions.

Keywords: AIDS/HIV; Transcription; Virology.


Conflict of interest statement

Conflict of interest: The authors have declared that no conflict of interest exists.

Figures

Figure 1
Figure 1. Schematic of the study.
Participants received either 60 weeks’ (n = 29), 24 weeks’ (n = 23), or no (n = 12) early ART. Variables were measured at 3 time points (shown in red): baseline (corresponding to the start of early ART for the 60-week and 24-week arms), early ART interruption (for 60-week and 24-week arms), and virological set point (36 weeks from early ART interruption or baseline). Numbers of participants included in the corresponding analyses: baseline (n = 44), treatment interruption (n = 51), and set point (n = 56).
Figure 2
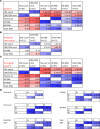
Figure 2. Correlation matrices of clinical and virological variables.
(A–C) Correlations between different variables measured at (A) baseline (BL), (B) early ART interruption (TI), and (C) virological set point (SP). Participants from all 3 arms were included in the BL and SP correlation analyses; participants from 24- and 60-week treatment arms were included in the TI correlation analysis. Numbers of measurements are shown for every variable and for every time point. (D) Correlations between different time points per variable. Heatmaps indicate the strength of positive (blue) or negative (red) correlations. Spearman’s rho coefficients are depicted below the diagonal and P values are above the diagonal. US RNA, unspliced RNA; MS RNA, multiply spliced RNA.
Figure 3
Figure 3. Pre-ART predictors of time to virological suppression on early ART.
Kaplan-Meier survival analysis for plasma VL, CA HIV US RNA, CA HIV MS RNA, total HIV DNA (VD), CD4+ count, and CD4/CD8 ratio, measured at the start of early ART (n = 44). The endpoint of the analysis was virological suppression less than 50 copies/mL. Levels of every potential predictor were stratified into “high” and “low” strata based on median values. HRs and 95% CIs were calculated using Mantel-Haenszel method. P values were calculated using log-rank tests.
Figure 4
Figure 4. Pre-ART predictors of virological suppression at 12 weeks of early ART.
Plasma VL, CA HIV US and MS RNA, total HIV DNA, CD4+ count, and CD4/CD8 ratio, measured at the start of early ART, were compared between participants with undetectable (n = 19, blue dots) and detectable (n = 24, red dots) plasma VL at 12 weeks of early ART. P values were calculated using Mann-Whitney U tests. Open circles depict undetectable values, censored to 50% of assay detection limits.
Figure 5
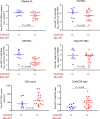
Figure 5. Pre-ART predictors of CD4/CD8 ratio normalization at 48 weeks of early ART.
Plasma VL, CA HIV US and MS RNA, total HIV DNA, CD4+ count, and CD4/CD8 ratio, measured at the start of early ART, were compared between participants with CD4/CD8 ratio less than 1 (n = 8, blue dots) and more than 1 (n = 16, red dots) at 48 weeks of early ART. P values were calculated using Mann-Whitney U tests. Open circles depict undetectable values, censored to 50% of assay detection limits.
Figure 6
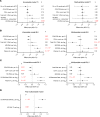
Figure 6. Predictors of magnitude of viral rebound after interruption of early ART.
(A and B) Coefficient plots of variables measured (A) at early ART interruption (n = 51) or (B and C) at the start of early ART (baseline) (n = 43). Effect sizes and 95% CIs for the associations of the variables with plasma VL at the virological set point were calculated by fitting univariable and multivariable generalized linear models. For baseline, 2 models are shown, including either US RNA and total HIV-1 DNA separately (model I, B) or the US RNA/total DNA ratio as a single variable (model II, C). US RNA/total DNA ratio was calculated taking into account that 106 PBMCs contain 1 μg of total RNA (74). (D) The final multivariable model. Units of measurement of total HIV-1 DNA are log10 copies/106 PBMCs and of US are log10 copies/μg total RNA. Significant associations are marked in red.
Figure 7
Figure 7. On-ART predictors of time to viral rebound after interruption of early ART.
Kaplan-Meier survival analysis for CA HIV US RNA, total HIV DNA, CD4+ count, and CD4/CD8 ratio, measured at the latest time point available before interruption of early ART, as well as detectability of CA HIV MS RNA at any time point on early ART, and time on early ART (60 or 24 weeks) (n = 51). The endpoint of the analysis was viral rebound to more than 50 or more than 400 copies/mL. Levels of US RNA, total HIV DNA, CD4+ count, and CD4/CD8 ratio were stratified into “high” and “low” strata based on median values. HRs and 95% CIs were calculated using Mantel-Haenszel method. P values were calculated using log-rank tests. det, detectable; ud, undetectable.
Figure 8
Figure 8. On-ART predictors of disease progression after interruption of early ART.
Kaplan-Meier survival analysis for CA HIV US RNA, total HIV DNA, CD4+ count, and CD4/CD8 ratio, measured at the latest time point available before interruption of early ART, as well as detectability of CA HIV MS RNA at any time point on early ART, and time on early ART (60 or 24 weeks) (n = 51). The composite endpoint of the analysis was either a CD4+ count measurement of less than 350 cells/mm3 or restart of ART. Levels of US RNA, total HIV DNA, CD4+ count, and CD4/CD8 ratio were stratified into “high” and “low” strata based on median values. HRs and 95% CIs were calculated using Mantel-Haenszel method. P values were calculated using log-rank tests. det, detectable; ud, undetectable.
Figure 9
Figure 9. Predictors of disease progression in the absence of treatment.
Kaplan-Meier survival analysis for plasma VL, CA HIV US and MS RNA, total HIV DNA, CD4+ count, and CD4/CD8 ratio, measured at the virological set point (36 weeks after interruption of early ART or randomization), as well as having been treated with early ART or not (n = 56). The composite endpoint of the analysis was either a CD4+ count measurement of less than 350 cells/mm3 or (re)start of ART. Levels of plasma VL, US RNA, MS RNA, total HIV DNA, CD4+ count, and CD4/CD8 ratio were stratified into “high” and “low” strata based on median values. HRs and 95% CIs were calculated using Mantel-Haenszel method. P values were calculated using log-rank tests.

References

    1. Deeks SG, et al. International AIDS Society global scientific strategy: towards an HIV cure 2016. Nat Med. 2016;22(8):839–850. doi: 10.1038/nm.4108. - DOI - PMC - PubMed
    1. Pasternak AO, et al. Modest nonadherence to antiretroviral therapy promotes residual HIV-1 replication in the absence of virological rebound in plasma. J Infect Dis. 2012;206(9):1443–1452. doi: 10.1093/infdis/jis502. - DOI - PubMed
    1. Pasternak AO, Jurriaans S, Bakker M, Prins JM, Berkhout B, Lukashov VV. Cellular levels of HIV unspliced RNA from patients on combination antiretroviral therapy with undetectable plasma viremia predict the therapy outcome. PLoS One. 2009;4(12):e8490. doi: 10.1371/journal.pone.0008490. - DOI - PMC - PubMed
    1. European Pregnancy Paediatric HIV Cohort Collaboration (EPPICC) Early-treated Perinatally HIV-infected Individuals: Improving Children’s Actual Life with Novel Immunotherapeutic Strategies (EPIICAL) study groups. Predictors of faster virological suppression in early treated infants with perinatal HIV from Europe and Thailand. AIDS. 2019;33(7):1155–1165. doi: 10.1097/QAD.0000000000002172. - DOI - PMC - PubMed
    1. Ceccherini-Silberstein F, et al. Pre-ART HIV-1 DNA in CD4+ T cells correlates with baseline viro-immunological status and outcome in patients under first-line ART. J Antimicrob Chemother. 2018;73(12):3460–3470. - PubMed

Publication types