. 2020 Feb 25;16(2):e1007300.
doi: 10.1371/journal.pcbi.1007300. eCollection 2020 Feb.

A biophysical model of striatal microcircuits suggests gamma and beta oscillations interleaved at delta/theta frequencies mediate periodicity in motor control

Affiliations

A biophysical model of striatal microcircuits suggests gamma and beta oscillations interleaved at delta/theta frequencies mediate periodicity in motor control

Julia A K Chartove et al. PLoS Comput Biol. .

Abstract

Striatal oscillatory activity is associated with movement, reward, and decision-making, and observed in several interacting frequency bands. Local field potential recordings in rodent striatum show dopamine- and reward-dependent transitions between two states: a "spontaneous" state involving β (∼15-30 Hz) and low γ (∼40-60 Hz), and a state involving θ (∼4-8 Hz) and high γ (∼60-100 Hz) in response to dopaminergic agonism and reward. The mechanisms underlying these rhythmic dynamics, their interactions, and their functional consequences are not well understood. In this paper, we propose a biophysical model of striatal microcircuits that comprehensively describes the generation and interaction of these rhythms, as well as their modulation by dopamine. Building on previous modeling and experimental work suggesting that striatal projection neurons (SPNs) are capable of generating β oscillations, we show that networks of striatal fast-spiking interneurons (FSIs) are capable of generating δ/θ (ie, 2 to 6 Hz) and γ rhythms. Under simulated low dopaminergic tone our model FSI network produces low γ band oscillations, while under high dopaminergic tone the FSI network produces high γ band activity nested within a δ/θ oscillation. SPN networks produce β rhythms in both conditions, but under high dopaminergic tone, this β oscillation is interrupted by δ/θ-periodic bursts of γ-frequency FSI inhibition. Thus, in the high dopamine state, packets of FSI γ and SPN β alternate at a δ/θ timescale. In addition to a mechanistic explanation for previously observed rhythmic interactions and transitions, our model suggests a hypothesis as to how the relationship between dopamine and rhythmicity impacts motor function. We hypothesize that high dopamine-induced periodic FSI γ-rhythmic inhibition enables switching between β-rhythmic SPN cell assemblies representing the currently active motor program, and thus that dopamine facilitates movement in part by allowing for rapid, periodic shifts in motor program execution.


Conflict of interest statement

The authors have declared that no competing interests exist.

Figures

Fig 1
Fig 1. Behavior of single model FSI over a range of applied currents and D-current conductances.
(A) i. A single model FSI with low tonic excitation (Iapp = 8μA/cm2) spikes at a low γ frequency within periodic bursts, while a single model FSI with high tonic excitation (Iapp = 20μA/cm2) spikes at a high γ within periodic bursts. ii. Power spectral density of voltage traces in (A)i, comparing low and high levels of tonic excitation. Power spectra are derived using Thomson’s multitaper power spectral density (PSD) estimate (MATLAB function pmtm). (B) Plot of the minimal firing rate within a burst of a single model FSI with zero and nonzero D current conductance gD. Note that the cell does not fire below 40 Hz when the D-current is present. (C) Plot of the maximal inter-burst (δ) frequency and intraburst (γ) firing rate of a single model FSI as τD, the time constant of inactivation of the D current, is increased. (D) Three-dimensional false-color plot demonstrating the dependence of the bursting regime on gd and Iapp. (E) Three-dimensional false-color plot demonstrating the dependence of firing rate on gd and Iapp.
Fig 2
Fig 2. Applied noise determines interburst and intraburst frequency of FSI spiking.
(A) i. Single model FSI with tonic excitation (7 μA/cm2) and weak Poisson noise (λ = 500) spikes at γ nested in δ/θ, while a single model FSI with tonic excitation (7 μA/cm2) and strong Poisson noise (λ = 7000) has limited low-frequency content. ii. Power spectral density of voltage traces in (A)i, comparing low and high levels of noise. The solid line represents the mean value over 20 simulations per point. Shading represents standard deviation from these means. Power spectra are derived using Thomson’s multitaper power spectral density (PSD) estimate (MATLAB function pmtm). (B) Plot of the inter-burst frequency and power of a single model FSI as Poisson noise of varying rates is applied. (C) Plot of the inter-burst frequency and power of a single model FSI as Poisson noise of varying amplitudes is applied. For B and C Iapp = 7 μA/cm2.
Fig 3
Fig 3. FSI network rhythms change with background excitation and synaptic strength.
Power and frequency of δ/θ and γ rhythms in FSI network mean voltage as a function of (A) tonic input current, (B) gap junction conductance, and (C) GABAA conductance. The parameters not being varied in plots A-C are held at the high DA values (Iapp = 14 μA/cm2, gGJ = 0.3 mS/cm2, gsyn = 0.005 mS/cm2, τgaba = 13 ms. The solid line represents the mean value over 10 simulations per point. Shading represents standard deviation from these means. Power spectra are derived using Thomson’s multitaper power spectral density (PSD) estimate (MATLAB function pmtm). (D) Gamma frequency as a function of GABAa synaptic time constant and level of dopamine. High DA values are as previously stated; low DA values are Iapp = 7 μA/cm2, gGJ = 0.15 mS/cm2, gsyn = 0.1 mS/cm2.
Fig 4
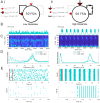
Fig 4. FSI network activity and rhythms are altered by DA.
(A) Schematics showing the effects of dopamine on the FSI network during the baseline (i) and high (ii) DAergic tone conditions. (B) Sum of synaptic currents (surrogate LFP) for the FSI network in the two conditions. (C) Spectrograms of (B). (D) Solid line: Power spectral density of summed FSI synaptic currents (surrogate LFP), averaged over 20 simulations. Dashed line: Average power spectral density of each individual FSI voltage trace in the network, averaged over 20 simulations. Shading represents standard deviation from the mean. (E) Raster plots of FSI network activity at multisecond and subsecond timescales (red bars indicate time limits of lower raster plot).
Fig 5
Fig 5. Baseline SPN activity is characterized by β oscillations only in the D1 subnetwork under high DA conditions.
(A) Schematics depicting the baseline (i) and high DAergic tone (ii) conditions in an isolated SPN-only network. (B) Mean voltages for the D1 and D2 SPN populations in the two conditions. (C) Spectrograms of mean voltage for the D1 subpopulation (upper) and D2 subpopulation (lower). (D) Power spectral density of D1 and D2 population activity, averaged over 20 simulations. Shading represents standard deviation from the mean. Power spectra are derived using Thomson’s multitaper power spectral density (PSD) estimate (MATLAB function pmtm). (E) Raster plots of SPN population activity.
Fig 6
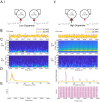
Fig 6. FSIs paradoxically excite and pattern SPN network activity.
(A) Schematics showing modulation during the baseline (i) and high (ii) DAergic tone conditions in a combined FSI-SPN network. (B) Mean voltages for the D1 and D2 SPN populations in the two conditions. (C) Spectrograms of mean voltage for the D1 subpopulation (upper) and D2 subpopulation (lower). (D) Power spectral density of D1 and D2 population activity, averaged over 20 simulations. Shading represents standard deviation from the mean. Power spectra are derived using Thomson’s multitaper power spectral density (PSD) estimate (MATLAB function pmtm). (E) Raster plots of SPN population activity.
Fig 7
Fig 7. In the high DA state, packets of FSI γ and SPN β alternate at a δ/θ timescale.
(A) LFP surrogates (summed synaptic currents) for baseline (i) and high (ii) DAergic tone conditions. (B) Spectrograms of LFP surrogates. (C) Wavelet-filtered β and γ oscillations from the population activity in (A). (D) Schematic of oscillatory activity during baseline and high DAergic tone conditions, with proposed functional impact on ensemble activity.

Similar articles

Cited by

References

    1. Gittis AH, Kreitzer AC. Striatal microcircuitry and movement disorders. Trends in Neurosciences. 2013;31(9):1713–1723. - PMC - PubMed
    1. Brown P, Williams D. Basal ganglia local field potential activity: Character and functional significance in the human. Clinical Neurophysiology. 2005;116(11):2510–2519. 10.1016/j.clinph.2005.05.009 - DOI - PubMed
    1. Ghiglieri V, Bagetta V, Calabresi P, Picconi B. Functional interactions within striatal microcircuit in animal models of Huntington’s disease. Neuroscience. 2012;211:165–184. 10.1016/j.neuroscience.2011.06.075 - DOI - PubMed
    1. Rothe T, Deliano M, Wójtowicz AM, Dvorzhak A, Harnack D, Paul S, et al. Pathological gamma oscillations, impaired dopamine release, synapse loss and reduced dynamic range of unitary glutamatergic synaptic transmission in the striatum of hypokinetic Q175 Huntington mice. Neuroscience. 2015;311:519–538. 10.1016/j.neuroscience.2015.10.039 - DOI - PubMed
    1. Naze S, Humble J, Zheng P, Barton S, Rangel-Barajas C, Rebec GV, et al. Cortico-striatal cross-frequency coupling and gamma genesis disruptions in Huntington’s disease mouse and computational models. eNeuro. 2018;5(6). 10.1523/ENEURO.0210-18.2018 - DOI - PMC - PubMed

Publication types