. 2020 May 4;217(5):e20191421.
doi: 10.1084/jem.20191421.

NK cell-derived GM-CSF potentiates inflammatory arthritis and is negatively regulated by CIS

Affiliations

NK cell-derived GM-CSF potentiates inflammatory arthritis and is negatively regulated by CIS

Cynthia Louis et al. J Exp Med. .

Erratum in

Abstract

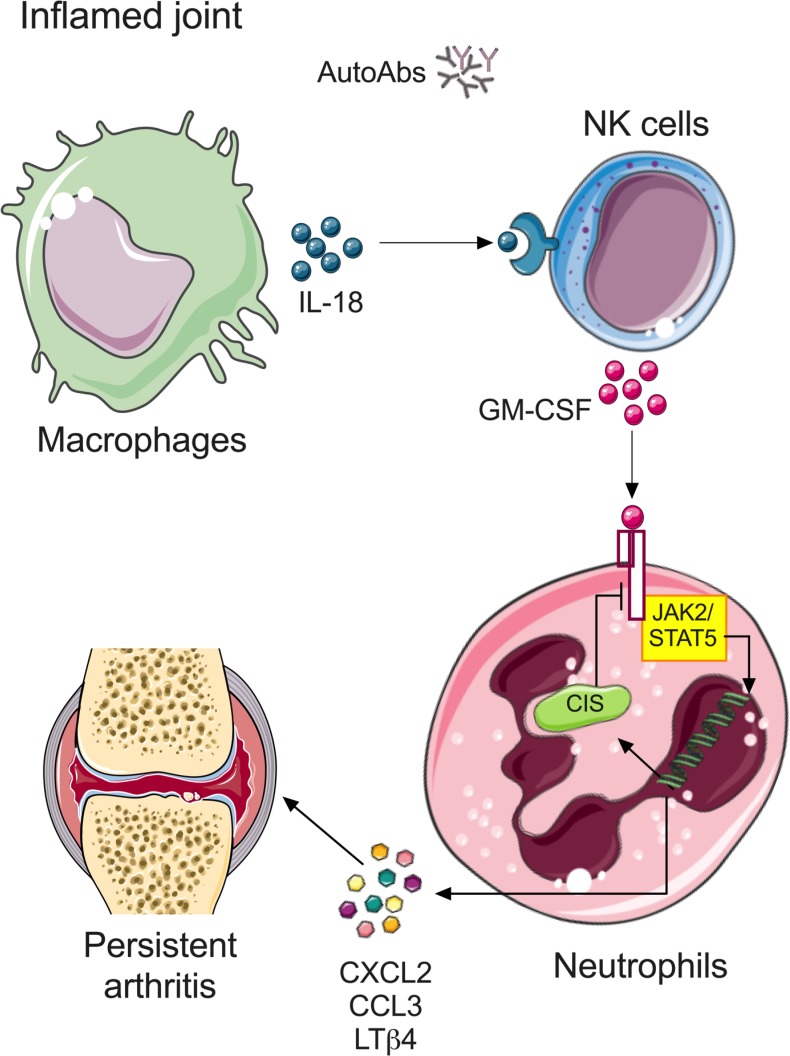
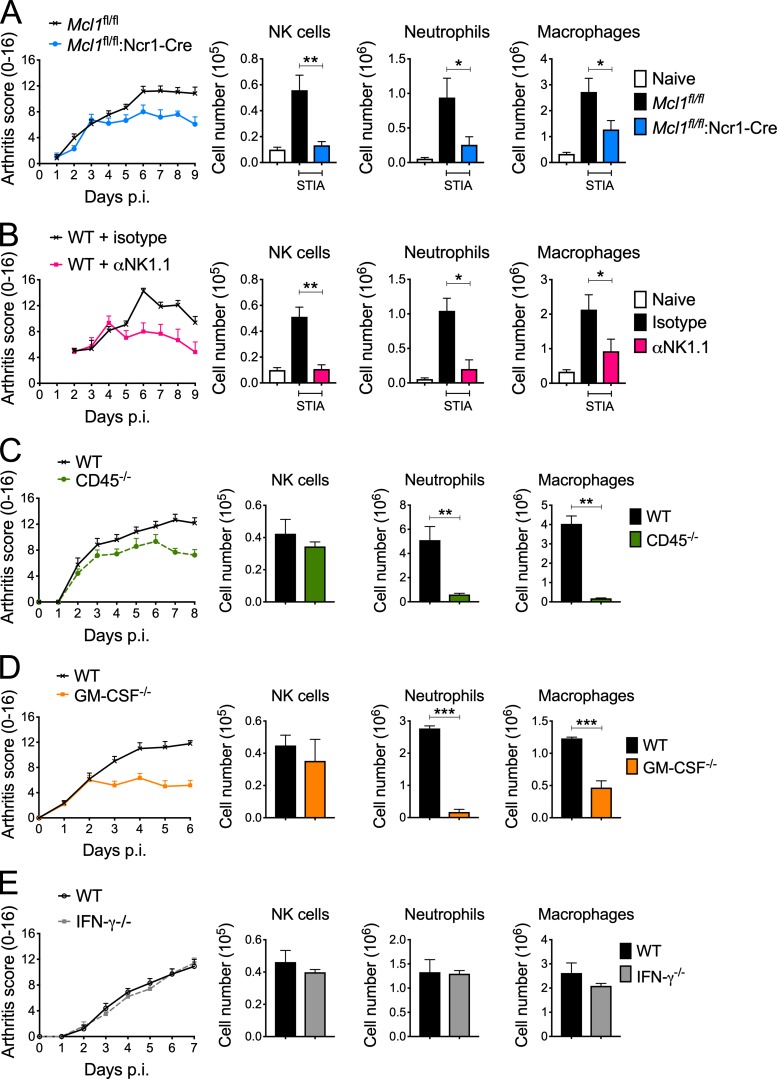
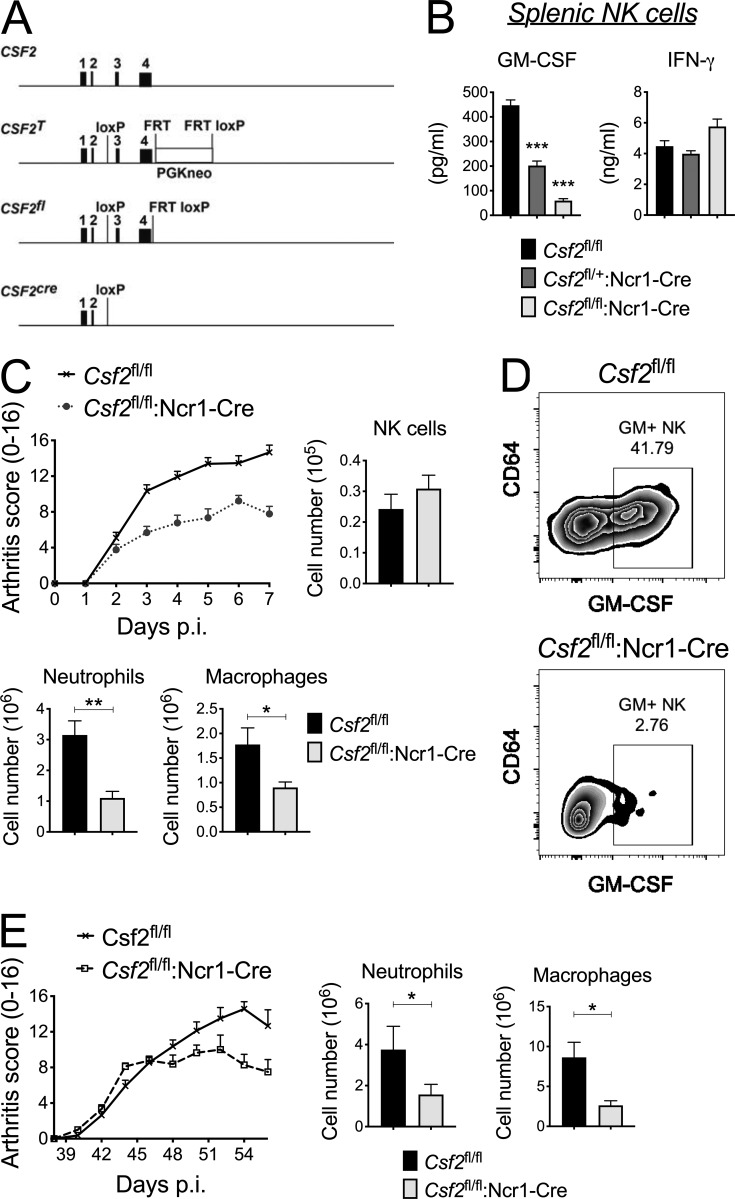
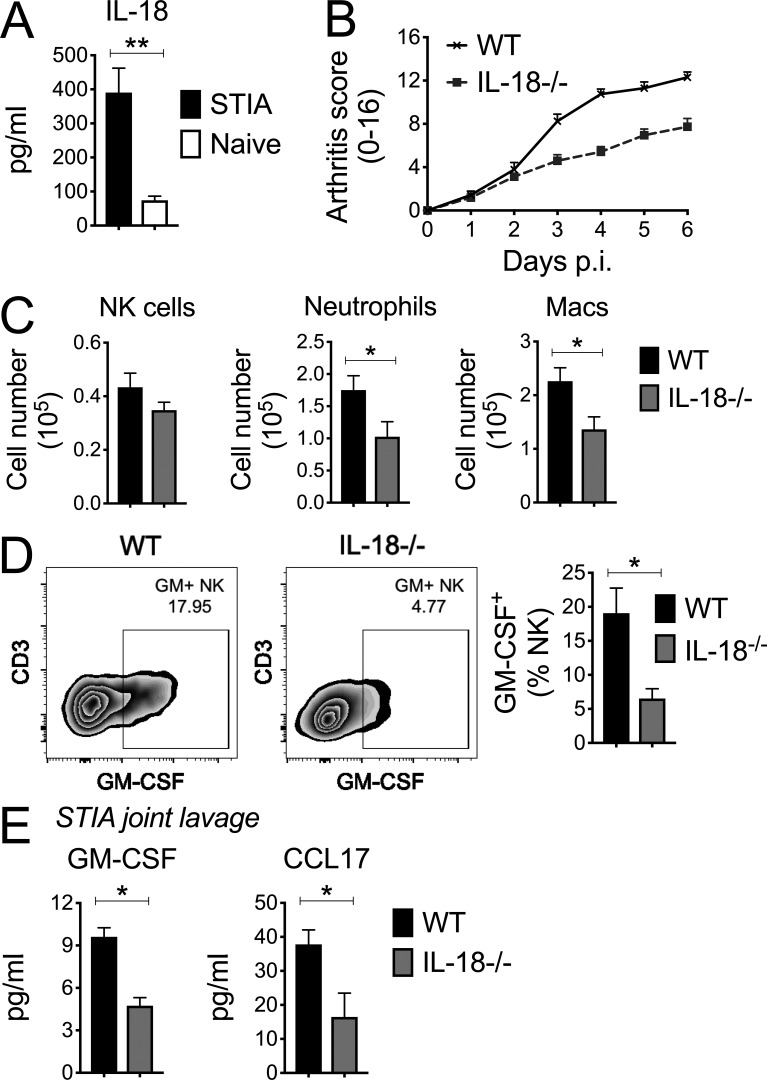
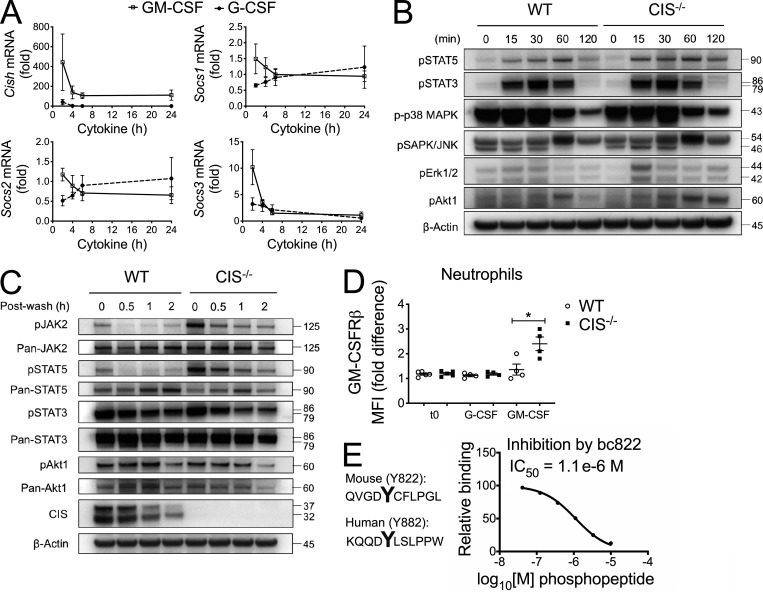
Despite increasing recognition of the importance of GM-CSF in autoimmune disease, it remains unclear how GM-CSF is regulated at sites of tissue inflammation. Using GM-CSF fate reporter mice, we show that synovial NK cells produce GM-CSF in autoantibody-mediated inflammatory arthritis. Synovial NK cells promote a neutrophilic inflammatory cell infiltrate, and persistent arthritis, via GM-CSF production, as deletion of NK cells, or specific ablation of GM-CSF production in NK cells, abrogated disease. Synovial NK cell production of GM-CSF is IL-18-dependent. Furthermore, we show that cytokine-inducible SH2-containing protein (CIS) is crucial in limiting GM-CSF signaling not only during inflammatory arthritis but also in experimental allergic encephalomyelitis (EAE), a murine model of multiple sclerosis. Thus, a cellular cascade of synovial macrophages, NK cells, and neutrophils mediates persistent joint inflammation via production of IL-18 and GM-CSF. Endogenous CIS provides a key brake on signaling through the GM-CSF receptor. These findings shed new light on GM-CSF biology in sterile tissue inflammation and identify several potential therapeutic targets.


Conflict of interest statement

Disclosures: Dr. Rautela is the co-founder and CEO of oNKo-innate Pty. Ltd. Dr. Masters reported personal fees from IFM Therapeutics, personal fees from Quench Bio, and grants from GlaxoSmithKline outside the submitted work. Dr. Babon reported a patent to inhibition of cytokine-induced sh2 protein in NK cells, licensed "Servier." Dr. Vivier reported personal fees from Innate Pharma during the conduct of the study; personal fees from Innate Pharma outside the submitted work; and is an employee of Innate Pharma. Dr. Huntington reported "other" from Servier during the conduct of the study; personal fees from ONKo-Innate outside the submitted work; has a patent to WO201700861A1 with royalties paid, Servier; and is the founder of oNKo-Innate Pty Ltd. Dr. Wicks reported, "I have argued that GM-CSF is an important therapeutic target in inflammatory diseases (see Wicks and Roberts, Nature Reviews Rheumatology 2016) and have provided advice around clinical translation to several companies interested in the area, namely Medimmune and Kiniksa. I have no relevant IP and these companies were not involved in the project described in our submission to JEM, nor did they provide funding. I don't believe there is any conflict of interest, but declare it because I have been an advocate for therapeutic antagonism of GM-CSF." No other disclosures were reported.

Figures

None
Graphical abstract
Figure S1.
Figure S1.
Characterization of Gr/fr mice. (A) Gr/fr mice were generated by targeted integration, resulting in replacement of WT GM-CSF gene (Csf2) with the vector. The IRES-iCre-2A-BFP-SV40pA cassette was placed 25 bp after the STOP codon in exon 4, in the 3′ untranslated region (UTR) of the Csf2. The FRT-flanked Neo cassette (FRT-Neo-FRT) was placed 330 bp upstream of exon 4 in intronic sequence and was later excised through breeding with FLP transgenic mice. The SA extends 2.1 kb 5′ to the Neo cassette and the LA 6.2 kb 3′ to the IRES-iCre-2A-BFP-SV40pA cassette. Length in bps: SA, 2,085; Neo, 1,561; middle homology arm (MA), 466; IRES-iCre-2A-BFP, 2,686; LA, 6,620. The transgenic construct has been designed to provide normal expression of GM-CSF, driven by natural controlling elements of Csf2. GM-CSF induction triggers the expression of iCre and BFP, given that BFP is downstream of iCre, all BFP+ cells should also be iCre+. These mice were then crossed Rosa26eYFP to enable lineage tracing via iCre-mediated YFP expression. (B) Naive CD4+ T cells were isolated from Gr/fr mice mice and cultured in Th17 polarizing conditions and analyzed by flow cytometry comparing BFP reporter signal to intracellular staining of GM-CSF. (C) Flow-cytometric analysis of GM-CSF–producing cells (BFP+ YFP+) in the lung of naive Gr/fr mice. (D) Flow-cytometric analysis of GM-CSF–producing cells (BFP+ YFP+) in the joints of arthritic Gr/fr mice.
Figure 1.
Figure 1.
NK cells produce GM-CSF in STIA. (A) Representative FACS plots showing GM-CSF–producing cells (BFP+YFP+) in the inflamed joints of WT or Gr/fr mice with STIA. (B) Proportion of GM-CSF-producing (BFP+) cells among GM-CSF producers (total YFP+) cells in the STIA inflamed joints of Gr/fr mice across various time points of arthritis. Vertical bars, mean ± SEM, n = 3–5 mice. (C) Representative FACS plots showing gating strategies used to identify GM-CSF–producing cells (BFP+YFP+) among joint-infiltrating immune cells in the Gr/fr mice with STIA. Data shown for A–C are representative of two independent experiments. (D) Representative FACS plots showing segregation of GM-CSF–producing cells (BFP+YFP+) and other cells with a history of producing GM-CSF (BFP YFP+) in Gr/fr mice with STIA. FSC-A, forward scatter area; SSC-A, side scatter area.
Figure S2.
Figure S2.
Human NK cells produce GM-CSF in RA SF. (A and B) FACS (A) and bar plots (B) showing the relative frequency of NK cell subsets (immature CD56bright and mature CD56dim) in PBMCs from healthy donors or RA SF. Vertical bars, mean ± SEM, n = 3 donors. (C) FACS plots showing intracellular GM-CSF and IFN-γ staining of viable lineage CD7+ cells in RA SF. (D and E) Ratio of NK (CD3+ NKp46+), CD4+ T cells (CD3+ CD4+) and CD8+ T cells (CD3+ CD8+) populations among the GM-CSF+ cells (D) or among the GM-CSF+IFN-γ+ cells from RA SF cells as in C.
Figure 2.
Figure 2.
NK cells are involved in the persistence of STIA. (A–E) STIA was induced by K/BxN serum injection in (A) NK-deficient Mcl1fl/fl:Ncr1-Cre mice or NK-sufficient Mcl1fl/fl mice (n = 18 mice pooled from three independent experiments, SEM), (B) NK-deficient (anti-NK1.1–treated) or NK-sufficient (isotype-treated; n = 12 mice pooled from two independent experiments, SEM), (C) WT or CD45−/− (intact population but functionally deficient NK cells (n = 6 mice from one experiment, SEM), (D) WT or GM-CSF−/− (n = 12 mice pooled from two independent experiments, SEM), and (E) WT or IFN-γ−/− (n = 6 mice from one experiment, SEM). Arthritis development was monitored daily, and FACS-based quantification of joint cell infiltrates (NK cells, neutrophils, and macrophages) was performed at the end of the experiment. p.i., post-injection. *, P < 0.05; **, P < 0.01; ***, P < 0.001.
Figure 3.
Figure 3.
GM-CSF deletion in NK cells alleviates STIA and CIA. (A) Schematic representation of Csf2fl/fl mice with loxP sites flanking exon 3–4 for conditional deletion of Csf2 (GM-CSF) upon crossing with mice carrying specific Cre recombinase under promoter of interest. (B) GM-CSF and IFN-γ analyzed by ELISA in culture supernatant of purified splenic NK cells from Csf2fl/fl, Csf2fl/+:Ncr1-Cre and Csf2fl/fl:Ncr1-Cre mice following stimulation with IL-15 and IL-18 (n = 6 mice pooled from two independent experiments, SEM). (C) STIA development and FACS-based quantification of joint cell infiltrates in Csf2fl/fl and Csf2fl/fl:Ncr1-Cre mice (n = 12 mice pooled from two independent experiments, SEM). (D) Representative intracellular GM-CSF staining of NK cells in the joints of Csf2fl/fl and Csf2fl/fl:Ncr1-Cre mice upon STIA induction as in C. (E) Development of CIA and FACS-based quantification of joint cell infiltrates in Csf2fl/fl and Csf2fl/fl:Ncr1-Cre (n = 18 mice from one experiment, SEM). *, P < 0.05; **, P < 0.01; ***, P < 0.001.
Figure 4.
Figure 4.
IL-18 controls GM-CSF production by synovial NK cells. STIA was induced by K/BxN serum injection in WT or IL-18−/− mice. (A) ELISA of arthritic (STIA) and naive SF from WT mice (n = 8 mice pooled from two independent experiments, SEM). (B and C) Arthritis development and (C) FACS-based quantification of joint cell infiltrates in WT or IL-18−/− mice (n = 18 mice pooled from three independent experiments, SEM). Macs, macrophages. (D) Intracellular GM-CSF staining of NK cells in the arthritic joints of WT or IL-18−/− mice as in B and C. (E) ELISA of arthritic SF from WT and IL-18−/− mice (n = 8 mice pooled from two independent experiments, SEM). *, P < 0.05; **, P < 0.01.
Figure 5.
Figure 5.
GM-CSF induces CIS to limit JAK2-STAT5 signaling in myeloid cells. (A) Expression of mRNA for SOCS proteins (Cish, Socs1, Socs2, and Socs3) by WT mouse BM neutrophils analyzed by real-time PCR, normalized to Gapdh, at indicated times after stimulation with G-CSF or GM-CSF (n = 4 mice pooled from two independent experiments, SEM). Data are expressed as fold induction relative to unstimulated neutrophils. (B) Immunoblot analysis of WT or CIS−/− BM neutrophils stimulated in vitro with 100 ng/ml GM-CSF for indicated times. (C) Immunoblot analysis of WT or CIS−/− BM neutrophils primed with GM-CSF for 3 h, then washed, and cultured in cytokine-free media at various times post-wash. MFI, mean fluorescence intensity. (B and C) One experiment representative of three independent experiments with similar results. (D) Flow-cytometric analysis of CD131 (GM-CSFRβ) surface expression on naive (t0) and G-CSF or GM-CSF–stimulated BM neutrophils from WT:CIS−/− (50:50) chimeric mice (n = 4 mice pooled from two independent experiments, SEM). Data are expressed as fold induction relative to unstimulated WT neutrophils. (E) Putative binding sites and affinity of CIS-SH2-BC to phosphopeptides corresponding to tyrosines in the mouse and human GM-CSFRβ cytoplasmic domain. Data are from two experiments. *, P < 0.05.
Figure S3.
Figure S3.
Characterization of CIS-deficient myeloid cells. (A) Immunoblotting of pSTAT5, CIS, and β-actin in human blood neutrophils and monocytes from healthy donors treated with GM-CSF. One experiment representative of three independent experiments with similar results. (B) Flow-cytometric analysis of myeloid cell populations in the BM, blood, spleen, and peritoneal cavity of naive WT and CIS−/− mice (n = 6 mice from one experiment, SEM). (C) Immunoblot analysis for pJAK2, pSTAT5, p-p38 MAPK, pSAPK/JNK, pErk1/2, CIS, and β-actin of WT or CIS−/− BM neutrophils primed with GM-CSF and washed free of cytokine-containing media before lysis at various times after wash. One experiment representative of three independent experiments with similar results. cDC, conventional dendritic cell.
Figure S4.
Figure S4.
RNASeq analysis of WT and CIS−/− neutrophils. (A–C) MD plots showing log-fold change (CIS−/− vs. WT) and average abundance of genes for the corresponding RNASeq in BM neutrophils following isolation (A, unstimulated), or cultured in GM-CSF-containing media for 4 h (B) or 24 h (C). Significant differentially expressed (absolute log2 FC ≥ 1, FDR ≤ 0.05) genes are colored red (up-regulated) or blue (down-regulated).
Figure 6.
Figure 6.
CIS-deficient neutrophils display extensive transcriptional and proteomic changes in response to GM-CSF. (A) Quantitative RNA transcript analysis (vertical axis, reads per kilobase of exon per million reads) of purified WT and CIS−/− BM neutrophils was performed by RNASeq following GM-CSF stimulation for 24 h. Selected genes that were differentially expressed in CIS−/− neutrophils are shown (n = 3 biological replicates). (B) Volcano plots representing the log2 protein ratios of differentially regulated proteins in CIS−/− relative to WT neutrophils following quantitative analysis. Proteins with a −log10 P > 1.3 and fold change >1 were deemed differentially expressed and are highlighted in orange (n = 3 biological replicates).
Figure S5.
Figure S5.
CIS-deficiency confers hyperactivation of GM-CSF–driven responses in myeloid cells in vitro and in EAE. (A) Immunoblot analysis for cleaved caspase-3, A1/Bfl-1, Mcl-1, or β-actin of WT or CIS−/− BM neutrophils stimulated with GM-CSF and washed free of cytokine-containing media before lysis at various times after wash. One experiment representative of three independent experiments with similar results. (B) CXCL2 and CCL3 analyzed by ELISA in culture supernatant of BM neutrophils from WT and CIS−/− mice following stimulation with GM-CSF for 24 h (n = 3 mice from one experiment, SEM). (C and D) Flow-cytometric analysis of CCRL2 and CD11a surface expression on G-CSF or GM-CSF–stimulated BM neutrophils from WT or CIS−/− mice. (D) Data are expressed as percentage of neutrophils (n = 3 mice from one experiment, SEM). (E) Frequency of CD11c+ GM-Macs in GM-CSF–stimulated BM monocytes from WT and CIS−/− mice at indicated times (n = 4 mice pooled from two independent experiments, SEM). (F) Expression of mRNA for GM-CSF–inducible chemokines (Ccl17 and Ccl22) by BM monocytes analyzed by real-time PCR, normalized to Gapdh, at 8 h after stimulation with GM-CSF (n = 3 mice from one experiment, SEM). (G) Flow-cytometric analysis of WT and CIS−/− BM common myeloid progenitor cells upon culture in IL-3 for 3 d (n = 3 mice from one experiment, SEM). (H) Flow-cytometric analysis of WT and CIS−/− BM eosinophils upon culture in IL-5 for 3 d (n = 3 mice from one experiment, SEM). (I) EAE development in Csf2fl/fl and Csf2fl/fl:R26CreERT2 mice with tamoxifen treatment after EAE onset (n = 12 mice pooled from two independent experiments, SEM). (J) Representative intracellular GM-CSF and IL-17A staining of CD4 T cells in the CNS of Csf2fl/fl and Csf2fl/fl:Ncr1-Cre mice with EAE following tamoxifen treatment as in I. (K) EAE development in WT and CIS−/− mice (n = 12 mice pooled from two independent experiments, SEM). (L) Representative intracellular GM-CSF and IL-17A staining of CD4 T cells in the CNS of WT and CIS−/− mice with EAE as in K. *, P < 0.05; **, P < 0.01.
Figure 7.
Figure 7.
CIS-deficient mice develop exacerbated STIA due to deregulated GM-CSF activation in neutrophils. (A) Arthritis development of WT and CIS−/− mice (n = 12 mice pooled from two independent experiments, SEM). (B) Bioluminescence imaging of myeloperoxidase activity in the arthritic joints of WT and CIS−/− mice, quantified as average radiance (n = 8 mice pooled from two independent experiments, SEM). (C) Pro-inflammatory mediators (GM-CSF, TNF, IL-1β, LTB4, CXCL2, CCL3, and CCL17) analyzed by ELISA in SF of arthritic WT and CIS−/− mice (n = 8 mice pooled from two independent experiments, SEM). (D) Representative CD131 (GM-CSFRβ) expression in blood neutrophils and monocytes of Csf2rbfl/fl and Csf2rbfl/fl:Mrp8-Cre mice (n = 6 mice from one experiment). (E) Arthritis development in Csf2rbfl/fl and Csf2rbfl/fl:Mrp8-Cre mice (n = 6 mice from one experiment, SEM). (F) Intracellular GM-CSF staining of NK cells in the joints of WT and CIS−/− mice during STIA (n = 8 mice pooled from two independent experiments, SEM). (G) Arthritis development in WT and CIS−/− mice (treated with isotype, anti-NK1.1 or anti-GM-CSF mAbs; n = 12 mice pooled from two independent experiments, SEM). **, P < 0.01; ***, P < 0.001.

Similar articles

Cited by

References

    1. Achuthan A., Cook A.D., Lee M.C., Saleh R., Khiew H.W., Chang M.W., Louis C., Fleetwood A.J., Lacey D.C., Christensen A.D., et al. . 2016. Granulocyte macrophage colony-stimulating factor induces CCL17 production via IRF4 to mediate inflammation. J. Clin. Invest. 126:3453–3466. 10.1172/JCI87828 - DOI - PMC - PubMed
    1. Al-Mossawi M.H., Chen L., Fang H., Ridley A., de Wit J., Yager N., Hammitzsch A., Pulyakhina I., Fairfax B.P., Simone D., et al. . 2017. Unique transcriptome signatures and GM-CSF expression in lymphocytes from patients with spondyloarthritis. Nat. Commun. 8:1510 10.1038/s41467-017-01771-2 - DOI - PMC - PubMed
    1. Alvaro-Gracia J.M., Zvaifler N.J., Brown C.B., Kaushansky K., and Firestein G.S.. 1991. Cytokines in chronic inflammatory arthritis. VI. Analysis of the synovial cells involved in granulocyte-macrophage colony-stimulating factor production and gene expression in rheumatoid arthritis and its regulation by IL-1 and tumor necrosis factor-alpha. J. Immunol. 146:3365–3371. - PubMed
    1. Anzai A., Choi J.L., He S., Fenn A.M., Nairz M., Rattik S., McAlpine C.S., Mindur J.E., Chan C.T., Iwamoto Y., et al. . 2017. The infarcted myocardium solicits GM-CSF for the detrimental oversupply of inflammatory leukocytes. J. Exp. Med. 214:3293–3310. 10.1084/jem.20170689 - DOI - PMC - PubMed
    1. Bär E., Whitney P.G., Moor K., Reis e Sousa C., and LeibundGut-Landmann S.. 2014. IL-17 regulates systemic fungal immunity by controlling the functional competence of NK cells. Immunity. 40:117–127. 10.1016/j.immuni.2013.12.002 - DOI - PubMed

Publication types

MeSH terms

Substances