. 2020 May 4;217(5):e20191660.
doi: 10.1084/jem.20191660.

Stearoyl-CoA desaturase-1 impairs the reparative properties of macrophages and microglia in the brain

Affiliations

Stearoyl-CoA desaturase-1 impairs the reparative properties of macrophages and microglia in the brain

Jeroen F J Bogie et al. J Exp Med. .

Abstract

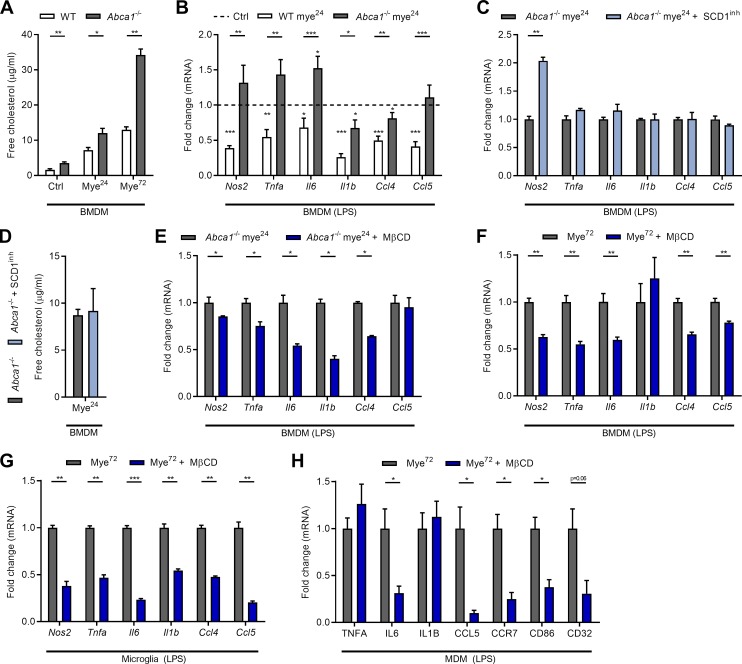
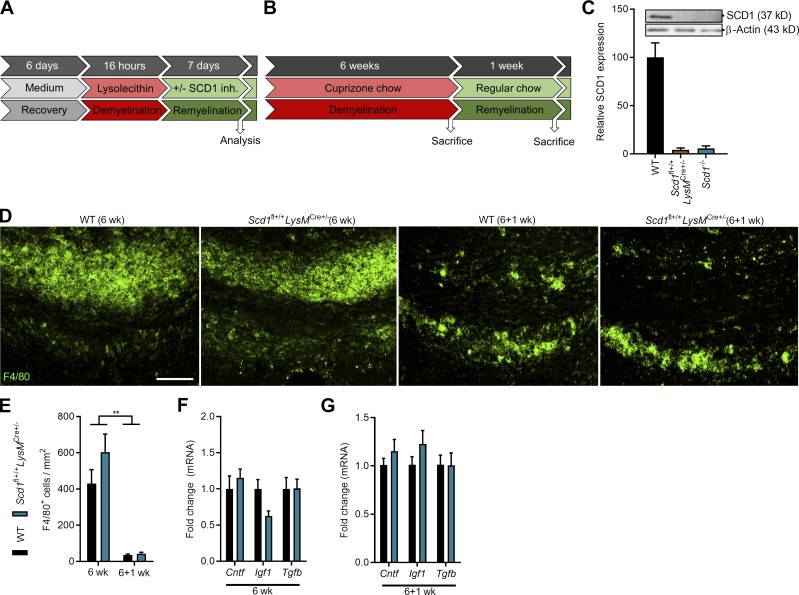
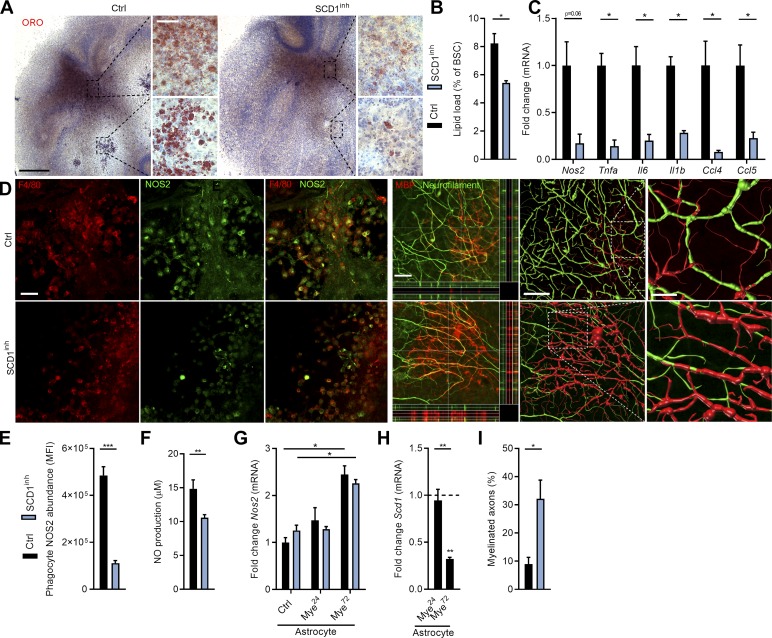
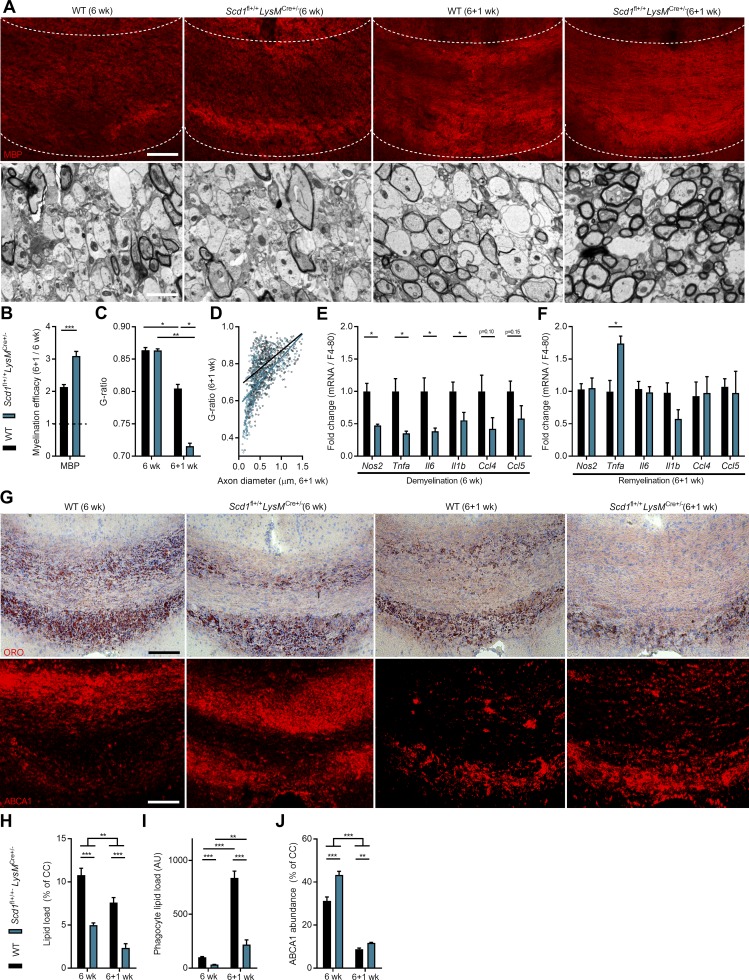
Failure of remyelination underlies the progressive nature of demyelinating diseases such as multiple sclerosis. Macrophages and microglia are crucially involved in the formation and repair of demyelinated lesions. Here we show that myelin uptake temporarily skewed these phagocytes toward a disease-resolving phenotype, while sustained intracellular accumulation of myelin induced a lesion-promoting phenotype. This phenotypic shift was controlled by stearoyl-CoA desaturase-1 (SCD1), an enzyme responsible for the desaturation of saturated fatty acids. Monounsaturated fatty acids generated by SCD1 reduced the surface abundance of the cholesterol efflux transporter ABCA1, which in turn promoted lipid accumulation and induced an inflammatory phagocyte phenotype. Pharmacological inhibition or phagocyte-specific deficiency of Scd1 accelerated remyelination ex vivo and in vivo. These findings identify SCD1 as a novel therapeutic target to promote remyelination.


Conflict of interest statement

Disclosures: The authors declare no competing interests exist.

Figures

Figure 1.
Figure 1.
Sustained exposure to myelin increases the intracellular cholesterol load in phagocytes. (A–D) Representative images and quantification of ORO (EC) and filipin (FC) staining of active lesion in postmortem brain tissue of MS patients (n = 3 lesions from three different MS patients). Phagocyte EC and FC load was determined by defining the cellular area covered by ORO+ and FC+ droplets. Scale bars, 500 µm (overview); 50 µm (inset). (E and F) Representative images of ORO and filipin staining of mouse BMDMs, mouse microglia, and human MDMs treated with myelin for 24 or 72 h, or left untreated (Ctrl). Scale bar, 30 µm. (G) Quantification of total cholesterol, FC, and EC in BMDMs (n = 7 wells), microglia (n = 5 wells), and MDMs (n = 7 wells) treated with myelin for 24 or 72 h, or left untreated (Ctrl). Results are pooled from or representative of two (E–G) or three (A–D) independent experiments. Human MDM cultures from seven donors were used (G). All data are represented as mean ± SEM. *, P < 0.05, **, P < 0.01, and ***, P < 0.001, one-way ANOVA.
Figure S1.
Figure S1.
Sustained exposure to myelin promotes an inflammatory phagocyte phenotype and induces SCD1 abundance and activity. (A and B) Representative images of ORO (EC) and CD68/filipin (FC) staining of NAWM of control brain tissue (n = 2 nonneurological controls). Scale bar, 100 µm. (C) Experimental setup of mouse BMDM, mouse microglia, and human MDM experiments. (D) Viability of BMDMs, microglia, and MDMs treated with myelin for 24 or 72 h (n = 4 wells). Dotted line represents untreated cells. (E) mRNA expression of inflammatory factors in IFN-G/IL-1B–stimulated BMDMs (n = 5 wells), microglia (n = 6 wells), and MDMs (n = 6 wells) treated with myelin for 24 or 72 h, or left untreated (dotted line, Ctrl). (F) Representative images of untreated (Ctrl) and myelin-treated (24 and 72 h) BMDMs, microglia, and MDMs stained for SCD1. (G) Flow-cytometric analysis of SCD1 in WT, LXRα−/−, LXRβ−/−, and LXRα−/−LXRβ−/− BMDMs treated with myelin for 72 h (n = 5 wells). Dotted line represents untreated BMDMs. (H and I) Quantification of the percent of phagocytes expressing SCD1 within the phagocyte pool and the percent of phagocytes expressing SCD1 within the SCD1+ cell pool of active MS lesions stained for SCD1/IBA1 (n = 3 lesions from three different MS patients). (J) Representative mass spectrometry images of individual intact PC lipid species (PC36:2 and PC36:1) in active MS lesions (ratio is depicted in Fig. 3 G). Data are represented as normalized intensity. Mass error is depicted in parts per million (ppm). (K) Mass spectrometry image of the ratio of intact PC lipid species and corresponding ORO staining of a second active MS lesion. The PC36:2/PC36:1 ratio was calculated based on intensity images of individual PC lipid species. Scale bar, 500 µm. (L) Representative mass spectrometry images of PC36:2 and PC36:1 in the second active MS lesion. Data are represented as normalized intensity. Mass error is depicted in parts per million. Results are pooled from or representative of two (A, B, D–F, and J–L) and three (H and I) independent experiments . For human MDM cultures, three (E) and four (D) donors were used. All data are represented as mean ± SEM. *, P < 0.05, **, P < 0.01, and ***, P < 0.001 unpaired Student’s t test (A and E), one-way ANOVA (G–I).
Figure 2.
Figure 2.
Prolonged exposure to myelin promotes an inflammatory phagocyte phenotype. (A–C) mRNA expression of inflammatory factors in LPS-stimulated human MDMs (n = 7 wells), mouse BMDMs (n = 5 wells), and mouse microglia (n = 6 wells) treated with myelin for 24 or 72 h, or left untreated (dotted line, Ctrl). (D–L) Representative immunofluorescence images and quantification (MFI of CCR7, CD32, and IL-1B in phagocytes, and number of phagocytes expressing CCR7, CD32, and IL-1B) of an active MS lesion stained with CCR7/CD68, CD32/IBA1, and IL-1B/IBA1 (n = 3 lesions from three different MS patients). Scale bars, 500 µm (overview); 50 µm (inset). Results are pooled from or representative of two (B and C) or three (D–L) independent experiments. Human MDM cultures from seven donors were used (A). All data are represented as mean ± SEM. *, P < 0.05, **, P < 0.01, and ***, P < 0.001, unpaired Student’s t test (A–C), one-way ANOVA (G–L).
Figure 3.
Figure 3.
Myelin internalization increases SCD1 abundance and activity in phagocytes. (A) mRNA expression of Scd isoforms in myelin-treated BMDMs, microglia, and MDMs (24 and 72 h, n = 6 wells). Dotted line represents untreated cells (Ctrl). (B) Flow-cytometric analysis of SCD1 abundance in myelin-treated BMDMs, microglia, and MDMs (24 and 72 h, n = 6 wells). Side scatter measurement was used to identify phagocytes that internalized little (SSClo) and large (SSChi) amounts of myelin. Dotted line represents untreated cells (Ctrl). (C) ESI-MS/MS–based lipidomics analysis of intact PC in myelin-treated BMDMs (24 and 72 h, n = 2 wells). (D) GC/MS analysis of the methyl esters of FAs hydrolyzed from untreated and myelin-treated BMDMs (72 h). Desaturation indices were determined by calculating the 16:1/16:0 and 18:1/18:0 ratios (n = 4 wells). (E and F) Representative images and quantification (MFI) of SCD1 in lesional phagocytes. Active MS lesions were stained for SCD1/IBA1 (n = 3 lesions from three different MS patients). Scale bar, 50 µm. (G) Mass spectrometry image of the ratio of intact PC lipid species and corresponding ORO staining of an active MS lesion. The PC 36:2/PC 36:1 ratio was calculated based on intensity images of individual PC lipid species (Fig. S1 J). A second active MS lesion is shown in Fig. S1, K and L. Scale bar, 500 µm. Results are pooled from or representative of two (A–D and G) or three (E and F) independent experiments. Human MDM cultures from six donors were used (A). All data are represented as mean ± SEM. *, P < 0.05, **, P < 0.01, and ***, P < 0.001, unpaired Student’s t test (A, B, and D), one-way ANOVA (E).
Figure S2.
Figure S2.
The impact of SCD1 on the physiology of mye-phagocytes. (A) ESI-MS/MS–based lipidomics analysis of intact PC in mye72-BMDMs treated with an SCD1 inhibitor or vehicle (n = 2 wells). (B) Relative gene expression of neurotrophic factors in LPS-stimulated mye72-BMDMs (n = 5 wells), -microglia (n = 6 wells), and -MDMs (n = 4 wells) treated with an SCD1 inhibitor or vehicle (tumor growth factor β [Tgfb], insulin growth factor 1 [Igf1], ciliary neurotrophic factor [Cntf]). (C) Viability of BMDMs (n = 10 wells), microglia (n = 6 wells), and MDMs (n = 8 wells) exposed to an SCD1 inhibitor or vehicle. (D) Uptake of fluorescently-labeled myelin (n = 4–6 wells) and beads (n = 4 or 5 wells) by BMDMs, microglia, and MDMs treated with an SCD1 inhibitor or vehicle (Ctrl). (E) Representative transmission electron microscopy images of untreated BMDMs (Ctrl), mye72-BMDMs, and mye72-BMDMs treated with an SCD1 inhibitor (n = 4 wells, 5 cells/well were analyzed). Blue arrowheads and arrows point to lipid droplets and myelin-containing organelles (mye-organelles), respectively. Scale bar, 5 µm. (F and G) Quantification of the number and size of lipid droplets and mye-organelles in untreated BMDMs (Ctrl), mye72-BMDMs, and mye72-BMDMs treated with an SCD1 inhibitor (n = 4 wells, 5 cells/well were analyzed). Results are pooled from or representative of two (A–G) independent experiments. For human MDM cultures, four donors were used (B–D). All data are represented as mean ± SEM. *, P < 0.05, **, P < 0.01, and ***, P < 0.001, unpaired Student’s t test (B–D), one-way ANOVA (F and G).
Figure 4.
Figure 4.
SCD1 controls the inflammatory phenotype shift of mye-phagocytes. (A) mRNA expression of inflammatory mediators in LPS-stimulated WT, Scd1−/−, and SCD1 inhibitor-treated BMDMs exposed to myelin for 72 h (n = 5 wells). (B) NO and TNF-A concentration in culture supernatants of LPS-stimulated WT, Scd1−/−, and SCD1 inhibitor-treated mye72-BMDMs (n = 5 wells). (C and D) mRNA expression of inflammatory mediators in LPS-stimulated mouse microglia (n = 6 wells) and human MDMs (n = 8 wells) exposed to myelin and an SCD1 inhibitor for 72 h. (E and F) Quantification of total cholesterol in WT, Scd1−/−, and SCD1 inhibitor-treated mye72-BMDMs (E, n = 6 wells), and SCD1-inhibitor treated mye72-microglia (F, n = 6 wells) and -MDMs (F, n = 8 wells). Results are pooled from two independent experiments (A–C, E, and F). Human MDM cultures from four donors were used (D and F). All data are represented as mean ± SEM. *, P < 0.05, **, P < 0.01, and ***, P < 0.001, one-way ANOVA (A, B, and E), unpaired Student’s t test (C, D, and F).
Figure 5.
Figure 5.
Myelin uptake decreases ABCA1 surface levels in an SCD1-dependent manner. (A) mRNA expression of Abca1 in BMDMs (n = 5 wells), microglia (n = 6 wells), and MDMs (n = 6 wells) treated with myelin for 24 and 72 h. Dotted line represents untreated cells (Ctrl). (B–G) Surface ABCA1 abundance (n = 5 or 6 wells) and relative capacity to efflux cholesterol (n = 6 wells) of WT, Scd1−/−, and SCD1 inhibitor-treated BMDMs exposed to myelin for 24 or 72 h (B and E), and mye-microglia (C and F) and mye–MDM (D and G) treated with the SCD1 inhibitor. Dotted line represents untreated cells (Ctrl). (H) Cholesterol efflux capacity of BMDMs treated with different MUFAs (50 µM; n = 3 wells). (I–L) Representative immunofluorescence images and quantification (MFI of ABCA1 in phagocytes and percentage of phagocytes expressing ABCA1 on the cell surface within the phagocyte pool) of an active MS lesion stained for ABCA1/CD68 (n = 3 lesions from three different MS patients). Scale bars, 50 µm (I); 20 µm (L). Results are pooled from or representative of two (A–H) or three (I–L) independent experiments. Human MDM cultures from six donors were used (A, D, and G). All data are represented as mean ± SEM. *, P < 0.05, **, P < 0.01, and ***, P < 0.001, unpaired Student’s t test (A and H), one-way ANOVA (B–G, J, and K).
Figure S3.
Figure S3.
Sustained myelin internalization increases the formation of ABCA1-destablizing FAs and promotes inflammatory cholesterol accumulation. (A) ABCA1 abundance in HeLa-ABCA1gfp cells treated with myelin for 24 or 72 h, or left untreated (Ctrl, n = 6 wells). (B) Uptake of fluorescently labeled myelin (myelinDiI) by HeLa-ABCA1gfp cells (n = 4 wells). (C and D) Representative images and quantification (percent cell area covered with lipid droplets) of ORO (EC) staining of myelin-treated HeLa-ABCA1gfp cells. Scale bar, 20 µm (n = 2 wells). (E and F) GC/MS analysis of the methyl esters of FAs hydrolyzed from untreated (Ctrl) and myelin-treated BMDMs (24 or 72 h, n = 4 wells). (G) Relative uptake of MUFAs (1, 10, and 50 µM), determined by measuring the SSC (n = 3 wells). (H) ABCA1 abundance in HeLa-ABCA1gfp cells treated with MUFAs for 24 h (1, 10, and 50 µM; n = 4 wells). (I) Surface ABCA1 abundance on myelin-treated (24 h) mouse BMDMs (n = 5 wells), mouse microglia (n = 6 wells), and human MDMs (n = 4 wells) exposed to rottlerin (PKCδ inhibitor) or vehicle. (J and K) Immunoblot analysis of ABCA1 protein levels in WT and Abca1fl+/+LysmCre+/− BMDMs stimulated with the LXR agonist T0901317 (n = 2/3 cultures of different animals). (L) Viability of WT and Abca1−/−-BMDMs exposed to myelin for 72 h (n = 4 wells). (M and N) Cholesterol content (n = 7 wells) and viability (n = 7 wells) of mye72-BMDMs exposed to MβCD (1, 2.5, and 5% m/v) or vehicle. Results are pooled from or representative of two (A–J, M, and N) and three (K and L) independent experiments. For human MDM cultures, four donors were used (I). All data are represented as mean ± SEM. *, P < 0.05, **, P < 0.01, and ***, P < 0.001, one-way ANOVA (A, D–H, M, and N), unpaired Student’s t test (B, K, and L).
Figure 6.
Figure 6.
Myelin uptake impacts the metabolic and inflammatory phenotype of phagocytes in a PKCδ-dependent manner. (A) Surface ABCA1 abundance on myelin-treated mouse BMDMs (n = 5 wells), mouse microglia (n = 6 wells), and human MDMs (n = 4 wells) exposed to rottlerin (PKCδ inhibitor) or vehicle. (B–E) Representative images and quantification of ORO (EC) and filipin (FC) staining of untreated phagocytes (Ctrl) and mye72-phagocytes treated with rottlerin or vehicle (n = 4 wells). Scale bar, 20 µm. (F–H) mRNA expression of inflammatory mediators in LPS-stimulated mye72-BMDMs (n = 11 wells), -microglia (n = 6), and -MDMs (n = 4 wells) treated with rottlerin or vehicle. Results are pooled from or representative of two (A–E, G, and H) or three (F) independent experiments. Human MDM cultures from four donors were used (A–E and H). All data are represented as mean ± SEM. *, P < 0.05, **, P < 0.01, and ***, P < 0.001, unpaired Student’s t test (A, F, G, and H), one-way ANOVA (D and E).
Figure 7.
Figure 7.
Accumulation of inflammatory FC underlies the SCD1-induced phenotype shift. (A) Quantification of FC in WT and Abca1−/− BMDMs treated with myelin for 24 or 72 h (mye24- or mye72-BMDMs), or left untreated (Ctrl, n = 5 wells). (B) mRNA expression of inflammatory mediators in LPS-stimulated WT and Abca1−/− mye24-BMDMs (n = 6 wells). Dotted line represents untreated BMDMs (Ctrl). (C) mRNA expression of inflammatory mediators in LPS-stimulated Abca1−/− mye24-BMDMs treated with an SCD1 inhibitor or vehicle (n = 5 wells). (D) Quantification of FC in Abca1−/− mye24-BMDMs treated with a selective SCD1 inhibitor or vehicle (n = 4 wells). (E) mRNA expression of inflammatory mediators in LPS-stimulated Abca1−/− mye24-BMDMs treated with MβCD (2.5% m/v) or vehicle (n = 6 wells). (F–H) mRNA expression of inflammatory mediators in LPS-stimulated mye72-BMDMs (n = 6 wells), -microglia (n = 6 wells) and -MDMs (n = 4 wells) treated with MβCD or vehicle. Results are pooled from two independent experiments (A–G). Human MDM cultures from four donors were used (H). All data are represented as mean ± SEM. *, P < 0.05, **, P < 0.01, and ***, P < 0.001, unpaired Student’s t test (A–H).
Figure S4.
Figure S4.
Confirmation of SCD1 ablation and pathological parameters of Scd1fl+/+LysmCre+ mice. (A and B) Experimental setup of the brain slice culture model for remyelination (A) and cuprizone-induced acute demyelination in vivo model (B). SCD1 inh., SCD1 inhibitor. (C) Immunoblot analysis of SCD1 protein in WT, Scd1fl+/+LysmCre+/−, and Scd1−/− BMDMs stimulated with the LXR agonist T0901317 (n = 2 cultures of different animals). (D and E) Representative immunofluorescence images and quantification of F4/80 staining of CC from WT (6 wk, n = 11 animals; 6+1 wk, n = 10 animals) and Scd1fl+/+LysMCre+/− mice (6 wk, n = 7 animals; 6+1 wk, n = 6 animals). Scale bar, 100 µm. (F and G) mRNA expression of neurotrophic factors in CC of WT (6 w, n = 11 animals; 6+1 wk, n = 10 animals) and Scd1fl+/+LysMCre+/− mice (6 w, n = 7 animals; 6+1 wk, n = 6 animals) after cuprizone-induced demyelination (6 w) and subsequent remyelination (6+1 wk). All replicates were biologically independent. All data are represented as mean ± SEM. **, P < 0.01, unpaired Student’s t test (E–G).
Figure 8.
Figure 8.
SCD1 inhibition stimulates remyelination in an ex vivo cerebellar brain slice model. (A and B) Representative images and quantification (lipid load defined as percent area covered in lipid droplets of the total brain slice area) of ORO (EC) staining of cerebellar brain slices treated with an SCD1 inhibitor or vehicle (n = 3 slices). Scale bars, 500 µm (overview); 50 µm (inset). (C) mRNA expression of inflammatory mediators in cerebellar brain slice cultures treated with an SCD1 inhibitor or vehicle (n = 4 slices). (D) Representative immunofluorescence images of brain slice cultures treated with vehicle or an SCD1 inhibitor and stained for NOS2/F4/80+ (n = 3 slices; scale bar, 50 µm) and MBP/neurofilament (n = 3 slices; scale bar, 50 µm; orthogonal and three-dimensional reconstruction). (E) Quantification of NOS2 abundance (MFI) in F4/80+ phagocytes in brain slices treated with vehicle or an SCD1 inhibitor (n = 3 slices). (F) NO concentration in culture supernatants of brain slices treated with an SCD1 inhibitor or vehicle (n = 4 slices). (G and H) mRNA expression of Nos2 and Scd1 in LPS-stimulated control and myelin-treated (24 h and 72 h) mouse astrocytes cultures (n = 3 wells). Dotted line represents control cultures (H). (I) Percentage of MBP+ NF+ axons out of total NF+ axons in brain slices treated with the SCD1 inhibitor or vehicle (n = 4 slices). Results are pooled from or representative of three (A, B, D, E, G, and H) or four (C, F, I, and J) independent experiments. Each replicate represents one brain slice. All data are represented as mean ± SEM. *, P < 0.05, **, P < 0.01, and ***, P < 0.001, unpaired Student’s t test (B, C, E, F, H, and I), one-way ANOVA (G).
Figure 9.
Figure 9.
Phagocyte-specific Scd1 deficiency improves remyelination in the cuprizone model. (A) Representative images of immunofluorescence MBP staining and transmission electron microscopy analysis of CC from WT (Scd1fl−/−LysMCre+/− and Scd1fl+/+LysMCre−/−) and Scd1fl+/+LysMCre+/− mice after cuprizone-induced demyelination (6 wk) and subsequent remyelination (6+1 wk). The outer border of the CC is demarcated by the dotted line. Scale bars, 100 µm (MBP staining); 2 µm (transmission electron microscopy). (B) Quantification of the remyelination efficacy (calculated by dividing the percent myelination at 6+1 wk by the percent myelination at 6 wk using the MBP staining) in CC from WT (6 wk, n = 11 animals; 6+1 wk, n = 10 animals) and Scd1fl+/+LysMCre+/− mice (6 wk, n = 7 animals; 6+1 wk, n = 6 animals). (C and D) Analysis of the g-ratio (the ratio of the inner axonal diameter to the total outer diameter) and g-ratio as a function of axon diameter in CC from WT (6 wk, n = 4 animals; 6+1 wk, n = 8 animals) and Scd1fl+/+LysMCre+/− mice (6 wk, n = 4 animals; 6+1 wk, n = 4 animals). (E and F) mRNA expression of inflammatory mediators in CC of WT (n = 10 or 11 animals, see B) and Scd1fl+/+LysMCre+/− mice (n = 6 or 7 animals, see B) after 6 wk and 6+1 wk. Gene expression was corrected for the number of F4/80+ phagocytes. (G) Representative images of ORO (EC) and immunofluorescence ABCA1 staining of CC from WT (n = 10 or 11 animals, see B) and Scd1fl+/+LysMCre+/− (n = 6 or 7 animals, see B) mice after 6 wk and 6+1 wk. Scale bar, 100 µm. (H and I) Quantification of ORO staining (lipid load defined as percent ORO+ area of total CC area [H] and lipid load corrected for the number of F4/80+ macrophages [I]) and ABCA1 staining (% ABCA1+ area of total CC area) of CC from WT (n = 10 or 11 animals, see B) and Scd1fl+/+LysMCre+/− (n = 6 or 7 animals, see B) mice after 6 wk and 6+1 wk. AU, arbitrary unit. All replicates were biologically independent. All data are represented as mean ± SEM. *, P < 0.05, **, P < 0.01, and ***, P < 0.001, unpaired Student’s t test (B, E, and F), one-way ANOVA (C, H, I, and J).
Figure S5.
Figure S5.
Whole-body Scd1 deficiency improves remyelination in the cuprizone model. (A) Representative images of immunofluorescence MBP staining and TEM analysis of CC derived from WT and Scd1−/− mice after cuprizone-induced demyelination (6 wk) and subsequent remyelination (6+1 wk; n = 5 animals/group). Scale bars, 100 µm (MBP staining); 2 µm (TEM). (B) Quantification of the remyelination efficacy (calculated by dividing the percent myelination at 6+1 wk by the percent myelination at 6 wk using the MBP staining) in CC from WT and Scd1−/− mice (n = 5 animals/group). (C and D) Analysis of the g-ratio (the ratio of the inner axonal diameter to the total outer diameter) and g-ratios as a function of axon diameter in CC from WT (6 wk, n = 4 animals; 6+1 wk, n = 2 animals) and Scd1−/− mice (6 wk, n = 4 animals; 6+1 wk, n = 2 animals). (E and F) mRNA expression inflammatory mediators in CC of WT and Scd1−/− mice after 6 wk (n = 5 animals) and 6+1 wk (n = 9 animals). Gene expression was corrected for the number of F4/80+ phagocytes. (G) Representative images of F4/80, ORO (EC), and ABCA1 staining of CC from WT and Scd1−/− mice after cuprizone-induced demyelination (6 wk, n = 5 animals/group) and subsequent remyelination (6+1 wk, n = 5 animals/group). Scale bar, 100 µm. (H–K) Quantification of F4/80 staining, ORO staining (lipid load defined as percent ORO+ area of total CC area, lipid load corrected for number of F4/80+ macrophages), and ABCA1 staining (% ABCA1+ area of total CC area; n = 5 animals/group). (L and M) mRNA expression of neurotrophic factors in CC of WT and Scd1−/− mice after cuprizone-induced demyelination (6 wk, n = 5 animals/group) and subsequent remyelination (6+1 wk, n = 9 animals/group). All replicates were biologically independent. All data are represented as mean ± SEM. *, P < 0.05, and **, P < 0.01, unpaired Student’s t test (B, E, F, L, and M), one-way ANOVA (C and H–K).

References

    1. Ajami B., Bennett J.L., Krieger C., McNagny K.M., and Rossi F.M.. 2011. Infiltrating monocytes trigger EAE progression, but do not contribute to the resident microglia pool. Nat. Neurosci. 14:1142–1149. 10.1038/nn.2887 - DOI - PubMed
    1. Alberti S., Schuster G., Parini P., Feltkamp D., Diczfalusy U., Rudling M., Angelin B., Björkhem I., Pettersson S., and Gustafsson J.A.. 2001. Hepatic cholesterol metabolism and resistance to dietary cholesterol in LXRbeta-deficient mice. J. Clin. Invest. 107:565–573. 10.1172/JCI9794 - DOI - PMC - PubMed
    1. Amar M.J., D’Souza W., Turner S., Demosky S., Sviridov D., Stonik J., Luchoomun J., Voogt J., Hellerstein M., Sviridov D., and Remaley A.T.. 2010. 5A apolipoprotein mimetic peptide promotes cholesterol efflux and reduces atherosclerosis in mice. J. Pharmacol. Exp. Ther. 334:634–641. 10.1124/jpet.110.167890 - DOI - PMC - PubMed
    1. Anderson E.K., Hill A.A., and Hasty A.H.. 2012. Stearic acid accumulation in macrophages induces toll-like receptor 4/2-independent inflammation leading to endoplasmic reticulum stress-mediated apoptosis. Arterioscler. Thromb. Vasc. Biol. 32:1687–1695. 10.1161/ATVBAHA.112.250142 - DOI - PMC - PubMed
    1. Arnett H.A., Mason J., Marino M., Suzuki K., Matsushima G.K., and Ting J.P.. 2001. TNF alpha promotes proliferation of oligodendrocyte progenitors and remyelination. Nat. Neurosci. 4:1116–1122. 10.1038/nn738 - DOI - PubMed

Publication types

MeSH terms