

Evidence That Emmetropization Buffers Against Both Genetic and Environmental Risk Factors for Myopia
- PMID: 32097480
- PMCID: PMC7329625
- DOI: 10.1167/iovs.61.2.41
Evidence That Emmetropization Buffers Against Both Genetic and Environmental Risk Factors for Myopia
Abstract
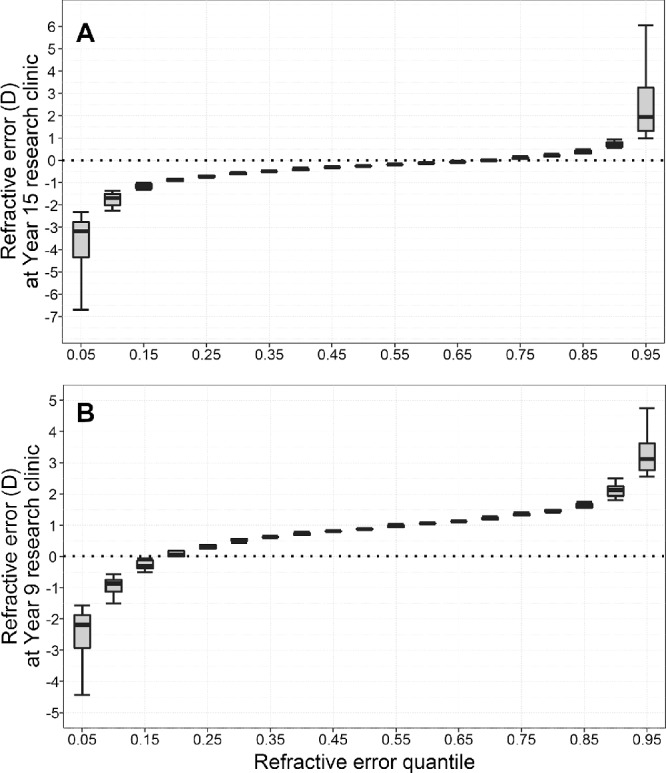
Purpose: To test the hypothesis that emmetropization buffers against genetic and environmental risk factors for myopia by investigating whether risk factor effect sizes vary depending on children's position in the refractive error distribution.
Methods: Refractive error was assessed in participants from two birth cohorts: Avon Longitudinal Study of Parents and Children (ALSPAC) (noncycloplegic autorefraction) and Generation R (cycloplegic autorefraction). A genetic risk score for myopia was calculated from genotypes at 146 loci. Time spent reading, time outdoors, and parental myopia were ascertained from parent-completed questionnaires. Risk factors were coded as binary variables (0 = low, 1 = high risk). Associations between refractive error and each risk factor were estimated using either ordinary least squares (OLS) regression or quantile regression.
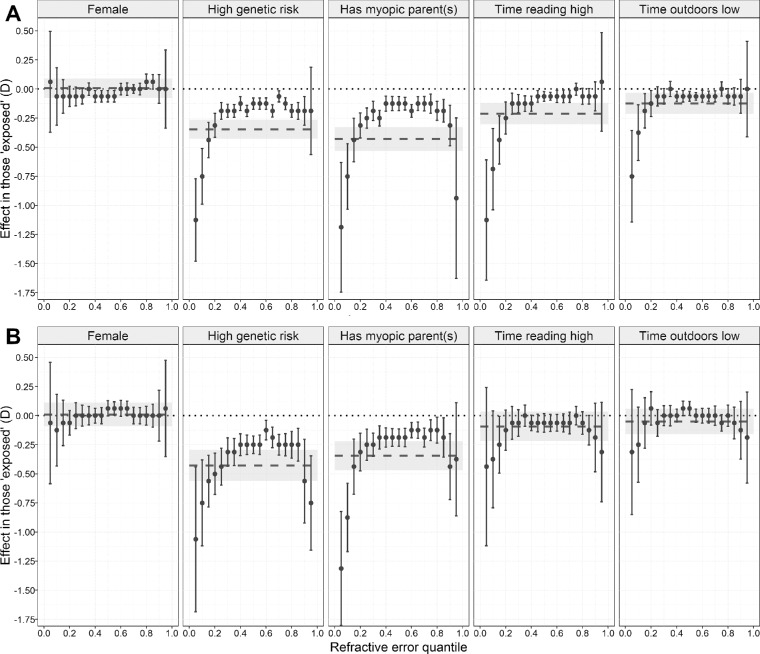
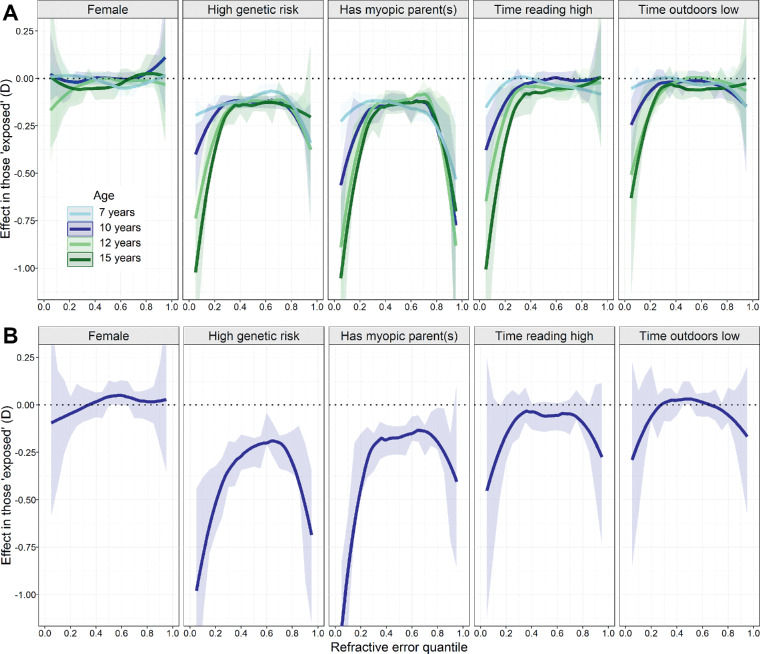
Results: Quantile regression: effects associated with all risk factors (genetic risk, parental myopia, high time spent reading, low time outdoors) were larger for children in the extremes of the refractive error distribution than for emmetropes and low ametropes in the center of the distribution. For example, the effect associated with having a myopic parent for children in quantile 0.05 vs. 0.50 was as follows: ALSPAC: age 15, -1.19 D (95% CI -1.75 to -0.63) vs. -0.13 D (-0.19 to -0.06), P = 0.001; Generation R: age 9, -1.31 D (-1.80 to -0.82) vs. -0.19 D (-0.26 to -0.11), P < 0.001. Effect sizes for OLS regression were intermediate to those for quantiles 0.05 and 0.50.
Conclusions: Risk factors for myopia were associated with much larger effects in children in the extremes of the refractive error distribution, providing indirect evidence that emmetropization buffers against both genetic and environmental risk factors.
Conflict of interest statement
Disclosure:
Figures
References
-
- Wei S, Sun Y, Li S, et al.. Refractive errors in university students in central China: the Anyang University Students Eye Study. Invest Ophthalmol Vis Sci. 2018; 59: 4691–4700. - PubMed
-
- Verkicharla PK, Ohno-Matsui K, Saw SM. Current and predicted demographics of high myopia and an update of its associated pathological changes. Ophthalmic Physiol Opt. 2015; 35: 465–475. - PubMed
-
- Wong TY, Ferreira A, Hughes R, Carter G, Mitchell P. Epidemiology and disease burden of pathologic myopia and myopic choroidal neovascularization: an evidence-based systematic review. Am J Ophthalmol. 2014; 157: 9–25. - PubMed
-
- Wong YL, Sabanayagam C, Ding Y, et al.. Prevalence, risk factors, and impact of myopic macular degeneration on visual impairment and functioning among adults in Singapore. Invest Ophthalmol Vis Sci. 2018; 59: 4603–4613. - PubMed
Publication types
MeSH terms
Grants and funding
LinkOut - more resources
Full Text Sources
Medical
