

Specific effect of hypobaria on cerebrovascular hypercapnic responses in hypoxia
- PMID: 32097541
- PMCID: PMC7058173
- DOI: 10.14814/phy2.14372
Specific effect of hypobaria on cerebrovascular hypercapnic responses in hypoxia
Abstract
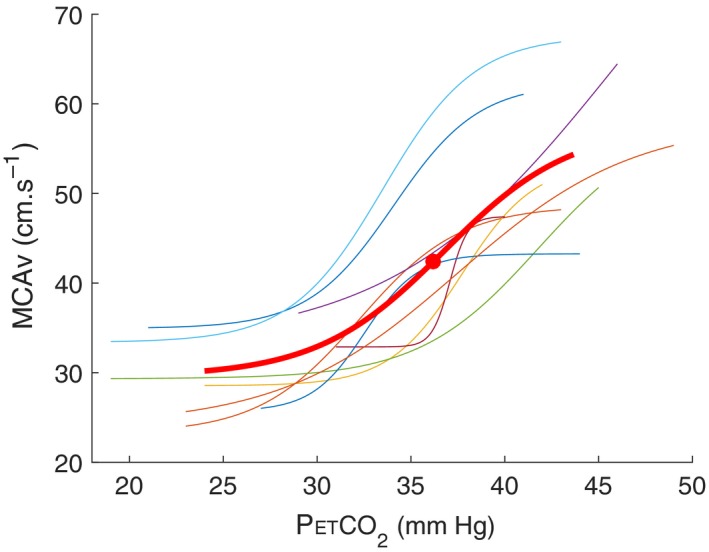
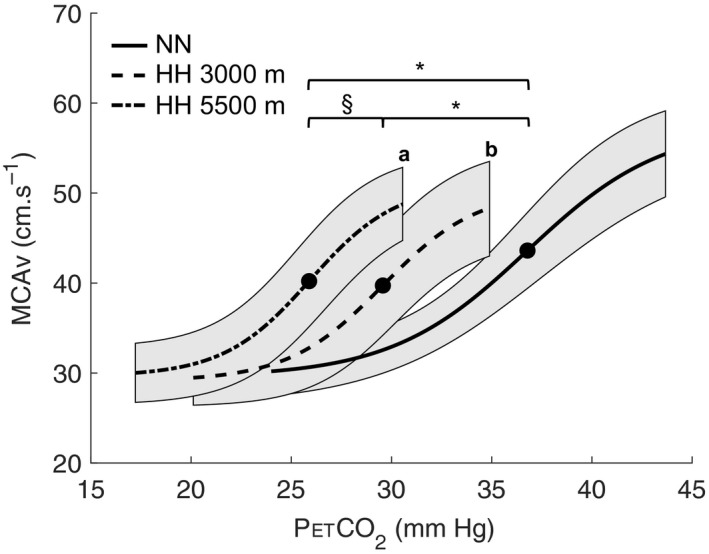
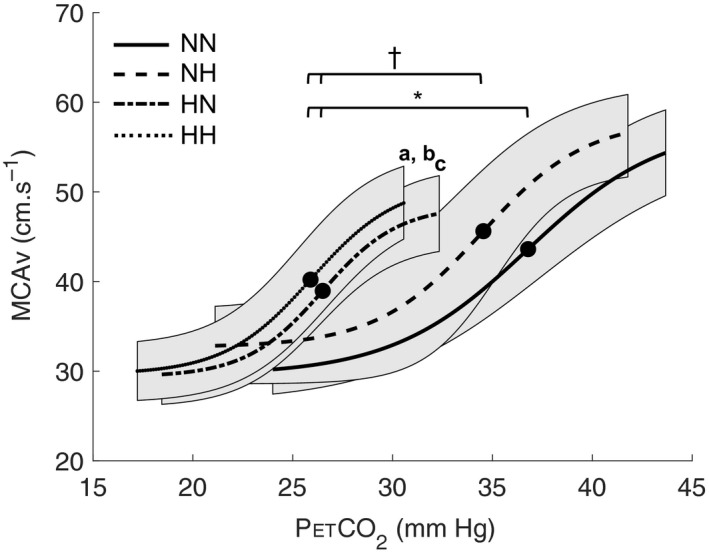
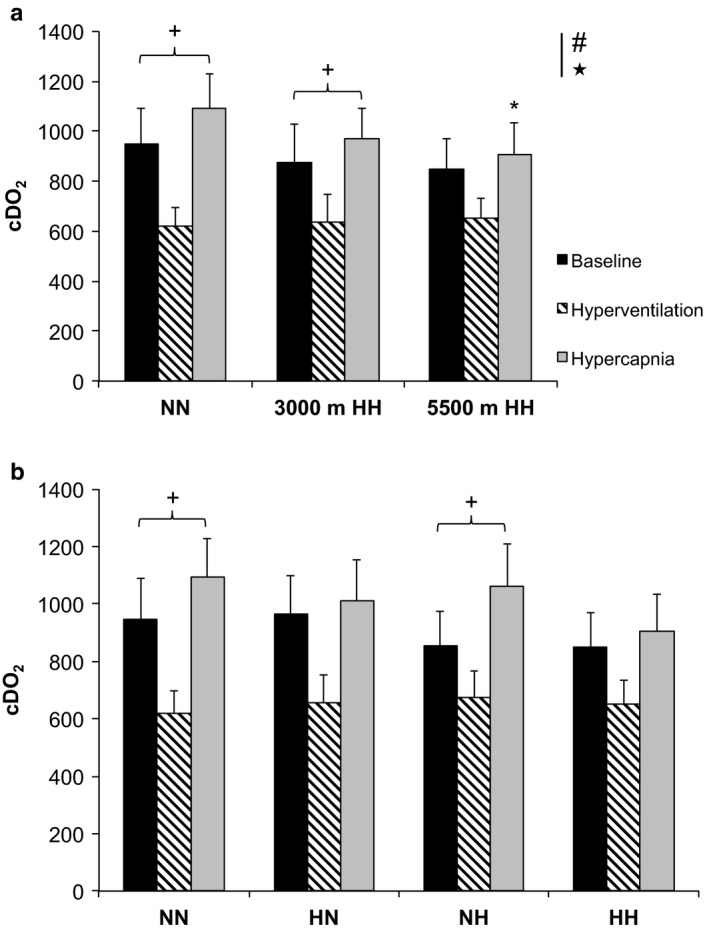
It remains unknown whether hypobaria plays a role on cerebrovascular reactivity to CO2 (CVR). The present study evaluated the putative effect of hypobaria on CVR and its influence on cerebral oxygen delivery (cDO2 ) in five randomized conditions (i.e., normobaric normoxia, NN, altitude level of 440 m; hypobaric hypoxia, HH at altitude levels of 3,000 m and 5,500 m; normobaric hypoxia, NH, altitude simulation of 5,500 m; and hypobaric normoxia, HN). CVR was assessed in nine healthy participants (either students in aviation or pilots) during a hypercapnic test (i.e., 5% CO2 ). We obtained CVR by plotting middle cerebral artery velocity versus end-tidal CO2 pressure (PET CO2 ) using a sigmoid model. Hypobaria induced an increased slope in HH (0.66 ± 0.33) compared to NH (0.35 ± 0.19) with a trend in HN (0.46 ± 0.12) compared to NN (0.23 ± 0.12, p = .069). PET CO2 was decreased (22.3 ± 2.4 vs. 34.5 ± 2.8 mmHg and 19.9 ± 1.3 vs. 30.8 ± 2.2 mmHg, for HN vs. NN and HH vs. NH, respectively, p < .05) in hypobaric conditions when compared to normobaric conditions with comparable inspired oxygen pressure (141 ± 1 vs. 133 ± 3 mmHg and 74 ± 1 vs. 70 ± 2 mmHg, for NN vs. HN and NH vs. HH, respectively) During hypercapnia, cDO2 was decreased in 5,500 m HH (p = .046), but maintained in NH when compared to NN. To conclude, CVR seems more sensitive (i.e., slope increase) in hypobaric than in normobaric conditions. Moreover, hypobaria potentially affected vasodilation reserve (i.e., MCAv autoregulation) and brain oxygen delivery during hypercapnia. These results are relevant for populations (i.e., aviation pilots; high-altitude residents as miners; mountaineers) occasionally exposed to hypobaric normoxia.
Trial registration: ClinicalTrials.gov NCT03303118.
Keywords: cerebral blood flow autoregulation; cerebral oxygen delivery; hypobaria; hypoxia.
© 2020 The Authors. Physiological Reports published by Wiley Periodicals, Inc. on behalf of The Physiological Society and the American Physiological Society.
Conflict of interest statement
The authors declare no conflict of interest and have no financial relationship to disclose.
Figures
References
-
- Ainslie, P. N. , & Duffin, J. (2009). Integration of cerebrovascular CO2 reactivity and chemoreflex control of breathing: Mechanisms of regulation, measurement, and interpretation. American Journal of Physiology: Regulatory, Integrative and Comparative Physiology, 296, R1473–R1495. 10.1152/ajpregu.91008.2008 - DOI - PubMed
Publication types
MeSH terms
Substances
Associated data
LinkOut - more resources
Full Text Sources
Medical
