. 2020 Feb;10(2):190306.
doi: 10.1098/rsob.190306. Epub 2020 Feb 26.

CAP-MAP: cap analysis protocol with minimal analyte processing, a rapid and sensitive approach to analysing mRNA cap structures

Affiliations

CAP-MAP: cap analysis protocol with minimal analyte processing, a rapid and sensitive approach to analysing mRNA cap structures

Alison Galloway et al. Open Biol. 2020 Feb.

Abstract

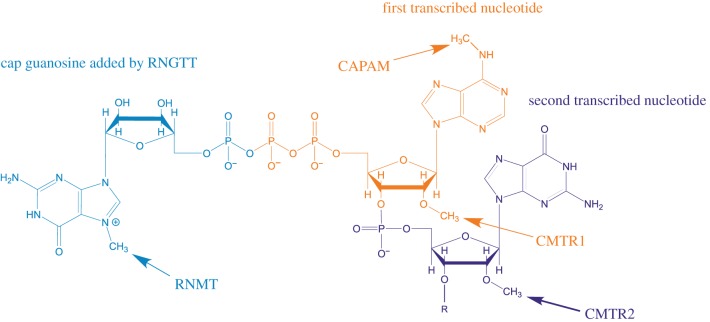
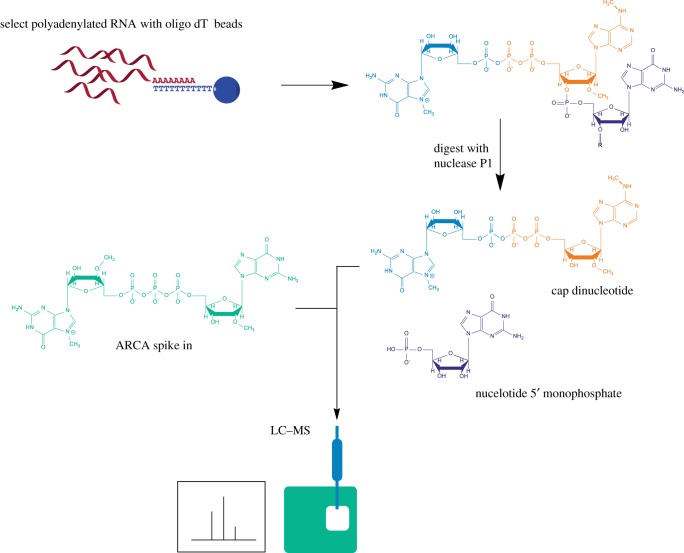
Eukaryotic messenger RNA (mRNA) is modified by the addition of an inverted guanosine cap to the 5' triphosphate. The cap guanosine and initial transcribed nucleotides are further methylated by a series of cap methyltransferases to generate the mature cap structures which protect RNA from degradation and recruit proteins involved in RNA processing and translation. Research demonstrating that the cap methyltransferases are regulated has generated interest in determining the methylation status of the mRNA cap structures present in cells. Here, we present CAP-MAP: cap analysis protocol with minimal analyte processing, a rapid and sensitive method for detecting cap structures present in mRNA isolated from tissues or cultured cells.

Keywords: 7-methylguanosine; RNA cap; RNA methylation; RNA processing; mass spectrometry; ribose O-2 methylation.


Conflict of interest statement

We declare we have no competing interests.

Figures

Figure 1.
Figure 1.
mRNA cap structure. A common cap structure is depicted, including cap guanosine, the first transcribed nucleotide and the second transcribed nucleotide. The sites of action of the capping enzymes RNGTT, RNMT, CMTR1, CMTR2 and CAPAM are indicated.
Figure 2.
Figure 2.
Overview of RNA preparation for CAP-MAP analysis. Cellular RNA is purified on oligo dT-conjugated beads and digested with P1 nuclease to release cap dinucleotides and nucleotide monophosphates. The synthetic cap standard, ARCA, is added to the digested nucleotides. The sample is run on a PGC column coupled to a triple quadrupole mass spectrometer operating in negative ion mode and programmed to detect cap dinucleotides in the MRM mode.
Figure 3.
Figure 3.
Elution profiles of 11 cap nucleotides on a PGC column. Chromatogram showing the differential separation of 11 cap nucleotides on a PGC column. MRM values are indicated to the right of each chromatogram. In the lane containing m7GpppAm and m7Gpppm6A the m7GpppAm elutes earliest.
Figure 4.
Figure 4.
Detection of cap dinucleotides in serial dilution. (a) Peak area measurements from a serial dilution of synthetic cap dinucleotides. Slopes from linear regression of these values were calculated to allow conversion between peak area and fmol (table 3). (b) Peak area measurements for GpppA from a serial dilution of synthetic cap dinucleotides, provided as an example. (c) Table demonstrating overlap in product ions originating from m7GpppG and GpppGm. (d) Detection of m7GpppG across a dilution series. m7GpppG is detected with its unique m/z 800.9 → 635.9 precursor → product ion transition, but it also contributes to the m/z 801.0 → 423.9 and 438.0 precursor → product ion transitions shared with the isobaric dinucleotide GpppGm. The m/z 801 → 423.9 and 438 transition ion current signals from m7GpppG can be back-calculated from the m/z 800.9 → 635.9 precursor → product ion signal and subtracted from the total m/z 800.9 → 635.9 precursor → product ion signal to allow quantification of GpppGm. (e) Compensation for shared ions between m7GpppG and GpppGm. m7GpppG and GpppGm raw peak areas are shown and the GpppGm peak area after correcting for m7GpppG forming product ions at m/z 423.9 and 438. Femtomoles of cap per µg input mRNA are calculated using the linear fit between fmol and peak area (table 3). Each point represents a biological replicate.
Figure 5.
Figure 5.
mRNA cap dinucleotides detected in mouse liver. (a) Abundance of mRNA cap dinucleotides isolated from mouse liver. Each point indicates a biological replicate. n.d. indicates that a cap dinucleotide was not detected. (b) Peak area measurements of different mRNA cap dinucleotides in a serial dilution of mouse liver mRNA. (c) Calculated relative abundance (in fmol µg−1 mRNA) of different cap dinucleotides in a serial dilution of mouse mRNA.
Figure 6.
Figure 6.
mRNA cap dinucleotides detected in mouse organs. (a) Abundance of mRNA cap dinucleotides isolated from mouse liver, activated CD8 T cells, heart and brain. Each point indicates a biological replicate. (b) Data from (a) presented to reveal the abundance of rarer mRNA cap dinucleotides (abundance less than 1 fmol µg−1 mRNA). (c) The ratio of m7Gpppm6Am to m7GpppAm in mRNA from different sources.
Figure 7.
Figure 7.
Impact of CAPAM knockdown on cap dinucleotide abundance. HeLa cells were transfected with scrambled siRNA or CAPAM siRNA for 3 days. (a) Western blot of CAPAM and actin (from re-probing) in siRNA-treated HeLa cells. (b) Abundance of mRNA cap dinucleotides in siRNA-treated HeLa cells. Samples were compared by an ANOVA, with Sidak's post-test-adjusted p-values are shown. (c) The ratio of m7Gpppm6Am to m7GpppAm in mRNA from siRNA-treated HeLa cells. Samples were compared by a Student's t-test.

References

    1. Furuichi Y. 2015. Discovery of m(7)G-cap in eukaryotic mRNAs. Proc. Japan Acad. B 91, 394–409. (10.2183/pjab.91.394) - DOI - PMC - PubMed
    1. Galloway A, Cowling VH. 2018. mRNA cap regulation in mammalian cell function and fate. Biochim. Biophys. Acta Gene Regul. Mech. 1862, 270–279. (10.1016/j.bbagrm.2018.09.011) - DOI - PMC - PubMed
    1. Abdelhamid RF, Plessy C, Yamauchi Y, Taoka M, de Hoon M, Gingeras TR, Isobe T, Carninci P. 2014. Multiplicity of 5' cap structures present on short RNAs. PLoS ONE 9, e102895 (10.1371/journal.pone.0102895) - DOI - PMC - PubMed
    1. Topisirovic I, Svitkin YV, Sonenberg N, Shatkin AJ. 2011. Cap and cap-binding proteins in the control of gene expression. Wiley Interdiscip. Rev. RNA 2, 277–298. (10.1002/wrna.52) - DOI - PubMed
    1. Furuichi Y, Shatkin AJ. 2000. Viral and cellular mRNA capping: past and prospects. Adv. Virus Res. 55, 135–184. (10.1016/S0065-3527(00)55003-9) - DOI - PMC - PubMed

Publication types

LinkOut - more resources